Updated ATAS V5
While traders think more about ocean beaches than price charts, the Orderflowtrading programmers keep working hard on making ATAS even better.
We tried to significantly improve our platform. Don’t miss this update!
What became better:
- architecture and optimisation;
- design;
- operations with working spaces;
- instrument manager;
- chart setting window;
- tape.
Let’s consider each item in more detail.
New ATAS architecture
This change is not very obvious but practically all important modules were optimised – charts, Smart DOM and tape. Moreover, we optimised the work of the servers. We added a new storage format, which allows the storage of data in a more accurate form and for different markets and to change the price increment on the go without reloading the server. And the timely and reliable exchange of data between the servers and the platform is a crucially important part of its operation.
The new architecture is a more microservice one, which allows a simpler scaling of the system. Instrument management became simpler, which allows uniting all instrument into one version.
New desing
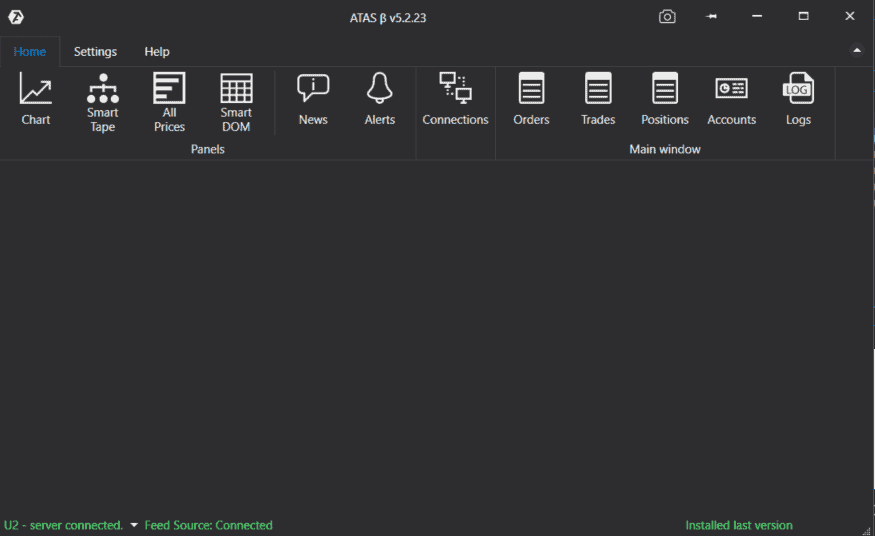
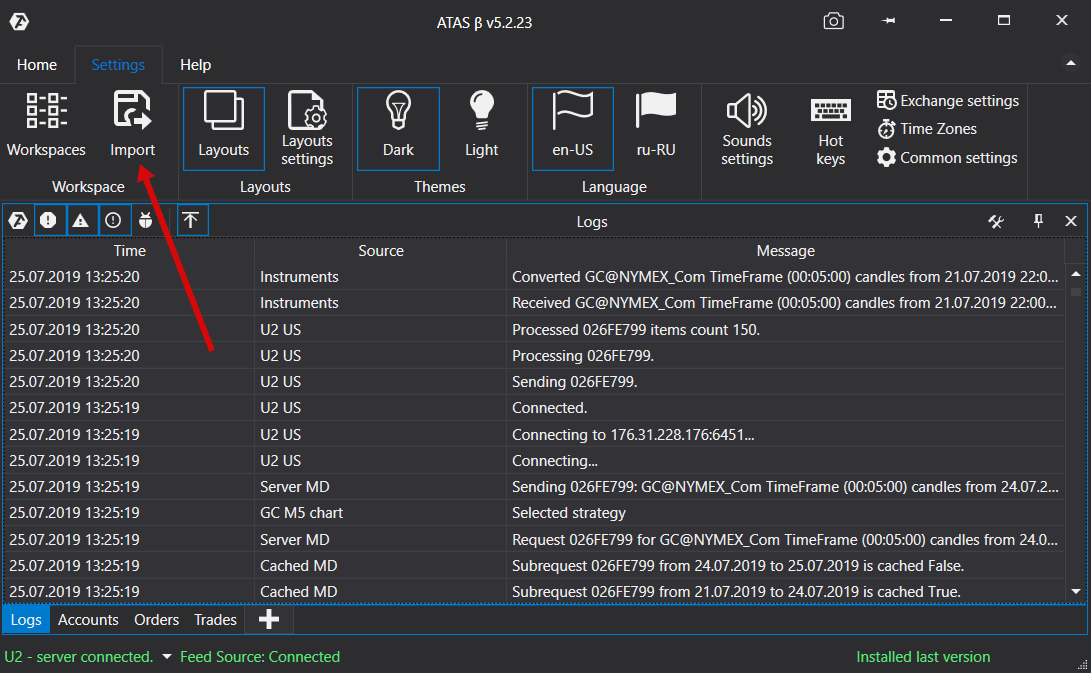
Design of the main platform window has changed. Menu became more intuitive and clear. Everything is organised in tabs. There are new functions, such as import of the working area and downsizing of panel elements at downsizing of the main window of the platform.
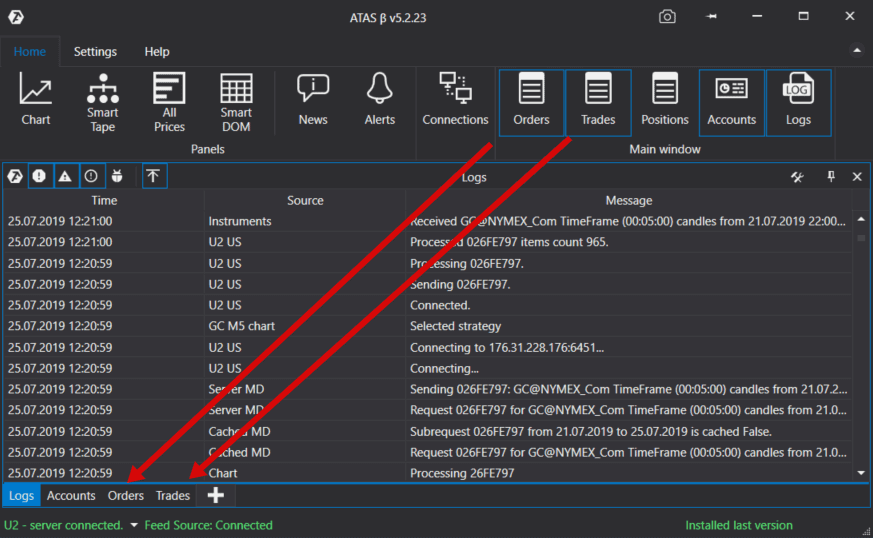
You can also control tabs of the main window through turning on/off their display in the bottom menu of the main window.
Note that the window cloning button is available in each module and chart.
Renewed instrument manager
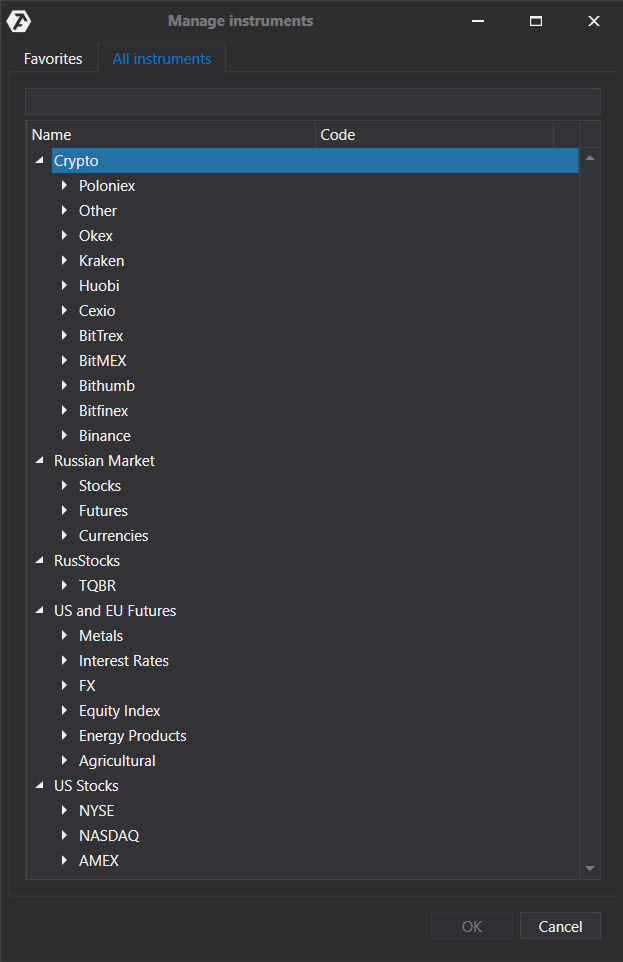
Reorganisation of the manager of accessible instruments has been done. Each market (exchange) is taken to a separate catalog. Futures, stocks and cryptocurrencies are separated.
A complete list of stocks, futures and currencies trading instruments of the Moscow Exchange (MOEX) has been added. You can analyze MGNT, YNDX and other previously inaccessible stocks.
In order to add a necessary instrument into Favorites you just need to click a star.
Chart settings
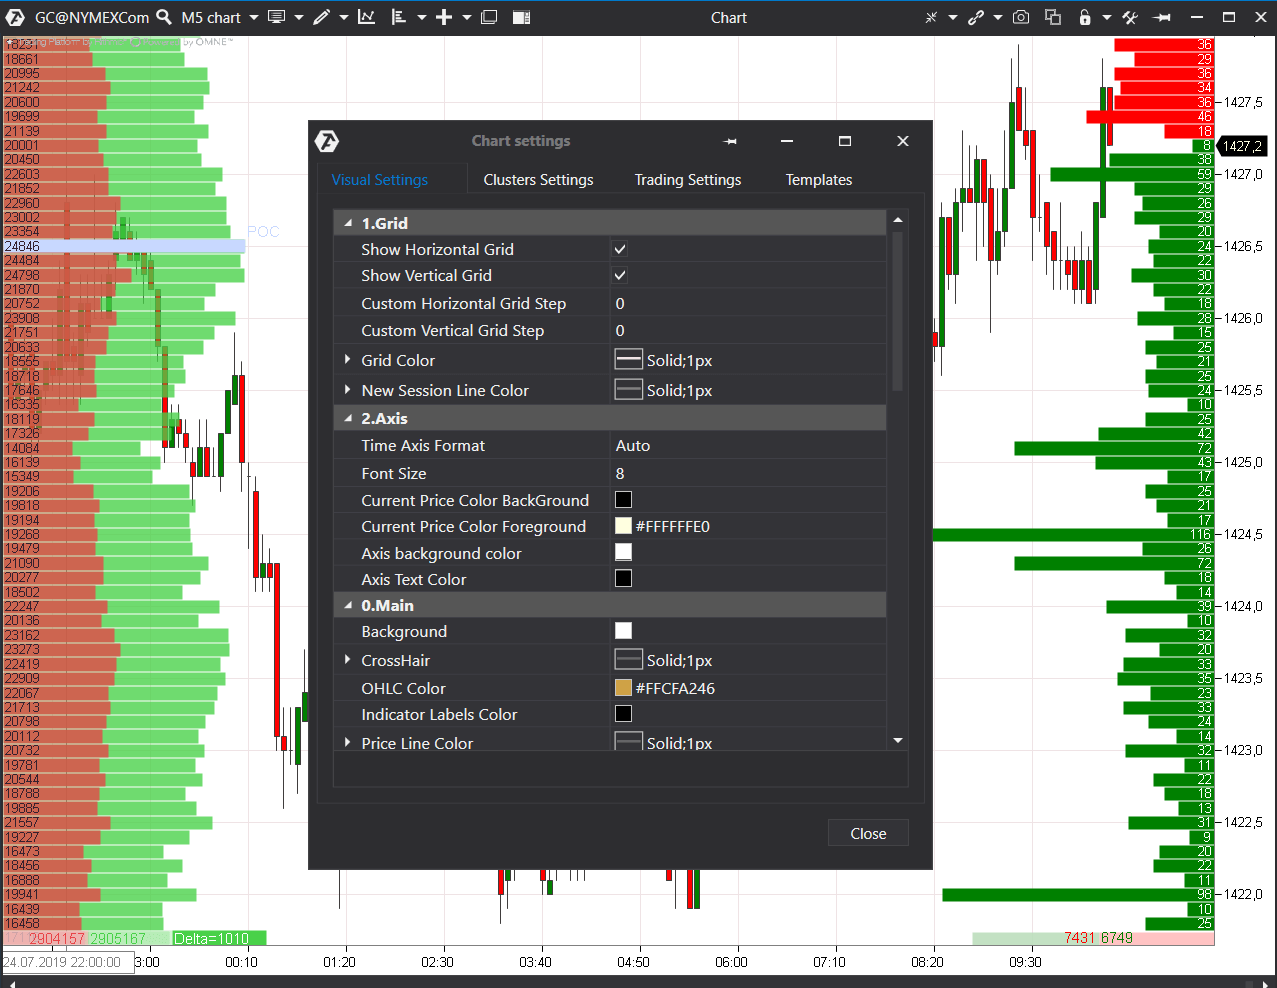
All chart settings are available in one popup window, the size of which can be changed now. The following settings are available:
- visualization, chart design, colours and labels;
- cluster settings – for the footprint (what a footprint is) charts;
- trading parameters;
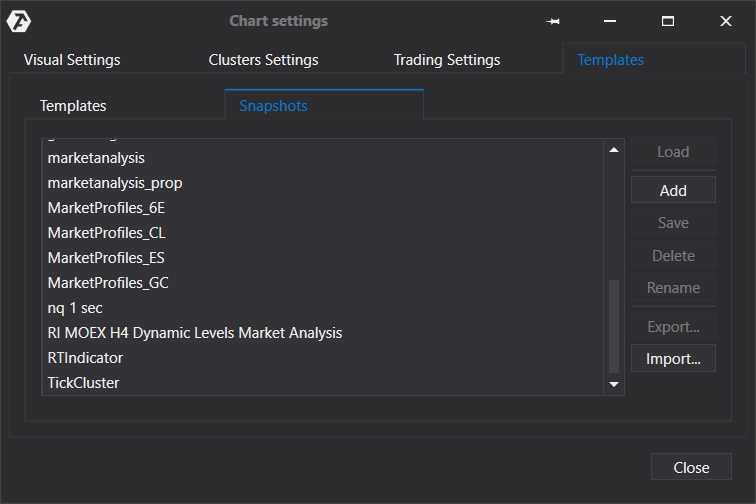
- the tab for loading and saving templates and snapshots has been moved.
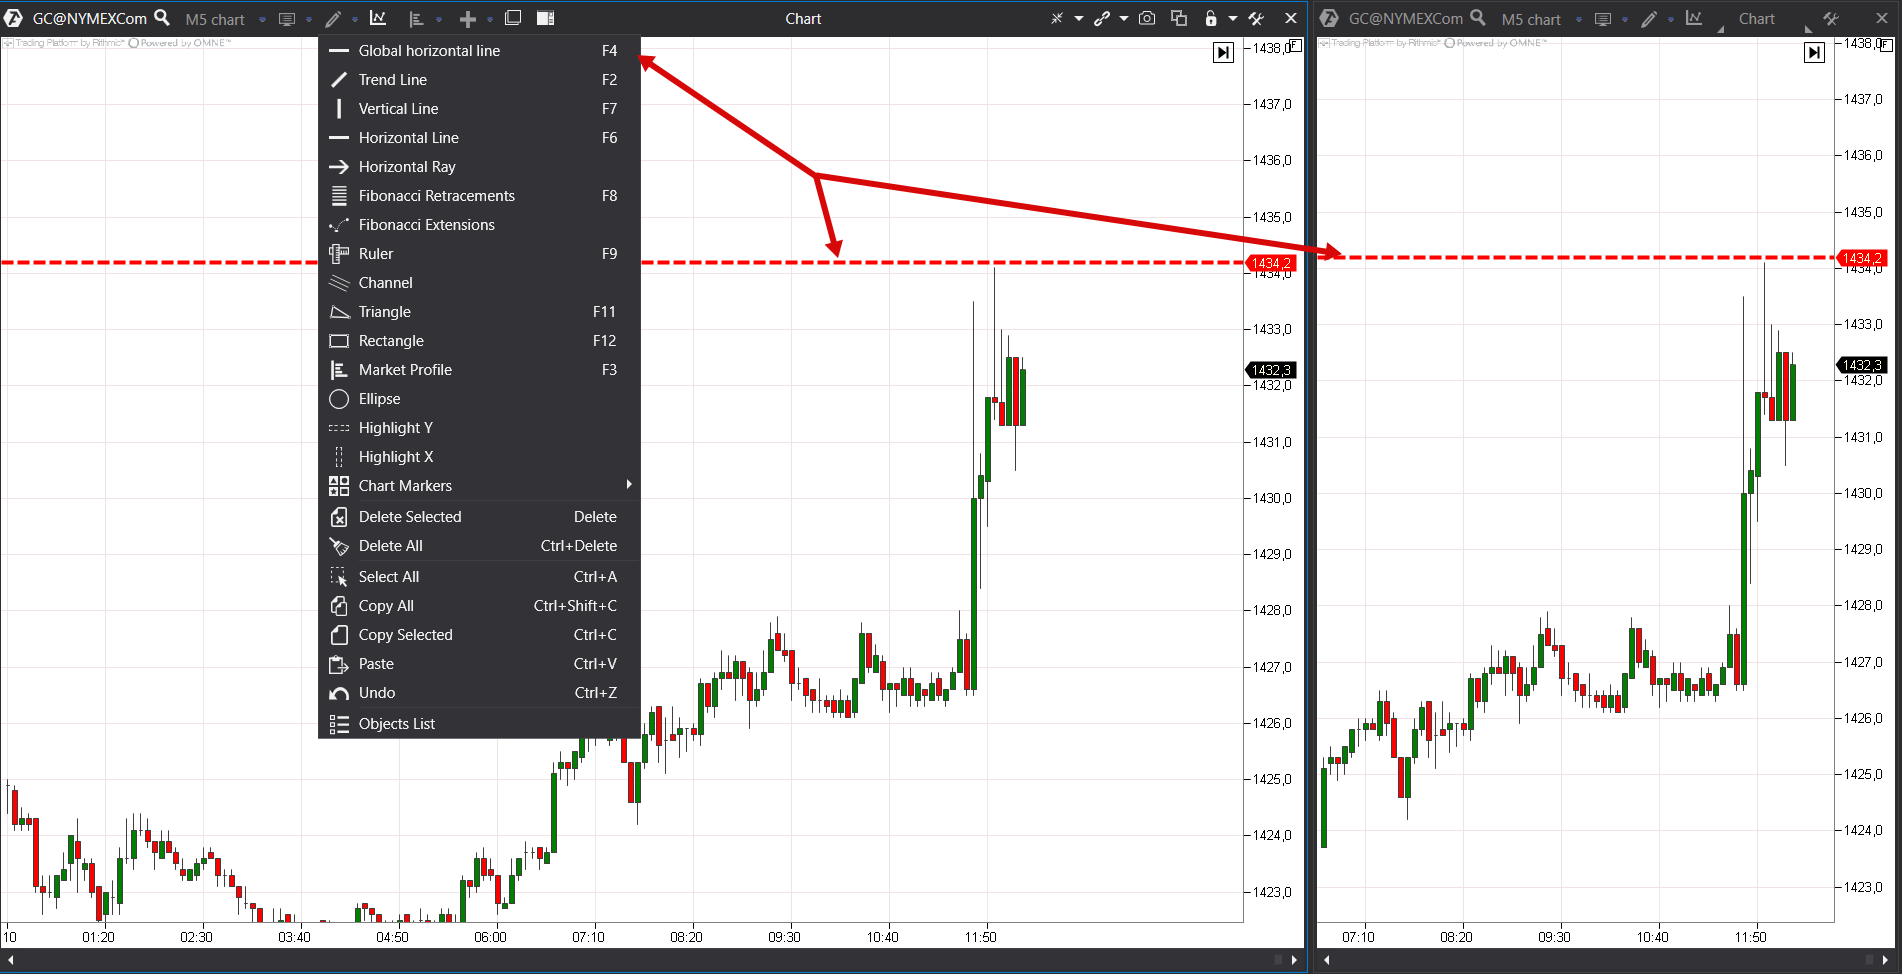
A new drawing object has been added – Global horizontal line (F4 hot key). If plotting this line, it is automatically duplicated on all other charts with the same instrument. Visual settings will also be synchronized on all charts for this price level.
By the way, a couple of words about templates and snapshots.
The templates, snapshots and working spaces files have different extensions now.
- cst – snapshots;
- cts – templates;
- ws – working spaces.
You shouldn’t worry that you would need to reconfigure everything again.
A possibility of import of working spaces from the previous version has been added into the new version of the software. To do it, you need to save the working space file beforehand, then click Import in the main window settings and find the saved working space in the opened menu. In ATAS version 3.x.x. it is located in the Documents / Advanced Trading Analytical Software / layouts folder.
In case you transfer the working space from the ATAS 4.x.x. crypto-version, you need to go to the Documents/ATAS Crypto/layouts folder. The working spaces are stored in the Documents/ATAS Crypto Trader/layouts folder in the ATAS 5.x.x. crypto-version.
Window layout
Do you see the navigator menu with cross lines in the center of the screen?
It is activated automatically when you drag and drop one window/chart onto another one. Lay out windows on the display in the most convenient way. Just drag-and-drop windows and modules in those sections of the screen where you want to see them. ATAS will ‘stick’ the windows together in one big working space. Then you just set the windows inside the working space by width and height and adjust the working area itself. It is an absolutely flexible solution, which allows fitting into a display with any resolution.
Tab layout
The new ATAS version provides more convenience for working with various periods / markets / papers / indicator settings. Now you can significantly save space and conveniently switch between different charts not from the Start panel, but from the bottom menu of a chart itself. To do it, you need to drag the chart window and drop it in the central area of the navigator, as it is shown in the picture.
You can organize your trading with a multitude of charts just switching between the tabs of working layers. Now this function is added into the upper panel of the chart from the right side.
Calculation logic
Horizontal bar chart / Tape / DOM / All Prices and other functionality elements calculate now what is loaded in the chart. In other words, if a Continuous contract is opened, the horizontal bar chart processes all executed trades on the contracts, which were shown in Continuous for the selected period.
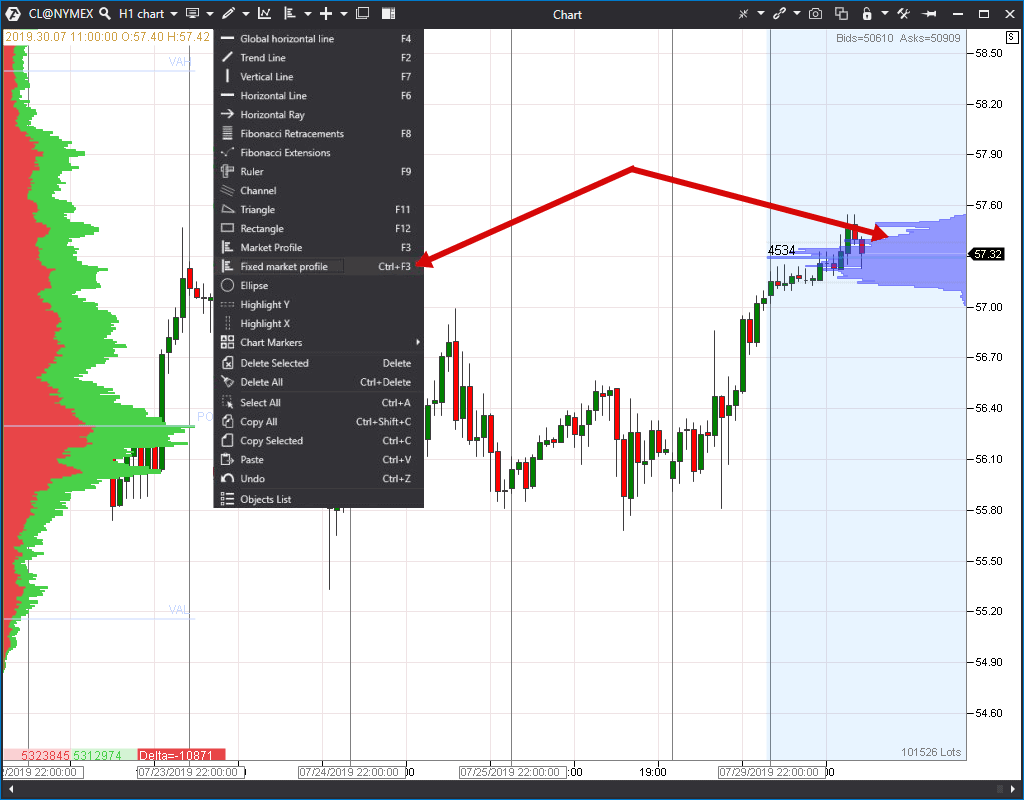
Also, one of the innovations was a fixed histogram on the right side of the chart. Now you can add several horizontal histograms to the chart, set the required period and visual display to each one and save the working space. This histogram will have settings with a choice of a fixed period for building a profile and location on the chart.
Smart Tape and All Price
Insignificant changes were introduced into the Smart Tape and All Prices. To freeze up the order flow movement in the Tape, click the snowflake in the upper panel.
Now it is more convenient and simple to add and remove columns in the Smart Tape.
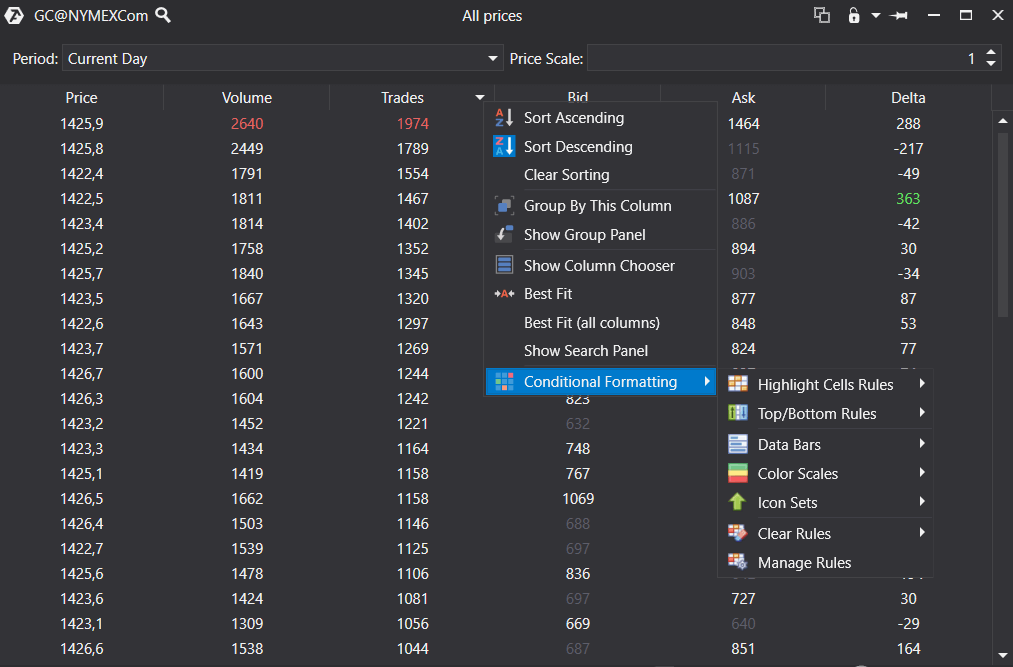
A possibility of additional formatting has been added to All Prices. The display of important statistical data has become more advanced and convenient.
Hot updates and upgrades
In this section, we will describe the most recent updates and upgrades of the ATAS Beta platform. First, make sure you have the most recent platform version installed in order to use the following:
- news module;
- ‘selected’ for templates;
- adaptation of TPO and Profile;
- improvement of DOM Levels.
News module
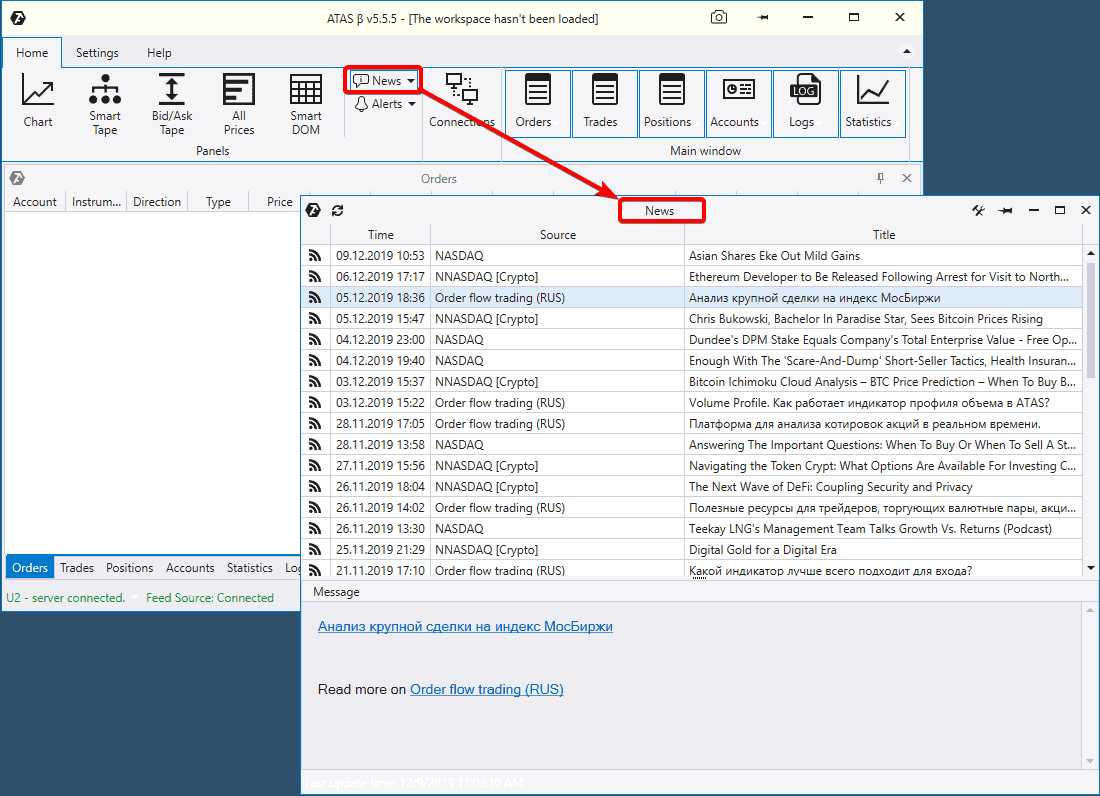
Press the News icon in the main window of the platform and the News module will be opened.
We fill the module with topical information:
- news of authoritative agencies;
- decent analytics;
- links to the articles from our blog.
The News module will help you to stay informed and not to miss important events.
‘Selected’ for templates
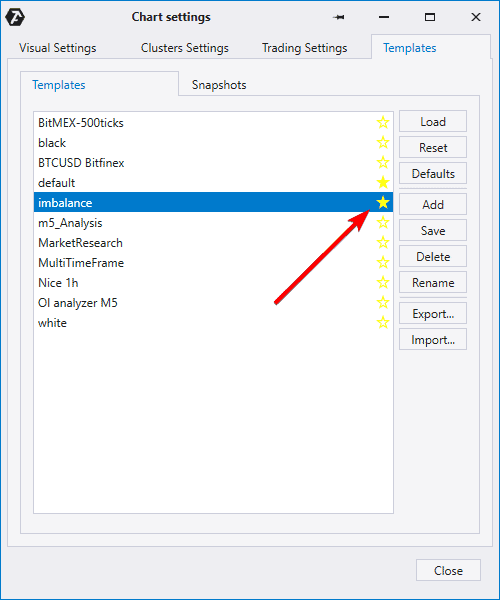
Do you use many templates in your work? The ‘Selected’ function would allow you to make your work more comfortable. Just call the template manager as you usually do and mark the selected templates with a star (as it is shown in the picture below).
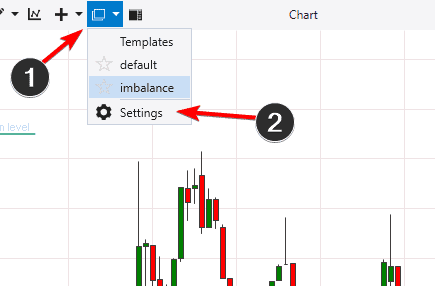
After that, the selected templates will be listed first when you click (1) the template icon in the Chart module.
Consequently, if you click ‘Settings’ (2), you will go to the manager with the whole set of the used templates.
Adaptation of TPO and Profile
Working with horizontal volumes is one of the most popular functions in ATAS, that is why we constantly introduce useful improvements in the instruments for the analysis of various market profiles.
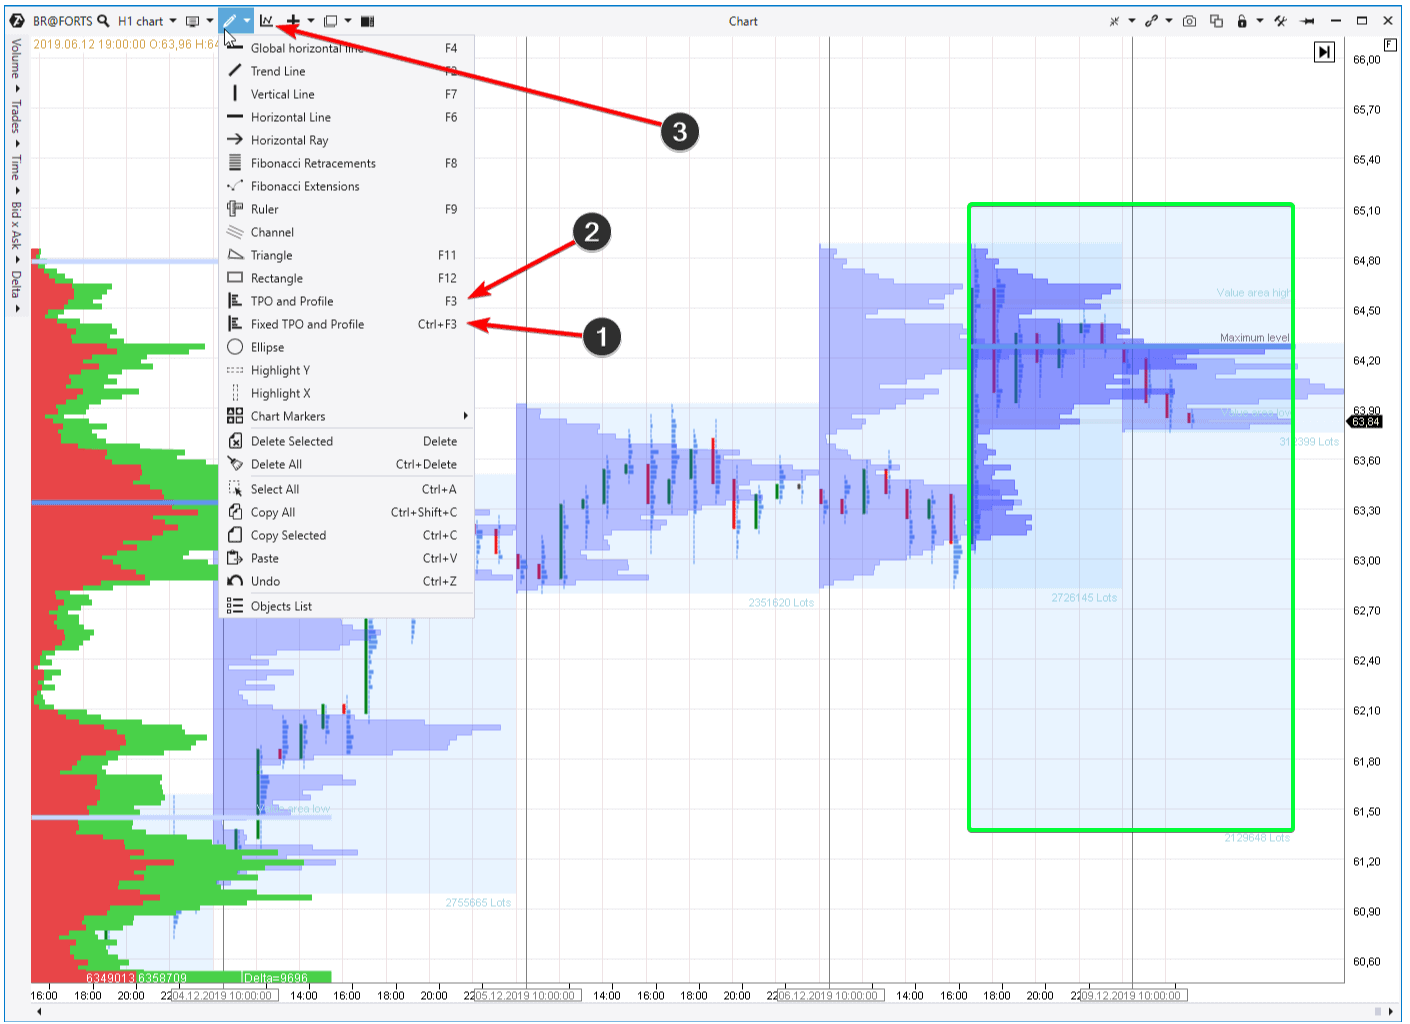
There are 4 main instruments for working with profiles in ATAS and all of them are shown in the picture below.
- Fixed TPO and Profile. It is called from the Drawing menu or using the hot combination of ‘Ctrl+F3’. It is shown to the left in the chart – the volume bar chart with the division into Bid-Ask (red-green bars).
- Arbitrary TPO and Profile. It is called from the Drawing menu or pressing F3 key. It is shown in the right part of the chart (marked with a green frame). This instrument immediately builds a profile for any fragment in the chart, which you mark with the mouse. In the above case, we marked the current session and a part of the previous one.
- TPO and Profile indicator. It is called from the Indicators menu or using the hot combination of ‘Ctrl+I’. It is shown in the form of violet transparent profiles, which cover 1 session (the period is 1 day).
- The profile as a cluster type. The above chart has the cluster format with 1 hour period. Violet clusters show trading activity by the levels inside each hour.
As you can see, the set of instruments is maximally wide. It will allow you to conduct the analysis with flexibility and convenience.
What are TPO and Profile, what are their differences and how to conduct the analysis? These are subjects for individual articles and you can read them using the following links:
Improvement of DOM Levels
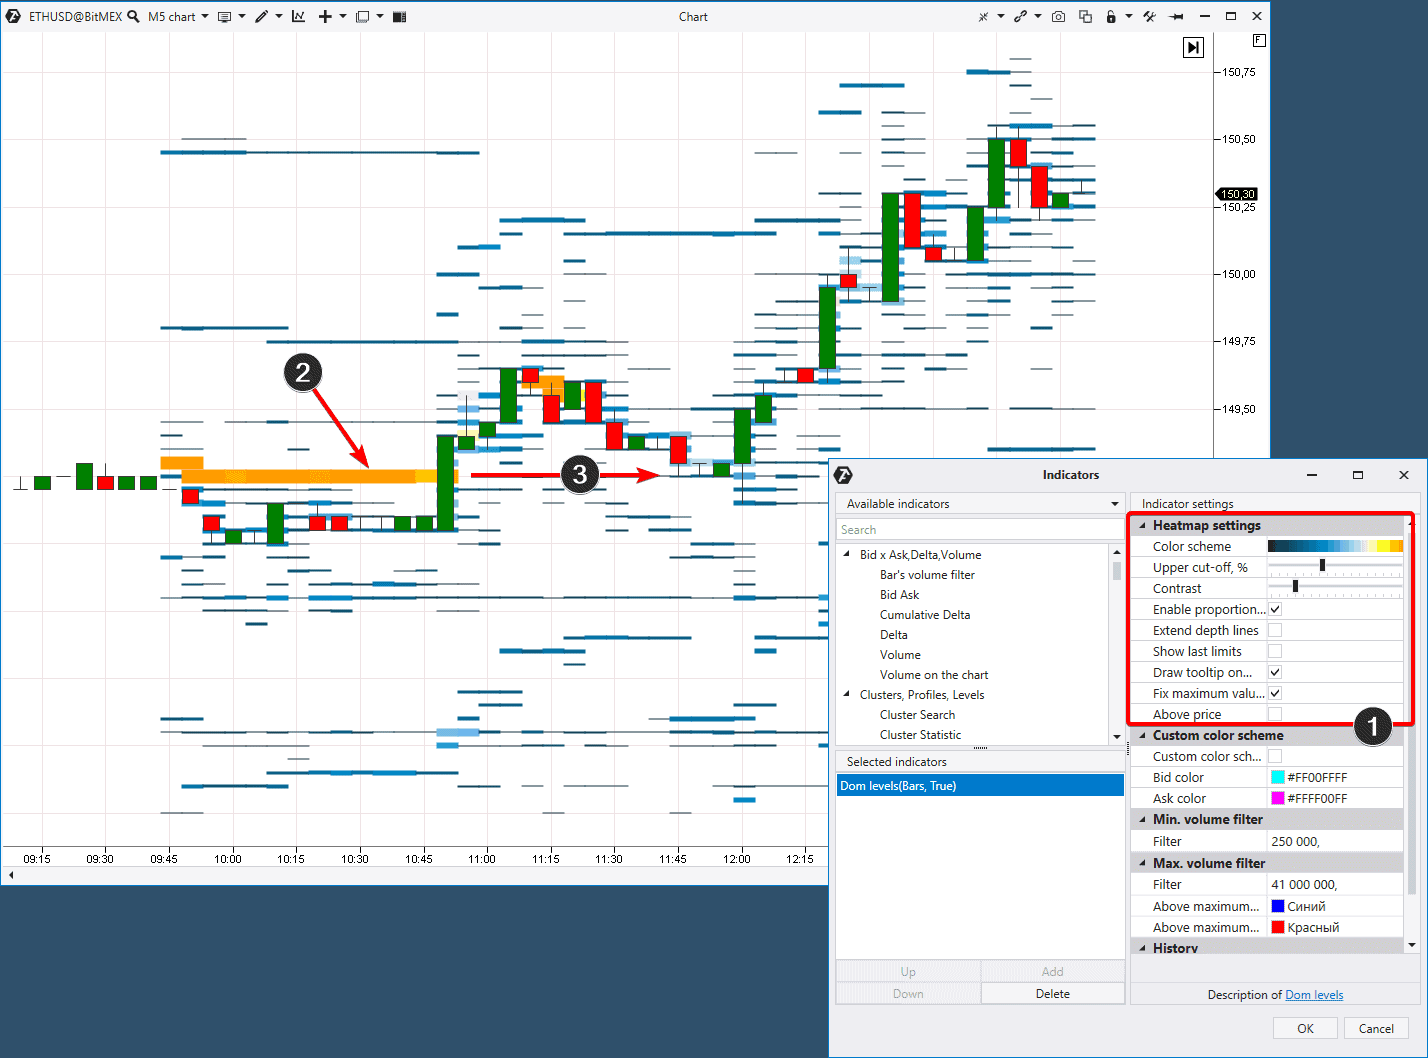
Dom Levels is the indicator for building levels on the basis of the data from the Smart DOM. A new Heatmap block is available in the recent versions in the indicator settings.
- This block of settings, which includes a selection of colour grades, sensibility and automatic proportions, will make your chart more esthetic and clear.
- Have a look at it. The indicator points to a big volume from the Smart DOM using the line colour and thickness. When this level was broken …
- … it served as a support for further growth.
Plans for the future
As you can see, many important and appropriate changes have been introduced. We try to make your ATAS experience as comfortable as possible and help you to reach the main goal – trading in harmony with the market.
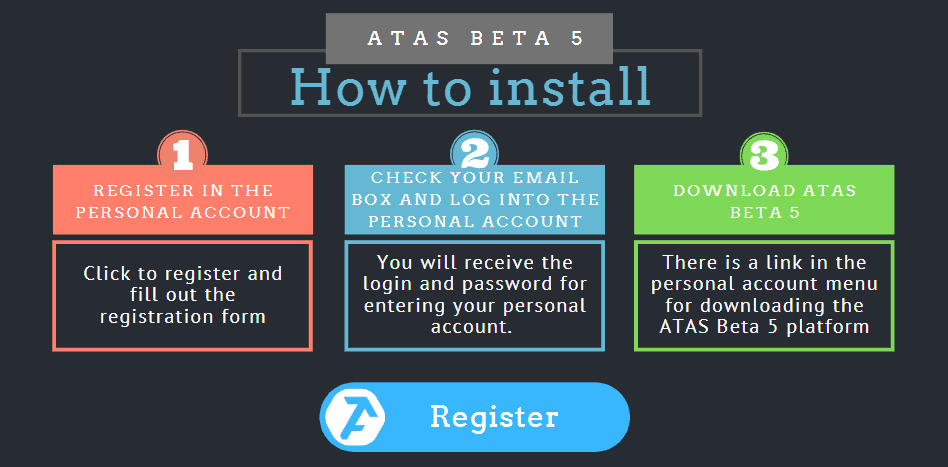
Try the latest ATAS Beta 5 version through registering in the Personal Account and downloading the installation file.
We started a new forum thread specifically for the new Beta version and we invite you to write your wishes, make comments and describe the problems you faced in the process of using the platform. Share your impressions – we appreciate your opinion.








Buenos días
soy usuario de su plataforma ya hace como uno o dos años, e notado algunos inconvenientes con la volatilidad del mercado, la plataforma se queda freezada espero que en esta nueva versión ya no suceda este problema, me gustaría que se pudiera hacer replay esto no solo nos ayudaría a nosotros los traders sino que ustedes tendrían muchísimas mas ventas de este software, también como en los otros softwares ajustar sus precios ya que son elevados aunque se la calidad que ofrecen pero son poco elevados, sino pueden solucionar lo de el valor del software por lo menos habilitar códigos para que nosotros los que referimos a la plataforma podamos invitar a que compren de por vida su software con algún tipo de descuento, estoy seguro que esto aumentaría sus ventas en mas del 50 %.
por ultimo quisiera felicitarles por que este software es muy bueno y se ve que cada día trabajan mas fuerte para hacerlo mejor saludos y éxitos
instagram ********
trader colombia
CRISTIAN ********
CEL. *********