View COT report data directly in the ATAS platform charts
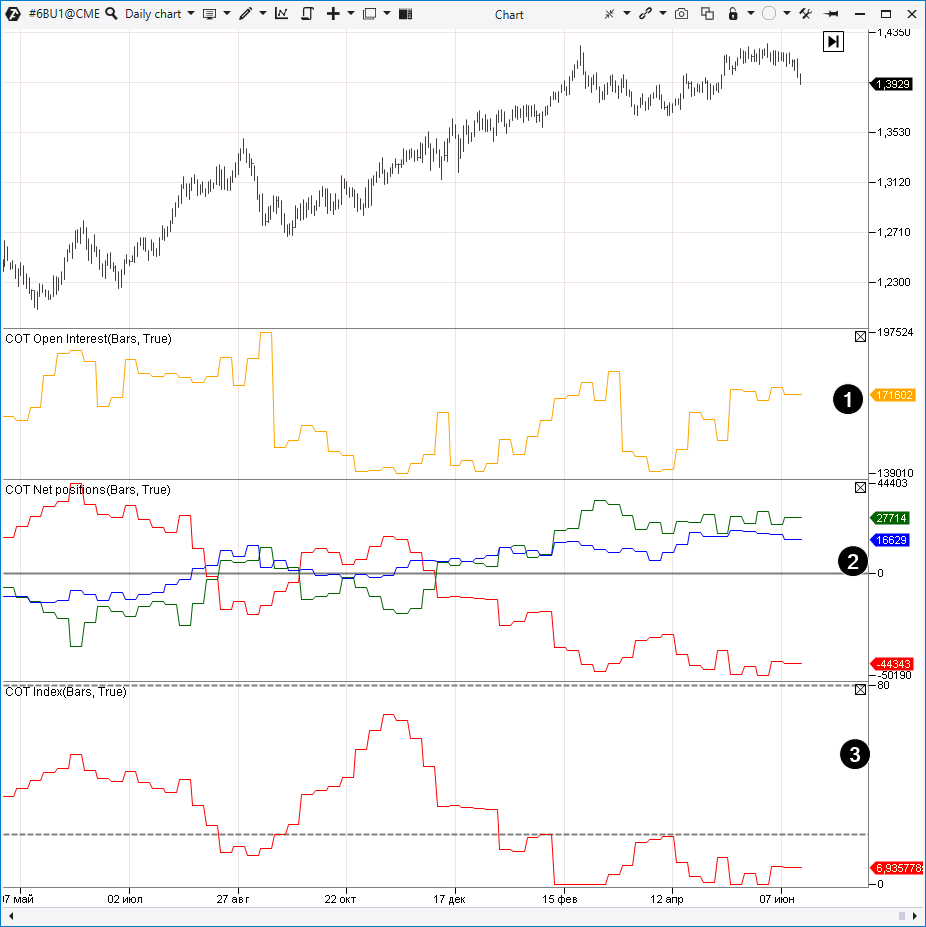
Starting from version 5.7.22.2 three indicators for working with COT reports were added to the trading and analytical ATAS platform:
- COT Open Interest.
- COT Net Positions.
- COT Index.
See display examples in the GBP futures (6B) chart below.
The goal of this article is to help as much as possible in using valuable data, provided by COT indicators.
Read in the article:
- What COT reports are and where to take them from.
- Types of COT reports and what they show.
- Advantages and disadvantages of COT reports.
- How to load a COT indicator to the chart.
- Examples of trading strategies.
- How to combine them with cluster charts.
What are COT reports?
Commitment of Traders (COT) reports show trader positions in the futures and options markets. Usually, these data are collected at the Tuesday trading session closing and are published on Friday night (3:30 PM Eastern Time).
Reports are prepared by the Commodity Futures Trading Commission (CFTC, which was founded in 1974) – a US government body. The CFTC vision is to facilitate integrity, sustainability and dynamic development of the US derivative markets through reliable regulation.
COT reports help to commit this mission. They provide market transparency, they are aimed at avoiding bubbles and wrecks and at fighting manipulations on the exchange.
Moreover, these reports provide an excellent instrument for making trading decisions. However, this instrument, first of all, is for those who trade on daily and weekly charts. If you add COT indicators to the intraday chart, you will see horizontal lines only.
Where to take COT reports from?
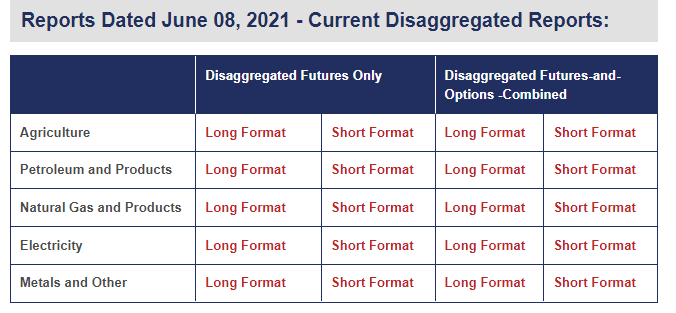
All COT reports are published on the official CFTC web-page: https://www.cftc.gov/MarketReports/CommitmentsofTraders/index.htm.
You can always find the most recent COT reports on this web-page.
The reports sum up the number of contracts, which market participants hold with consideration of direction (long or short).
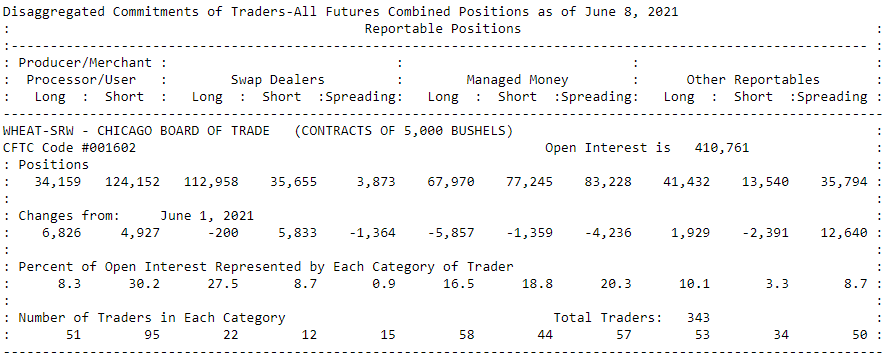
You can see one example on the wheat futures market in the picture below:
The report contains information about:
- Open Interest;
- trader positions with consideration of the trader categories and position direction;
- position / interest dynamics;
- quantitative statistics of each category.
What are COT report types?
First, the reports are split by industries – agricultural market, metals, finances and others.
Second, they can be presented, by the degree of detail, in the Long format (more detailed) and Short format (only basic data). The Short format is sufficient enough from the practical point of view.
Third, as regards the data coverage, the reports may include only the futures market data or combine the futures and options data.
Fourth, there are several structure types of the reports:
Legacy (or Classic) type. This is the most popular report type, which is published from the 1980s. Study of the historical data shows its value, that is why it is respected and used by professionals.
- Commercials – commercial participants. As a rule, they are related to the real sector of the economy.
- Large Speculators (or Non-Commercials) – major speculators.
- Small Speculators (or Non-reportable) – minor private traders and speculators.
Disaggregated and TIFF (Traders In Financial Futures – reports on financial futures trader positions) types. These types were presented in 2009. They take into account the specific nature of an industry and introduce more details into the Commercials, Large Speculators and Small Speculators categories.
CIT (Supplemental Commodity Index) type. It was introduced in 2007 to show positions of funds, which invest in commodity markets.
Advantages and disadvantages of COT reports
The main advantage is that the reports contain trustworthy information about trader positions in the market, which helps to understand the real market tone and assess the trend strength.
Disadvantages:
- The reports are published only once a week plus with a certain delay. This reduces their value for short-term traders.
- The reports are on the web-site in tables, which is inconvenient in practice when comparing with the price chart.
In order to level the above listed disadvantages, COT report indicators were added to the ATAS platform. They provide valuable information for analysis in a convenient form for the users, who may use it in various trading styles.
How to add/set-up COT indicators?
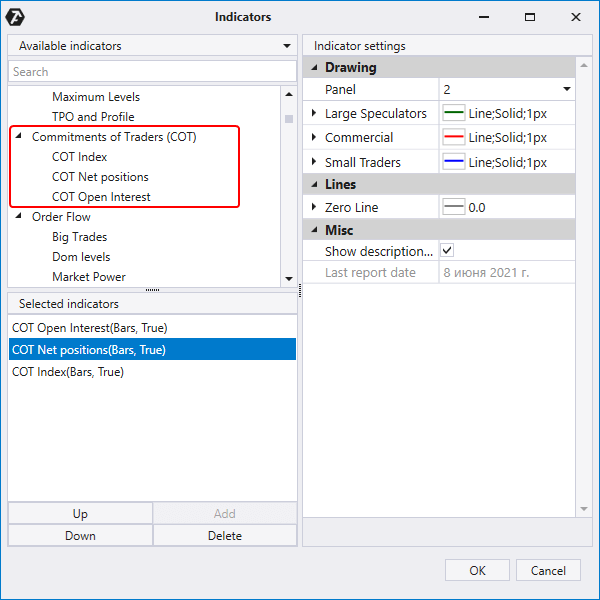
Indicators are added in a standard way in 3 simple steps:
- Open the Indicator Manager from the Chart window menu or press Ctrl+I.
- Find the Commitments of Traders (COT) section in the list.
- Add the required indicator from the section by pressing the Add button.
Each indicator from the Commitments of Traders (COT) section has very simple settings where you can change only display parameters (color and line type) and select the display window
Specific features of COT indicators
As you know, COT indicators work only in the markets, which report to CFTC. For example, COT indicators will show zeros in the charts from cryptocurrency exchanges. It is also important to understand that it is more convenient to work with the indicators on the daily or weekly periods.
We should also note that the Net Positions indicator uses the classical (Legacy type) split into 3 categories: Large Traders, Small Traders and Commercials for all instruments. Recalculation of categories from the TIFF report is done automatically.
As regards relevance of the indicator values, you should keep in mind that the reports, which are published on Friday, show trader positions as of Tuesday – 3 days before. That is why, if there were strong movements on Wednesday or Thursday, they will be shown in reports on the next Friday only. Of course, this is a significant delay but not very crucial from the point of view of middle-term/position trading when a position is held longer than one day/week.
For your convenience, the ATAS platform shows changes of the COT indicator values on Tuesday, when they were relevant. However, the change itself takes place on Friday only.
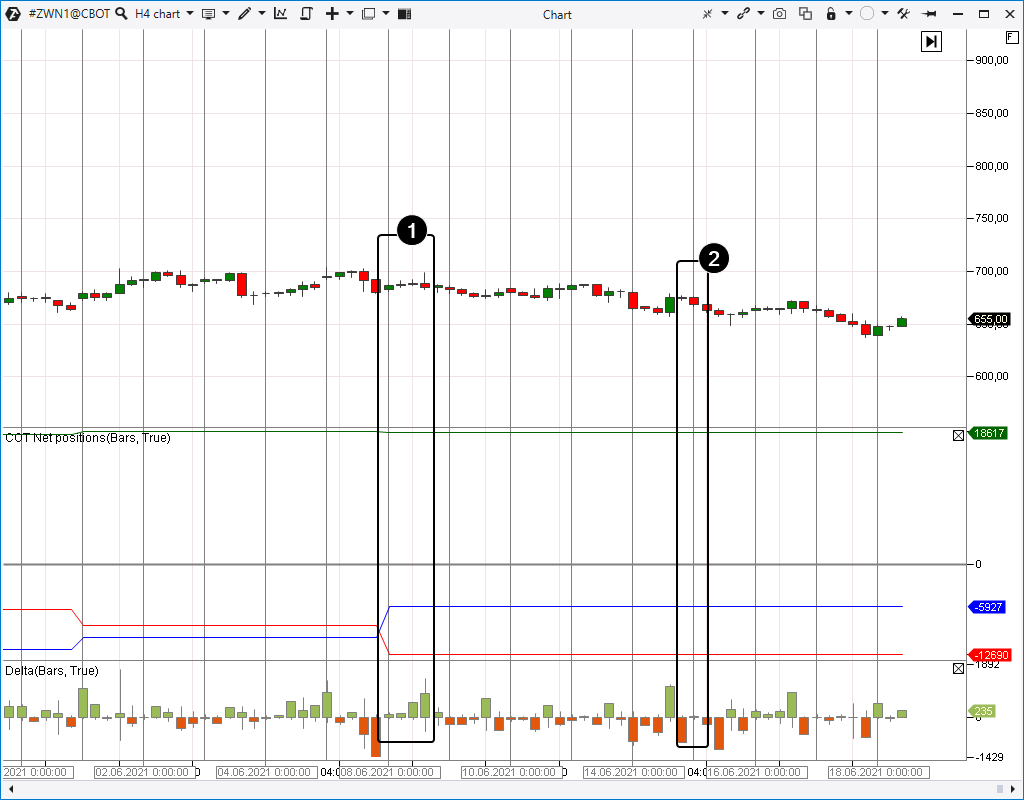
For example (see the wheat futures chart below), you can see on Friday morning June 18, 2021:
- The Net Positions indicator values on Tuesday June 8 (it was published on Friday June 11);
- The June 15 values stay the same (there has been no publication yet). When new data appear, they will be added to the chart ‘post factum’.
By the way, publication of the COT report might be delayed due to holidays.
We hope that this explanation will avoid your question about ‘why the COT indicator is not refreshed’. Patience is an important component for working with COT reports.
How to analyse COT indicators
Detection of significant disbalances in positioning various trader categories lies in the basis of COT analysis. If, for example, Commercials in the wheat market have a clear long position (which means they have more open long positions than short ones), we may assume that the wheat market insiders count on the price growth (or hedge against reduction, which is, in fact, the same from the point of view of the buying pressure).
Analysis of the Commercials line
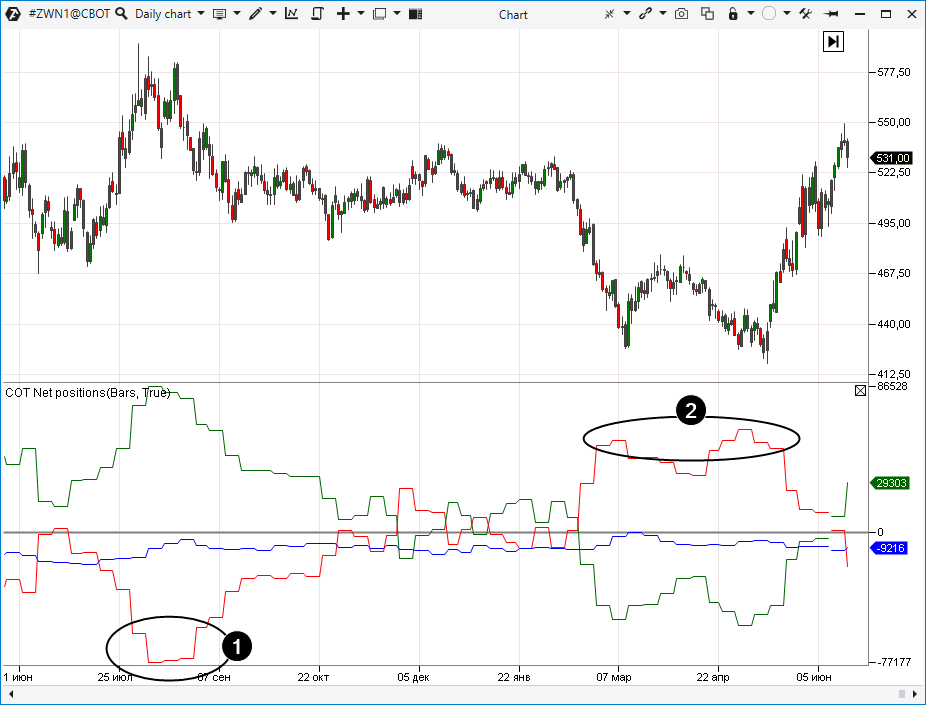
Let’s consider an example from the year 2019.
Number 1 shows how Commercials had an extremely negative opinion about the market future, since it was expressed ‘by deed, not by word’, namely, by the short position domination. Wheat was traded at that time above USD 550.
Commercials (красная) и Large Speculators (зеленая) как бы переплетаются.
Indeed, further price decrease to the USD 490-520 range confirmed that the price of more than USD 550 was too high and the fair price was lower. By the way, note that the Commercials line (red) and Large Speculators line (green) as if interleave with each other during the flat (between numbers 1 and 2).
Number 2 marks the opposite situation. When the price decreased to USD 470 and below, the red line moved up. It means that traders from the Commercials group started to open long positions since they decided that the current price was too low. Further development confirmed the correctness of their considerations because the quotations moved later to the range of the previous flat of USD 490-520.
By the way, the wheat futures market has its own agroindustrial specific nature. We have an individual article about wheat futures (ticker: ZW).
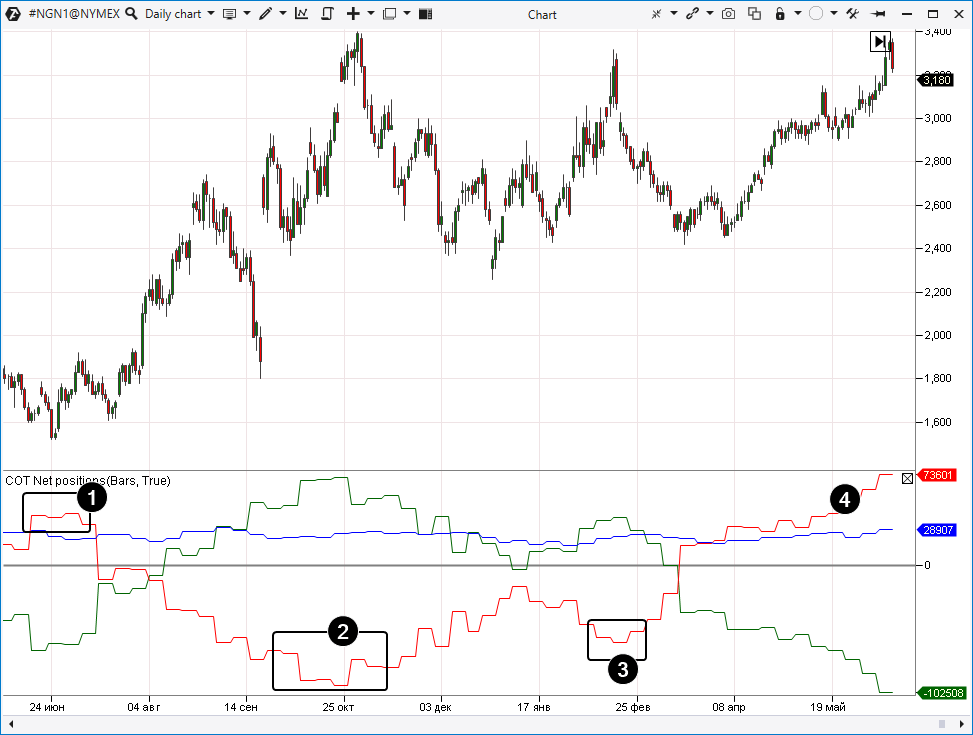
The above example showed that Commercials have a property to be proactive, predicting, in so doing, the future price. Let’s check this property through the natural gas market example.
Number 1 shows that a majority of traders from the Commercials group took long positions just before the price growth from 1.8 rather shrewdly in the summer of 2020.
Number 2 shows activities (although premature ones) in opening short positions in the fall of 2020.
Later (number 3), some Commercials successfully shorted the price leap in the winter of 2021.
However, the current (at the moment of writing the article) increase of the natural gas price has, according to this group of traders, potential for further development.
In general, we can say that the red line (which reflects the difference between long and short positions, opened by the Commercials group traders) could be used as the head-start reversal indicator. But of course, the indicator values cannot guarantee that the reversal is inevitable.
Analysis of the Large Speculators line
As a rule, the Large Speculators (green) and Commercials (red) lines demonstrate a reverse correlation. An idea arises that the Large Speculators representatives often make losses. Is it so?
It is obvious that not a single participant of exchange trading could be completely insured against losses, but if Large Speculators made losses in the end, they would go bankrupt and CFTC wouldn’t track their positions. But it is not so.
As a rule, Large Speculators are on the proper side of the market during a trend. COT data confirm the old trading saying: if there are no buyers left, prices cannot grow further and will start to go down. The opposite picture is true for the insufficiency of sellers.
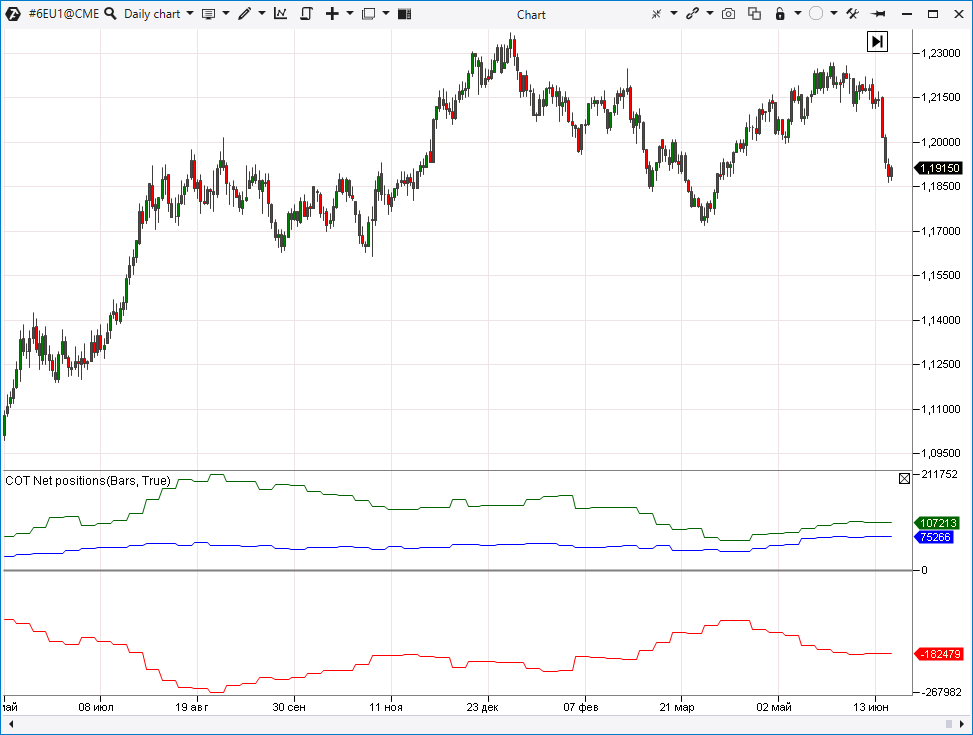
Below is an example from the EUR/USD futures (ticker: 6E) market on the CME.
Large Speculators mainly held long positions during the uptrend from the summer of 2020 until the summer of 2021. However, every next peak on the indicator line is lower and lower. It turns out that Large Speculators act as if they support the trend and, when the support is exhausted, the trend ‘runs out’.
In this context, it is interesting to analyse positioning of different trader groups during the exchange panic in the spring of 2020, which stemmed from the coronavirus extension.
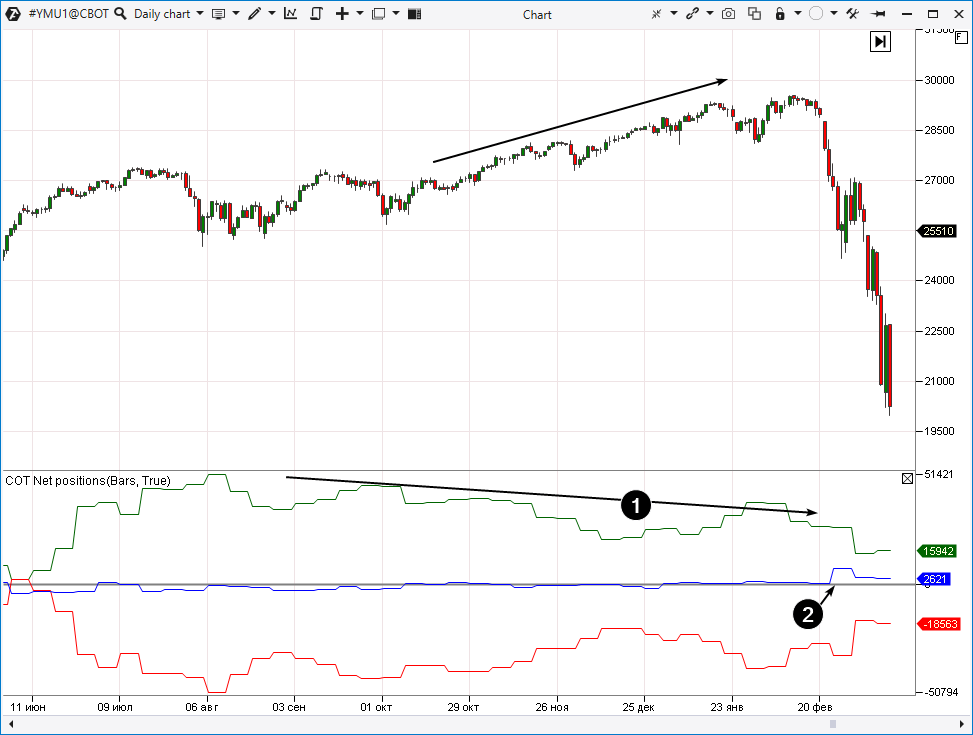
The chart below shows price dynamics of the popular E-mini futures asset on the Dow Jones stock index.
The green line shows as if Large Speculators expected a serious panic. Despite the stable growth of the contract price, they, most probably, took profit by longs, that is why we have the price and green line divergence (as it is marked by arrow 1).
It is interesting that Small Traders (blue line)responded to the market fall very quickly by opening long positions sharply (as arrow 2 shows). However, they got into a trap and, most probably, they lost money during this fall.
Analysis of the Small Traders line
The blue line shows the positioning of the least capitalized group of traders. They hardly possess power to influence market prices in any way, however, their behaviour may help to understand the market tone.
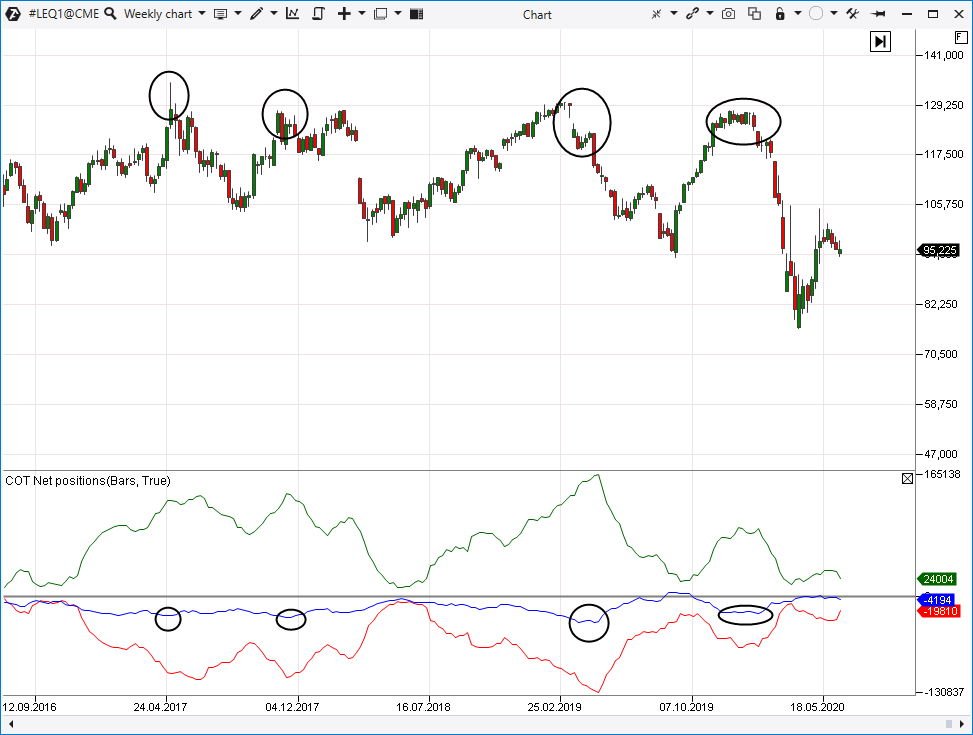
Moreover, Small Traders possess a special property in some markets. For example, Live Cattle futures. Many cattle farms get into the Small Traders category. Their activities (hedging or speculating) bring more weight to the opinion that the price is near its extreme points. It is demonstrated by circles in the chart below (ticker: LE; CME; daily period).
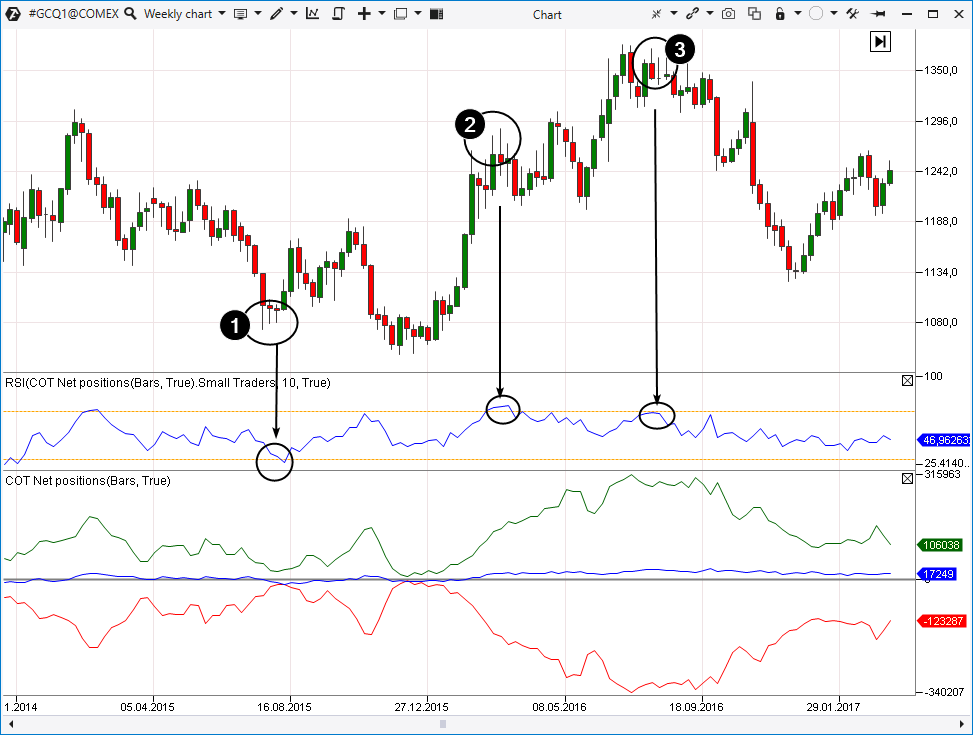
However, Small Traders are less successful in the gold futures market (below is the daily period chart for 2015-2016).
Note that we added the RSI indicator to the chart and selected Source = Indicator / COT Net Positions / Small Traders in the settings. It is required for analysis convenience, since the Small Traders values are not so large in the Commercials and Large Speculator context.
As regards RSI, 3 extreme points are seen better:
- panic of Small Traders, who sell on lows;
- excitement in the market, Small Traders buy the peak;
- and one more buy at peaks.
As you can see, Small Traders line values could be interpreted as the ‘to do the other way round’ signal.
Let’s remember that there are no guarantees that extreme points on the COT indicator lines ensure making profit. Nobody can avoid risks.
How to combine cluster analysis and the COT Net Positions indicator?
Perhaps, the main disadvantage of COT indicators is that they show data from the past. However, the delay is not that big for the values to lose their significance completely.
We offer you to consider the following variant of usage:
- Step 1. Identification of the signal on a senior time-frame with the help of a COT indicator.
- Step 2. Search for an entry on a junior time-frame with the help of clusters (or other ATAS platform indicators).
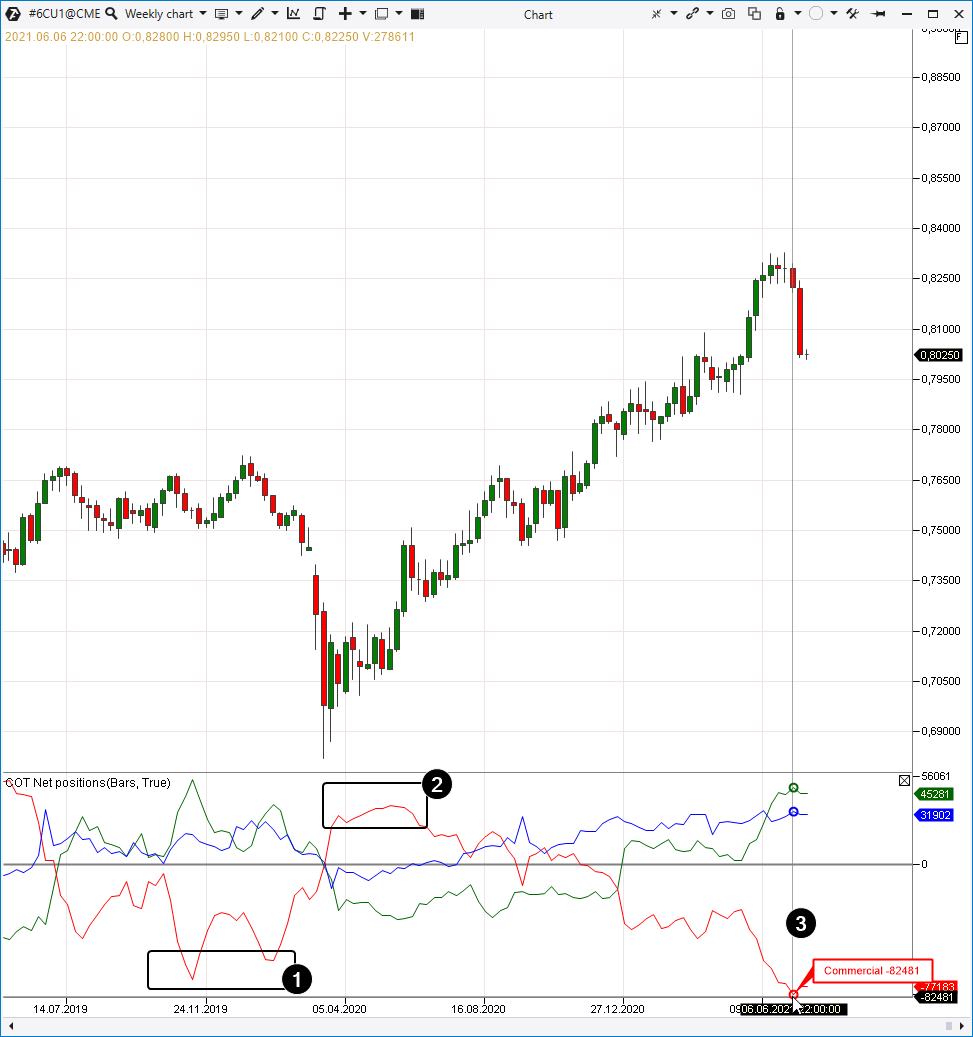
Example: USD/CAD currency pair in the forward market (ticker: 6C; CME).
We clearly see in the weekly chart (the screenshot above) that the Commercials indicator persuasively shows reversal points. Thus, traders of this group:
- accumulated short positions (number 1) long before the fall, which was caused by coronavirus, took place;
- gained understanding in time and accumulated longs (number 2).
That is why, when the Commercials values reached extreme points in May 2021, the reason to look for an entry point into shorts emerged.
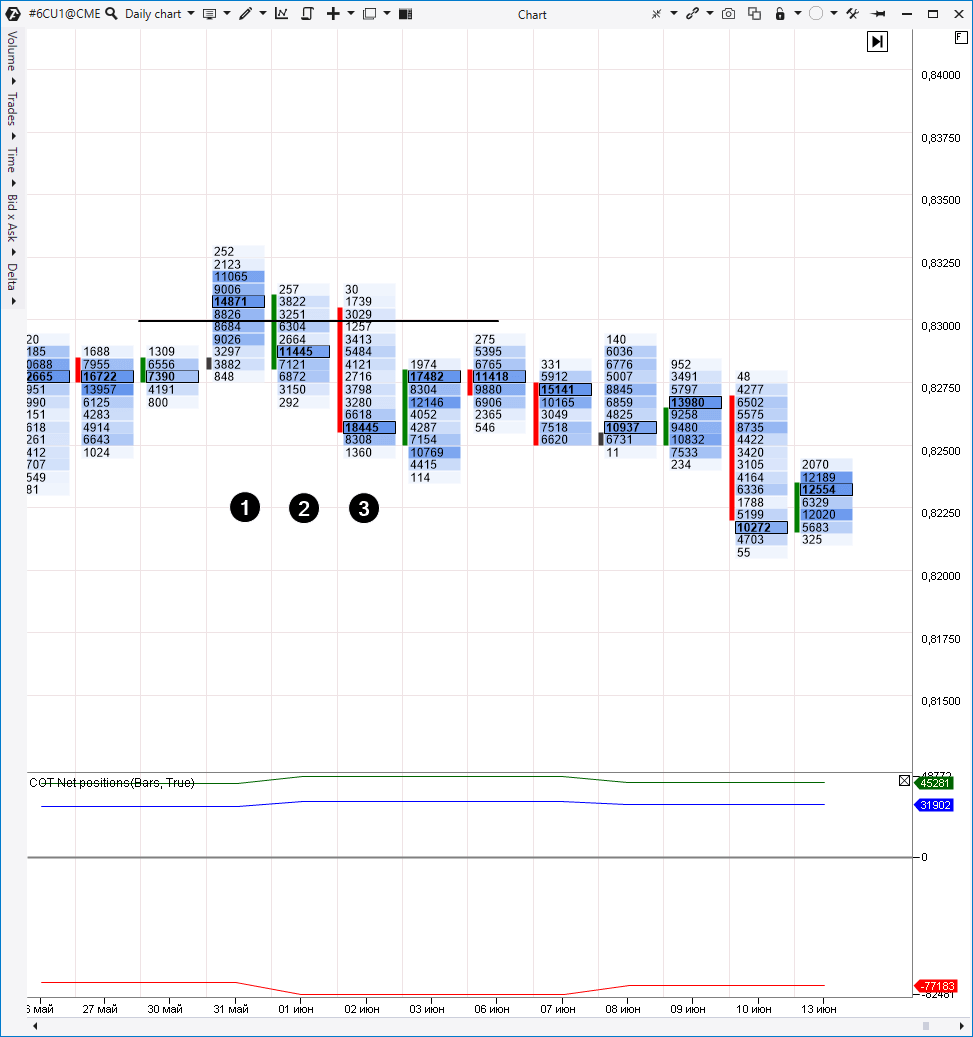
We see an effort to break the round level of 0.83 on May 31 (1). As soon as the quotation exceeded this level, trading activity increased sharply. Perhaps, these were seller stops or maybe breakout buys. However, most probably, they were both. It is also interesting that the day closing took place below the level of 0.83. It is a bearish signal.
There was one more effort to overcome the level of 0.83 the next day (2). However, the weak activity (pale cluster colour testifies to it) could be interpreted as the absence of trader interest in a price increase (which is in line with the Net Positions COT indicator). That is why selling from the level of 0.83 looks justified.
There was one more such possibility on June 2, 2021 (number 3).
Further on, CAD entered the trading range below the level of 0.83 for several days without undertaking efforts of a bullish breakout. The market started to move down on June 10-11, which accelerated on June 16 when a US FRS meeting took place.
However, if you monitored the COT indicator and cluster dynamics, you could have taken an advantageous position many days before.
How to analyze the Open Interest COT indicator?
The Open Interest indicator shows the general number of open positions.
According to a widespread opinion, the following variants of interpreting Open Interest indicator signals are:
Bearish signals:
- Price decreases when indicator values increase (downtrend strengthening).
- Price increases when indicator values decrease (uptrend weakening).
Bullish signals:
- Price increases when indicator values increase (uptrend strengthening).
- Price decreases when indicator values decrease (downtrend weakening).
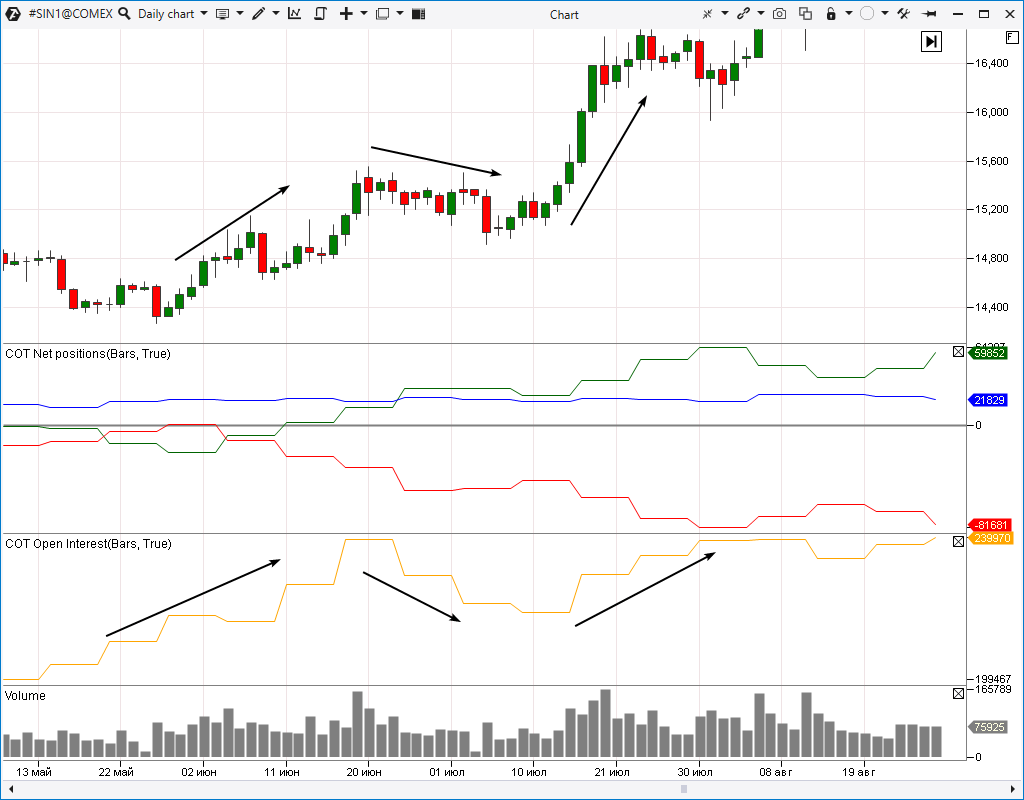
The Open Interest COT indicator shows in the chart below exactly the bullish nature of the silver market in the mid 2019. A number of open positions increase when the price increases. However, Open Interest decreased a bit during the intermediary correction.
It is interesting that the Large Speculators green line moved up since participants of this category, as a rule, support all continuous trends.
By the way, we have individual articles on how to use the Open Interest indicator. This subject is discussed in more detail in:
If you’ve got interested in COT indicators, read one more article from our blog on this subject. It contains ideas for trading COT Index.
Conclusions:
Indicators, which are based on Commitment of Traders reports (COT reports), show positions of various trader groups in dynamics. It is a very useful instrument for middle-term currency, raw material and stock index trading.
ATAS platform helps users to:
- learn facts about positions of various trader groups from a trustworthy source (US CFTC);
- combine COT report data with cluster analysis;
- study historical indicator values;
- get ideas/confirmations for executing trading operations.
Keep in mind that these indicators:
- are published with a delay;
- cannot guarantee profit;
- possess individual nature depending on a selected market;
- contain data only for the markets, which are under CFTC regulation.
Nevertheless, despite the existing shortcomings, we hope that you properly assessed their potential for increasing efficiency of trading in popular markets.
Information in this article cannot be perceived as a call for investing or buying/selling of any asset on the exchange. All situations, discussed in the article, are provided with the purpose of getting acquainted with the functionality and advantages of the ATAS platform.

