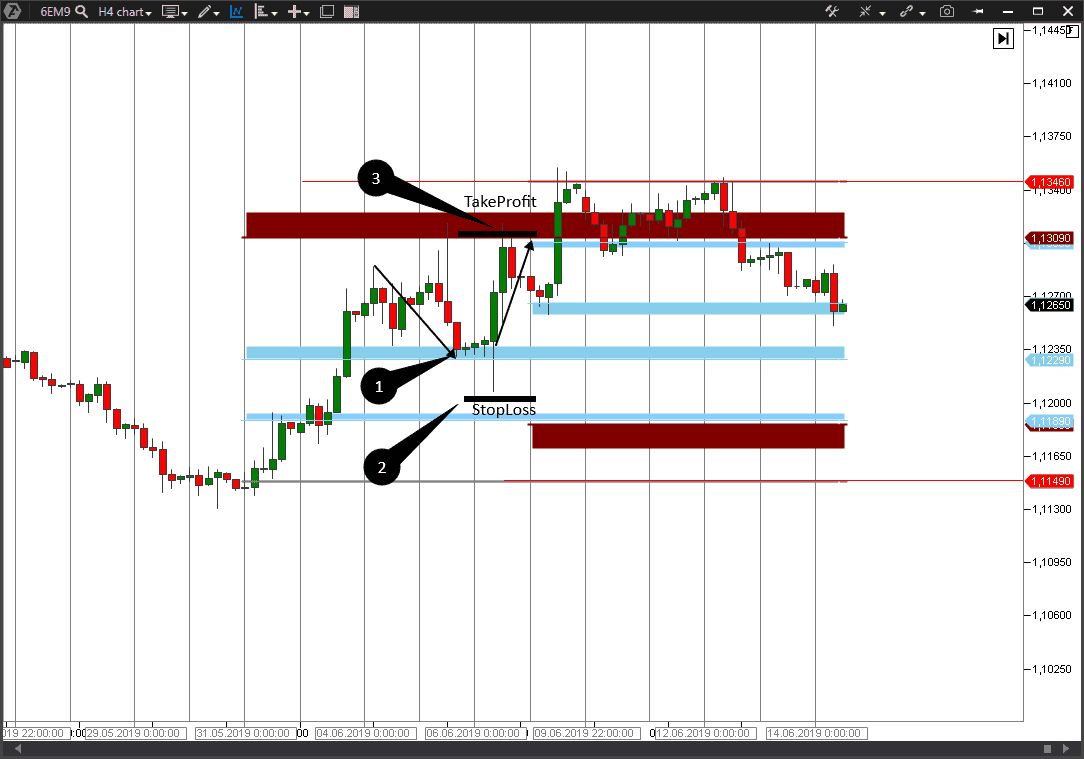
A strategy example with a Market margin indicator.
As of today, the majority of popular market instruments have a margin character. What is margin? In brief, it is a behavioural market pattern, connected with a forced closure of traders’ positions. This article will explain it in more detail.
We will also consider a new ATAS indicator, which is called Margin Zones. The use of the Margin Zones indicator helps to build a trading system, a possible profit in which is three times higher than the possible loss. We will consider examples of building such systems at the end of the article.
Read in this article:
- Market margin.
- Margin risk parameters.
- Setting the Margin Zones indicator in the ATAS platform with examples.
- Calculating margin zones.
- Trading system.
Market margin
Margin is a guarantee collateral (GC), required for execution of an exchange trade. If we speak about the Chicago Mercantile Exchange (CME), the margin requirements are divided into:
– GC, required for intraday trading;
– GC, required for transferring a position through clearing.
The first GC type is set by brokers independently, while the second one is set by the exchange and it is usually bigger than the GC of the first type.
Let’s consider an example of how the margin participates in trading. For example, a trader buys 1 futures contract for corn. According to the Chicago Mercantile Exchange, a trader needs USD 1,000 for executing such a trade. This is exactly the margin, which is taken by the exchange as a trade’s guarantee collateral.
The table below shows a list of available futures contracts at the moment of writing the article. The Maintenance column shows the required margin amount, while the End Period column shows the contracts expiration dates.
The collateral amount is transferred from the trader’s account to the clearing chamber account and is kept there until the trade is closed.
One futures contract for corn contains 5,000 bushels of this agricultural product, which corresponds with 127 tonnes. As of the moment of writing the article, the market cost of corn was USD 4.15 per bushel.
A simple calculation shows that a complete cost of the trade was USD 20,750 with only USD 1,000 spent. The final calculation between the sides of the trade takes place at the moment of the contract execution. Such a trade could be executed long before the commodity is delivered. That is why such trades are called futures (something that will happen in future. Read about what futures contracts are in more detail).
Application of margin trading allows executing futures trades without paying the full amount of the trade’s cost. Such a system is really profitable for real enterprises that are engaged in production and processing of various products.
However, certain restrictions emerge in case of holding margin positions for a long time. The matter is that the market cost of a commodity constantly fluctuates. An open position requires availability of a sufficient collateral amount on the exchange account and the total balance of the portfolio could both decrease and increase.
The variation margin, which is calculated with account of the cost of an open position, is responsible for a change of the total portfolio cost. If the bought position becomes cheaper, the variation margin becomes negative, and if the position becomes more expensive, the margin becomes positive.
If there are no sufficient funds on a trader’s account for holding the open position, the exchange applies the risk management procedure and may close the position. Such an operation is called a Margin Call and could be applied by the exchange or broker forcibly. It is a legitimate action, since the conditions of closing a client’s position without his knowledge are described in the contract, which is executed when a client opens an account with his broker.
If one side of a trade is a producer of some product and the other side is a processor of this product, the closure by a Margin Call is not inherent in them. They execute futures trades, which are secured both with money and commodity in order to fix a profitable price in future or to hedge against possible risks.
The biggest risk of being closed by a Margin Call is that of speculators, who trade in the exchange with the aim to make money on volatility of the exchange instrument and open positions with attraction of 50 or more percent of free money funds. The less free funds on the account are, the higher the risk is.
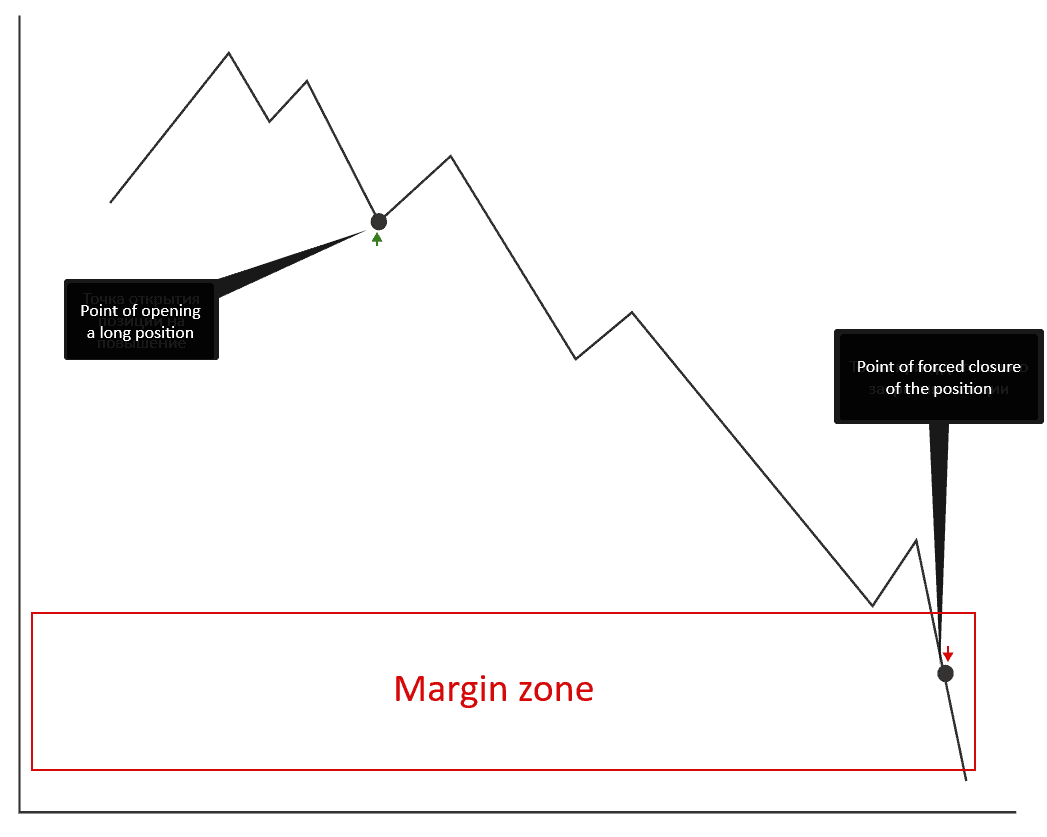
The picture below shows a typical situation, when a trader-speculator opened a long trade against the descending trend and got stuck in a loss. The market continues to fall and the variation margin reduces the trader’s free funds. The exchange or broker will close his position by a Margin Call and register the trader’s loss when the free funds equal to zero. Poor boy.
The margin zone in the picture is marked red. Let’s agree that we would name the levels of closure of a trader’s position by a Margin Call as a margin level or margin zone.
If many long positions were opened at a certain level above, than the falling of the price into the margin zone would provoke a wave of closure of loss-making positions.
Famous bankruptcies, where losses accounted for hundreds of millions of dollars, took place in the result of forced closure of positions on the exchanges:
- John Rasnick lost USD 691 million on the exchange. He was sentenced to 7.5 years in prison and, moreover, the court compelled him to reimburse all the lost money.
- Liu Qibing lost USD 1 billion trading copper on behalf of China. His destiny is still unknown.
- Nick Nilson lost USD 1.3 billion, managing funds of a bank. This resulted in the bankruptcy of the financial establishment, for which he was sentenced to 6.5 years in prison.
A modern trader needs to take into account the margin specific feature of the market, to avoid getting into the bankruptcy list. It is more reasonable to use the opening opportunities at the moment when many other traders are closed by a Margin Call. How? We will speak about it in the article.
2. Margin risk parameters
For a more specific and practical discussion, you should understand where to take information for the calculation of the margin zones from. As a rule, reference data from official exchange sites are used.
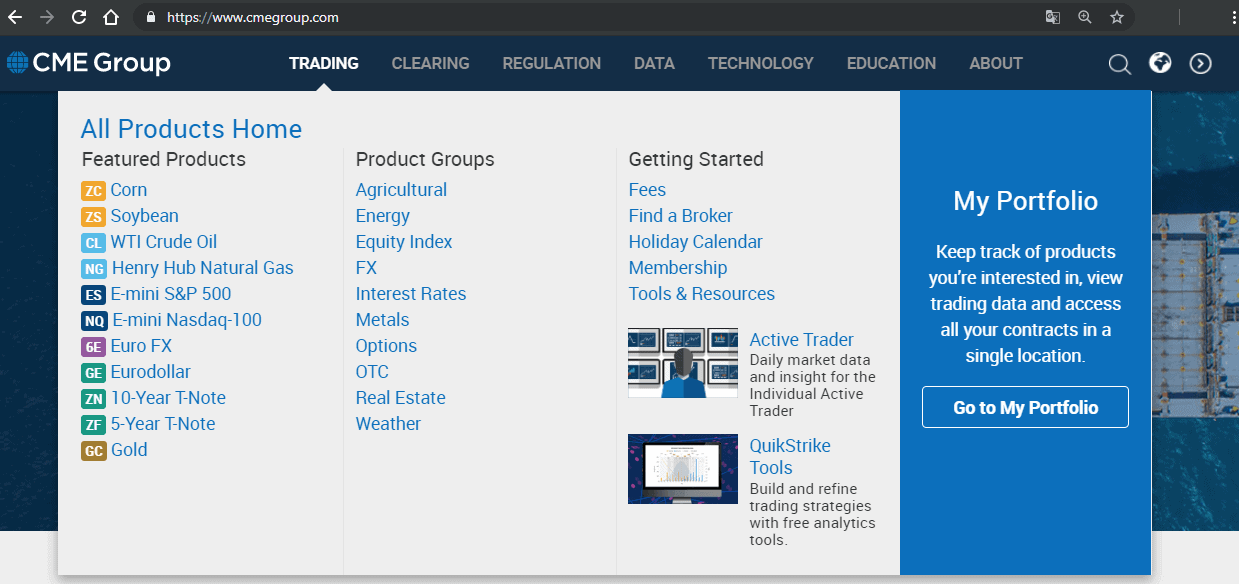
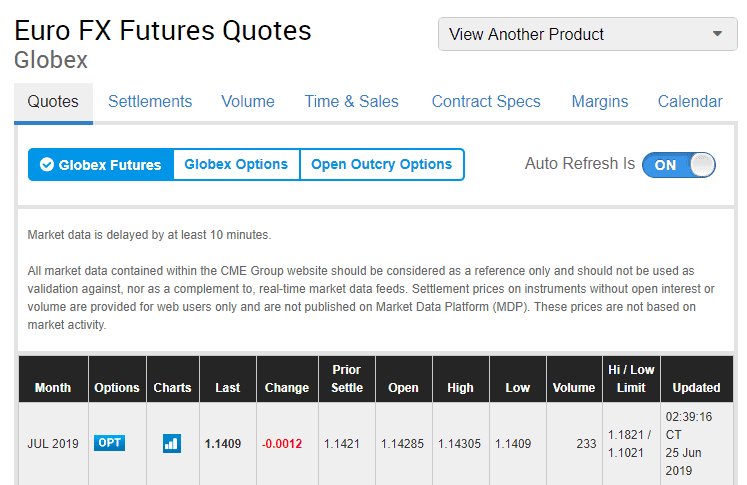
As regards CME, the margin requirements are set for each instrument, which are described in detail on the www.cmegroup.com website. Select the Trading section in the main menu and then select a group of instruments from the list.
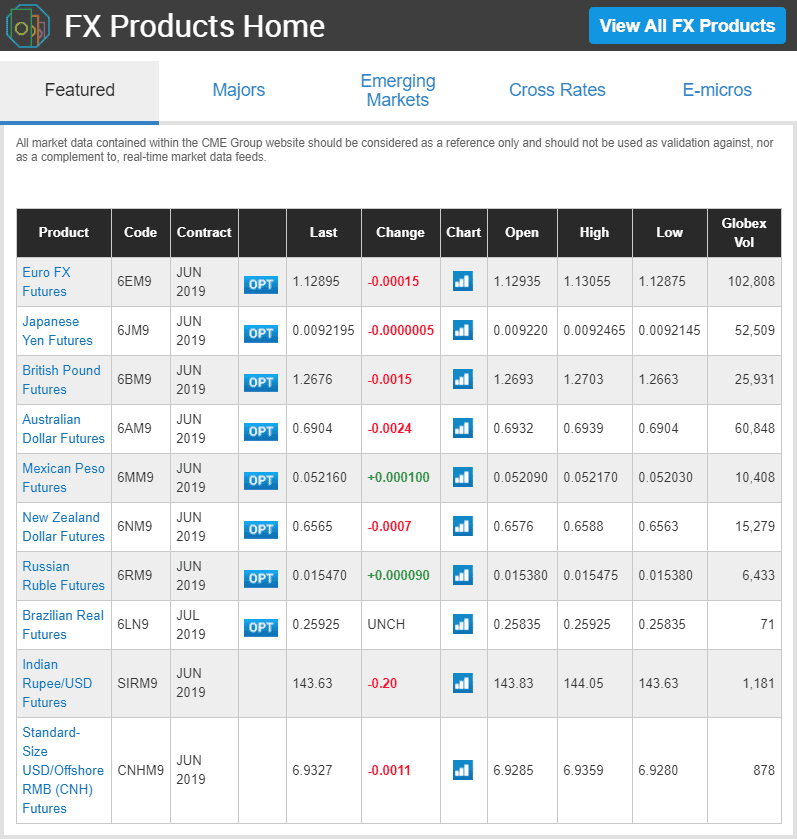
For example, you selected the Forex market (FX value). This will open a table with a list of Forex instruments.
We select the Euro FX Futures and go to the page of statistical parameters, where we are interested in two items: Contract Specs and Margins.
In the Contract Specs section we are interested in the Minimum Price Fluctuation parameter, which sets a minimum increment of the price and its cost:
This information helps us to understand that the cost of one tick of the 6E instrument is USD 6.25.
Then we go to the Margins section where we find information about a minimum guarantee collateral (GC) for one contract of the 6E instrument. In our case, GC is USD 2,000 for one contract for positions that are transferred overnight.
Now we have all the necessary information for calculation of margin zones, which we can transfer into the Margin Zones indicator.
3. Setting the Margin Zones indicator
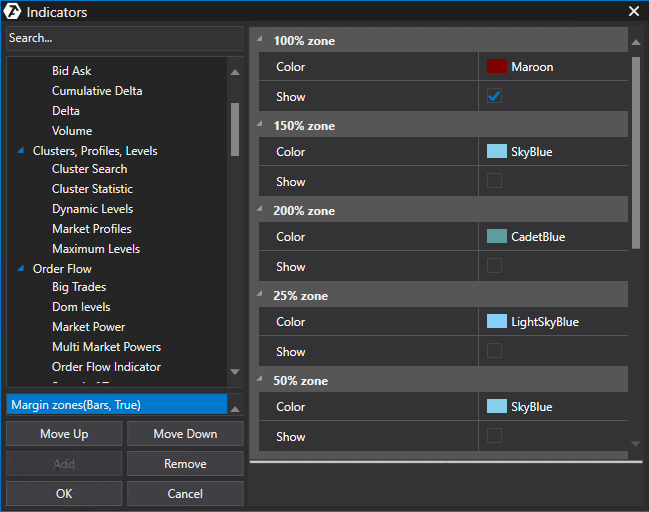
In order to use margin zones in our trading, we will need to use the Margin Zones indicator of the ATAS platform. In order to add it to the chart, go to the Indicators section and press the Add button.
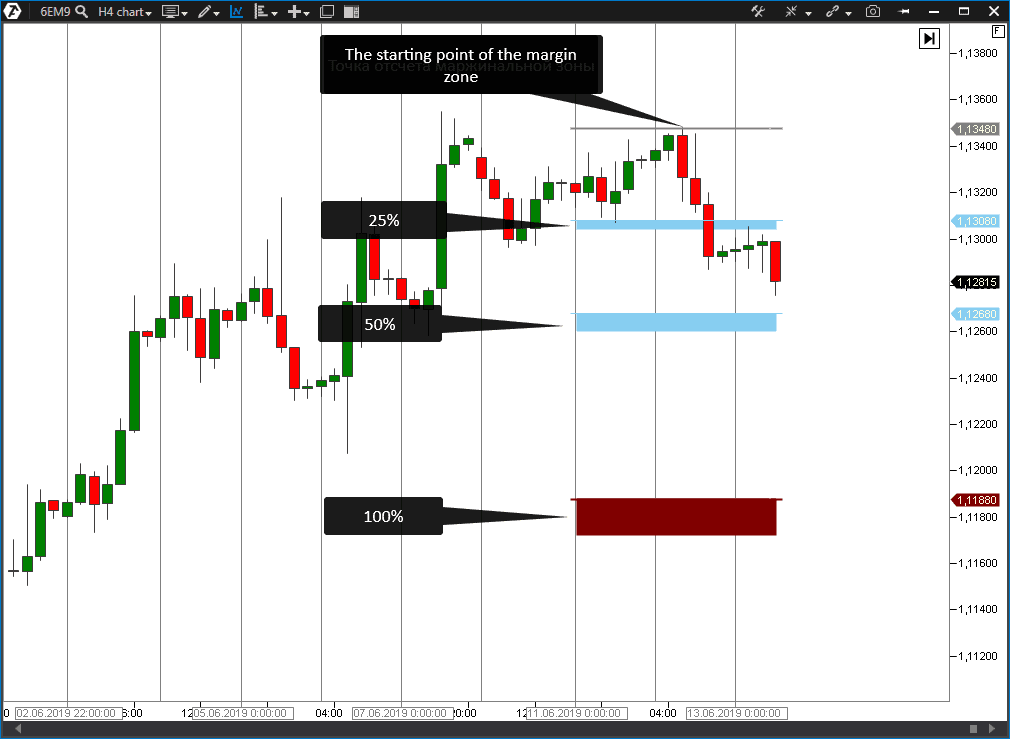
The indicator is shown in the chart in the form of horizontal coloured bands, which correspond with different margin zones. By default, the first one corresponds with 25% of the whole margin zone, the second one – with 50% and the third one – with 100%. Availability of the intermediate margin zones is justified by the fact that some brokers provide their clients with leverages, which shortens the distance to the margin zone.
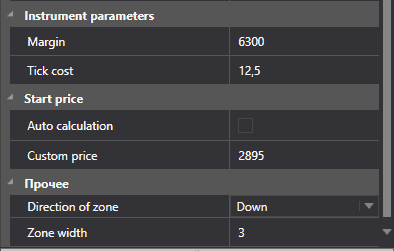
We need to set the instrument parameters in order for the indicator to correctly show margin zones. To do that it is necessary to set the Margin size and Tick cost. We already explained you above where to take these data from.
The starting calculation point corresponds with extreme points of the current week with the set Auto calculation parameter. You should use the manual mode to set the Custom price value, from which the margin zones will be built.
The Direction of zone parameter is responsible for direction of the zone indication – up or down from the starting point. The Zone width parameter sets the number of days, during which the zones will be displayed in the chart.
4. Calculation of margin zones from High or Low or from volume concentration.
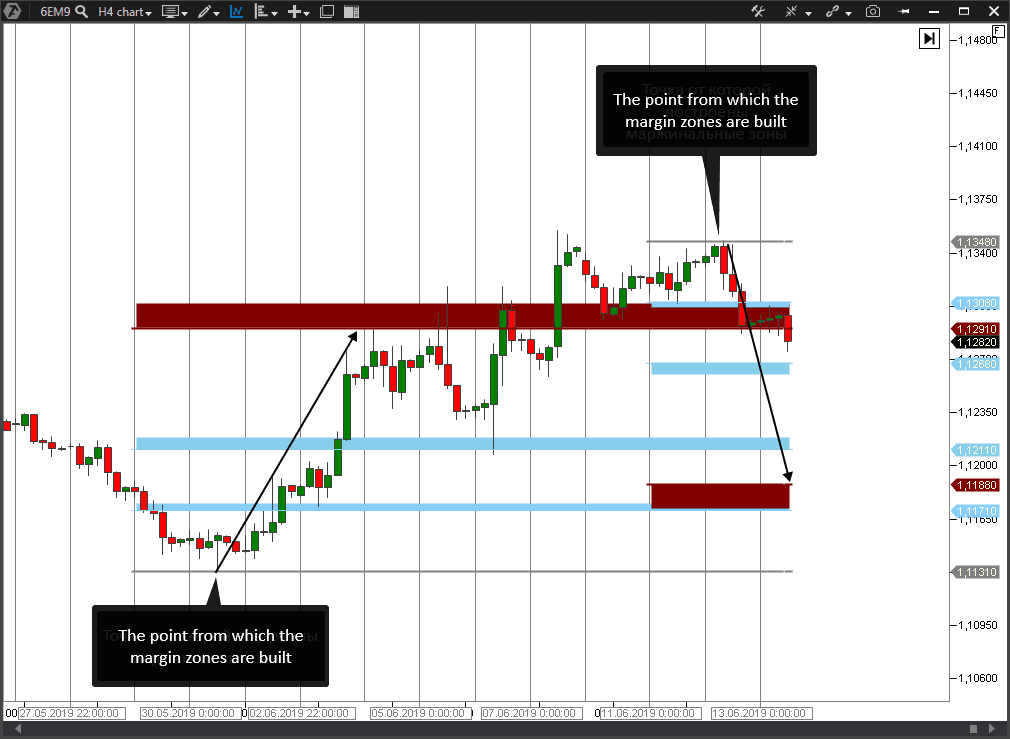
The picture below shows how the chart with 2 indicators that have different directions – up and down – looks like.
- In the first case, the margin zone calculation is built from the week’s high and is directed downward.
- In the second case, it is built from the previous week’s low and is directed upwards.
It is one of the most widespread methods of building margin zones.
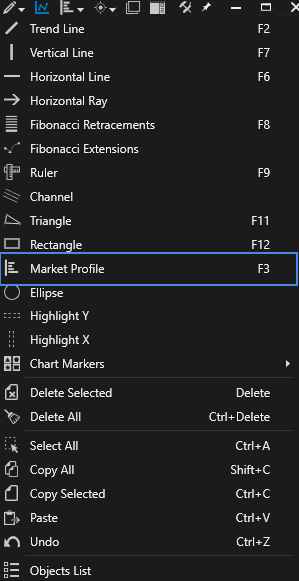
Another method of building margin zones is assignment of the starting point to the levels of major horizontal volumes, which reflect activity (interest) of the market participants. In order to identify horizontal concentrations of volumes, you will need to add the Market Profile drawing tool to the chart (just press F3 to activate it).
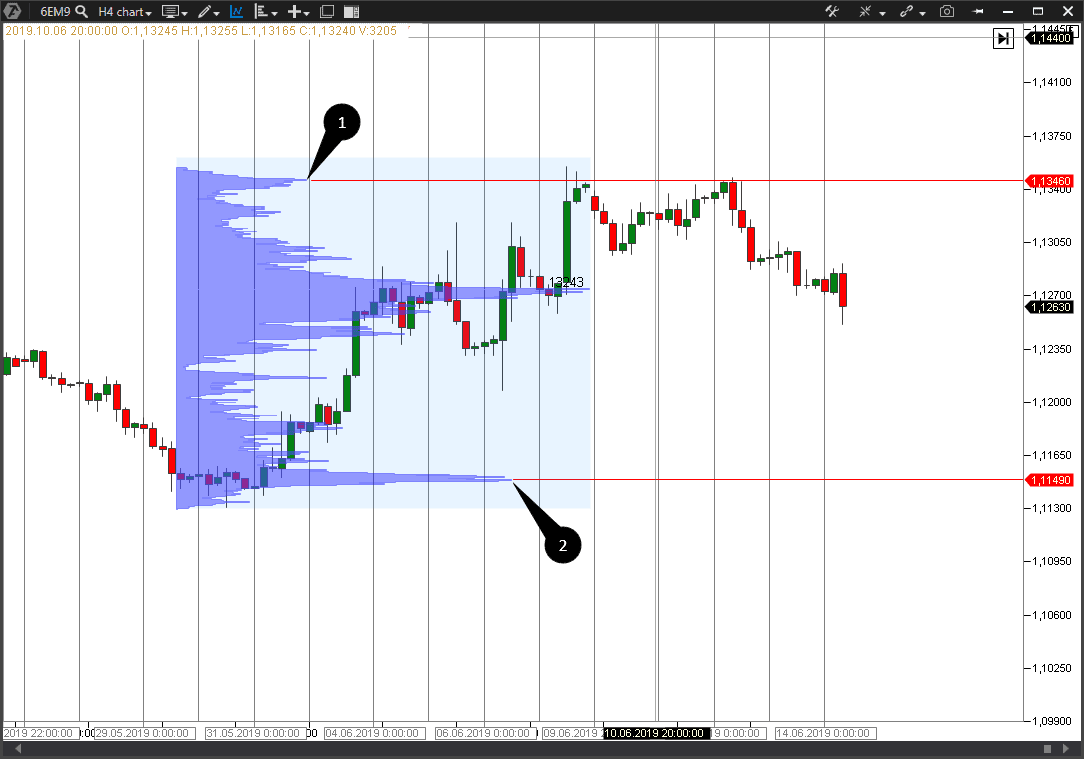
Stretch the Market Profile to the part of the chart, where you noticed an ascending trend of interest. Now we see volume concentrations along the whole period of increasing prices.
We can see an obvious splash of the volume near price highs in point 1. We note that the basic volume concentration is at the level of 1.13460 and transfer this value into the Margin Zone indicator, which has the downward direction.
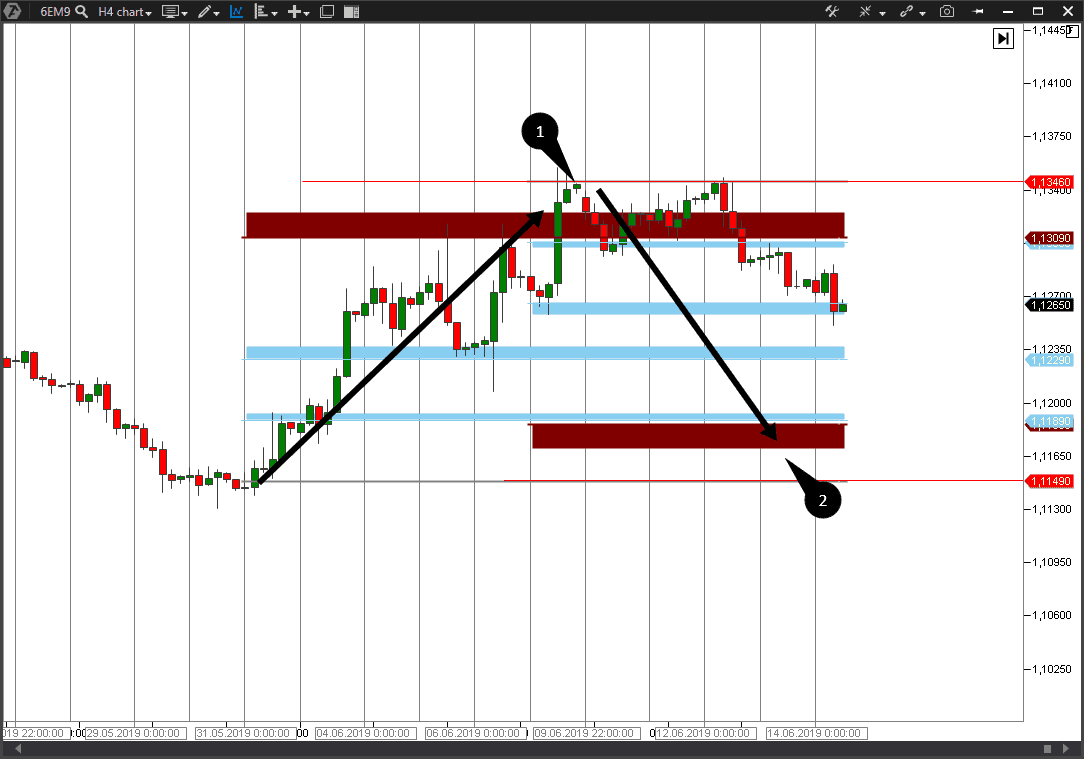
The lower point 2 is at the level of 1.11490, where we also have a volume concentration. We transfer this point into the second Margin Zone indicator, which has the upward direction. Now our chart will look like this:
The price broke the margin zone in point 1 and, as we can see, the trading session was closed above the broken area. Positions of sellers, who got stuck from the level of 1.11490 in point 1 with the absence of free liquidity, were forcibly closed. The ascending impulse got exhausted after that and the downward movement started.
A similar unpleasant situation might also expect buyers, who opened their positions from the level of 1.13460, if the price would reach the lower boundary of the margin zone in point 2.
How to build margin zones more accurately?
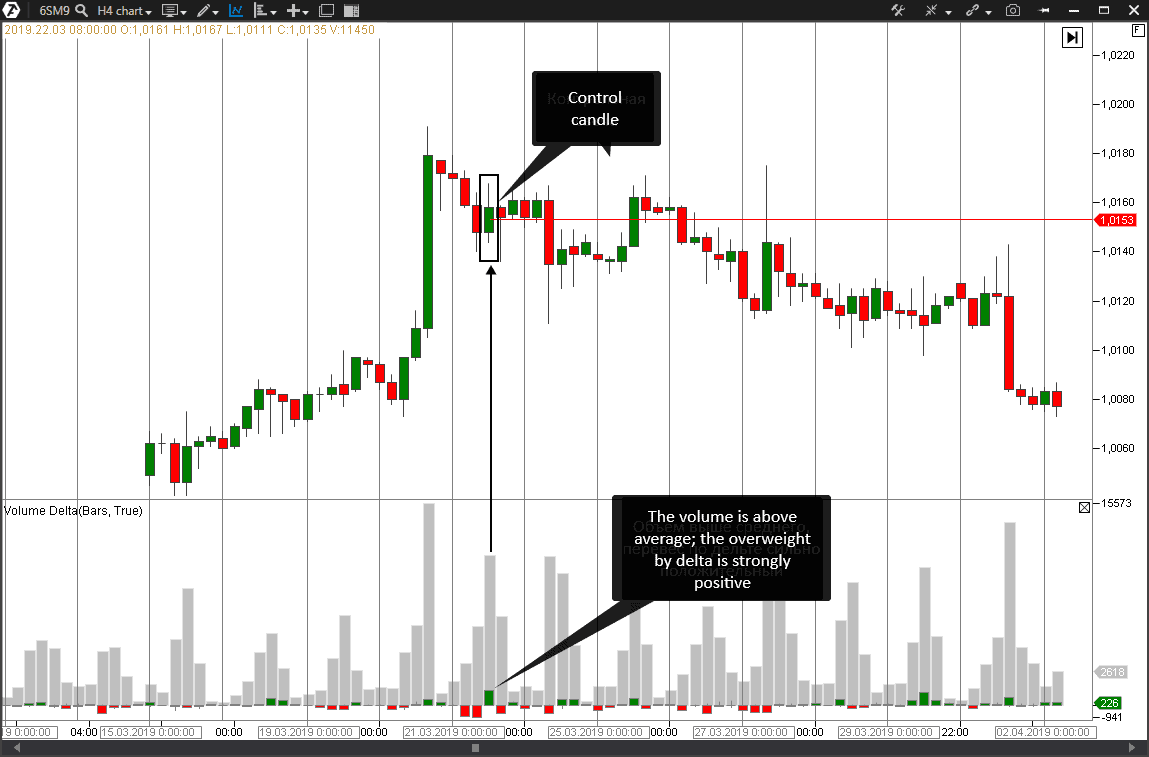
For this we would need two more indicators in the chart: Volume and Delta. It is preferable (for better convenience and less space) to combine these two indicators in one panel as it is shown in the picture below.
We find a candle with the above average volume and maximum overweight in delta on the ascending movement for the 6S instrument (CHF futures). We mark this candle as a control candle.
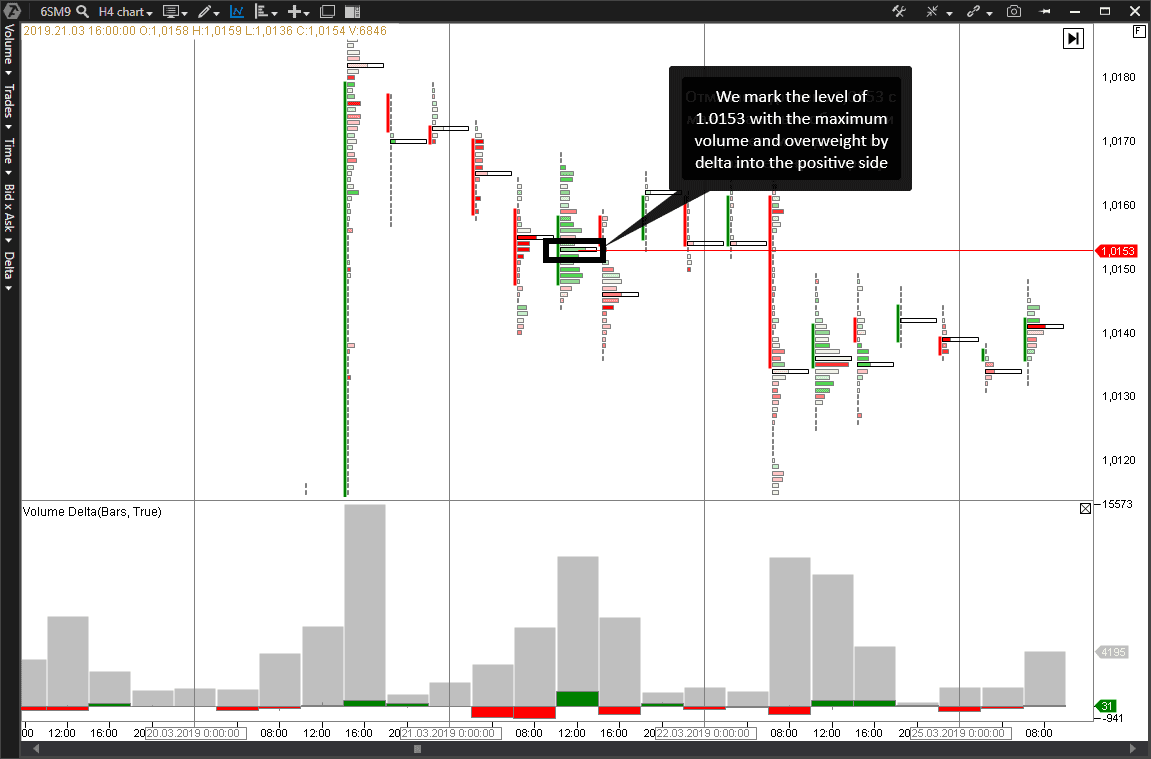
Then we transform the chart into the cluster mode in order to identify the maximum volume concentration level in the control candle more accurately and find the level, from which we would build the Margin Zones indicator. This level now is 1.0153.
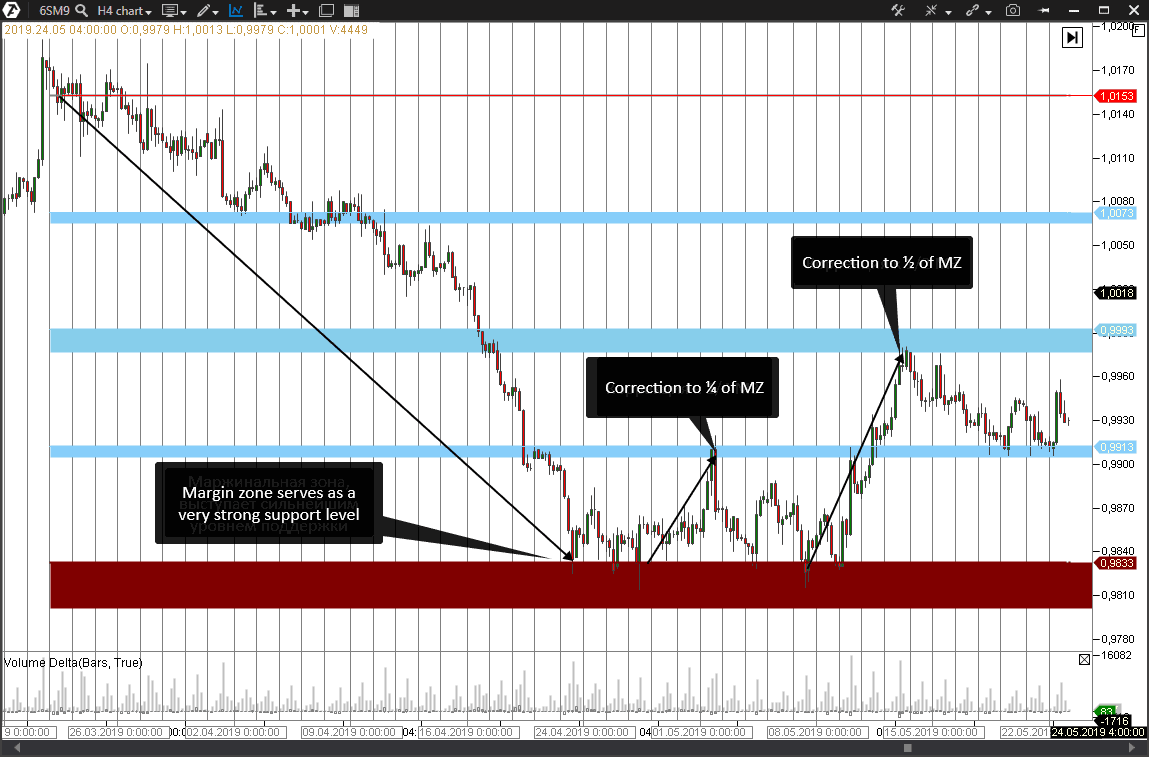
We transfer the received value into the Margin Zones indicator and check the chart. The received margin zone in the bottom of the chart served as a very strong support level, from which the correction was developed to ¼ and ½ of the margin zones (MZ).
Trading system on the basis of margin zones
Unload of margin positions, which got stuck in losses, releases big volumes, the balance of demand and supply changes and major players enter near margin zones. All these interconnected events often result in a market reversal and origination of a new trend.
Taking into account the market margin, we can build a trading system on the basis of breakout/bounce from margin levels.
By way of example, let’s assume that the breakout of margin levels results in redistribution of profits and losses among the market participants. When a portion of open positions is closed forcibly, interest in supporting the trend goes down. Let’s try to transfer this into some trading system.
First, let’s assume that the price could experience strong support or resistance in margin zones. As a rule, the market is corrected in such situations. The correction may develop to the extent of ½ or ¼ of the zone.
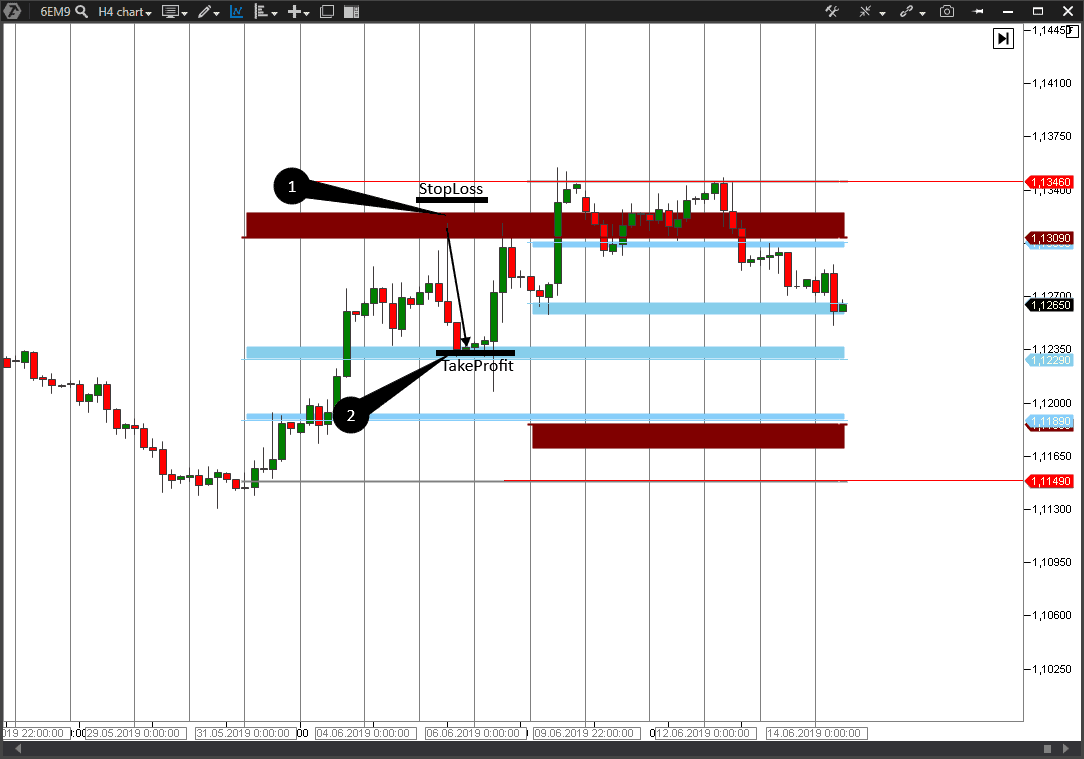
Such a situation looks as follows in the chart:
Touching the upper margin level, from which selling should be opened, takes place in point 1. Take profit is posted at ½ of the margin zone in point 2.
It is important to understand where to post a stop loss when you form your trading system. In this case it is expedient to use the value of ⅓ of the supposed take profit. In our case the full zone is 320 ticks, ½ of the zone is 160 ticks and ⅓ of 160 is 53 ticks. Thus, we post the stop loss 53 ticks above the point of opening the position. The profit in this trade is 160 points, while the possible loss is 53 points.
Let’s consider another example with the breakout of ½ of the margin zone.
Some brokers provide their clients with leverages, when using which the risk of occurrence of a Margin Call is reduced in proportion to the leverage size. For example, ½ of the leverage would correspond to ½ of the margin zone. Moreover, the broker may close a part of the client’s loss-making position in the event when the variation margin is equal to a half of the initial cost of the trade with the opposite sign. It means a situation when free funds on the trader’s account cover only 50% of the required GC.
The below example shows a situation when the price settled above the broken level after the breakout of ½ of the margin zone.
In this case we wait for continuation of the ascending movement to the next margin level. We post a limit buy order at the broken level (point 1) and calculate the stop loss using the above described method (point 2). We get the expected profit of 163 points and stop loss of 53 points from the entry point.
When testing the broken level, the price dangerously moved down to the level of our stop loss, however, it lacked 10 ticks to activate it. As a result, we get the profit in the amount of 163 points (point 3).
Conclusion
A trader needs a clear trading system and proper risk management if he wants to make profit from trading. Trading by margin zones allows looking for profitable and rational points of opening and closing positions with establishment of an acceptable risk.
Let’s briefly designate principles, which could be used in the strategy of trading by margin zones:
- margin zones, as a rule, could be support and resistance levels;
- levels of horizontal volumes allow more accurate calculation of margin zones;
- breakout of one margin zone and price fixing at the end of the American session point at a high probability of continuation of movement towards the breakout to the next margin zone;
- a trading system with the use of margin zones assumes the 3 to 1 relation of profit to loss.
Download ATAS and experiment with the Margin Zones indicator right now. We wish you not to meet a Margin Call in your way.

