
OPEN DRIVE. Learning how to trade at the opening

What is Open Drive? This term means a type of the trading session opening, which results in a trend day. In this article, we will analyze different types of the trading session opening. Read in this article:
- What are the pros and cons of trading on the exchange opening?
- Types of the trading session opening.
- Trading strategies.
- Chart examples.
OPEN DRIVE. IS IT PROFITABLE OR NOT?
There is no one single opinion among traders with respect to whether it is profitable to trade on the trading session opening or not. We will not give you a magic recommendation but will tell you what types of openings exist and what trading strategies are used by traders.
As a rule, the first hour of a trading session is the most active time. Of course, there are exceptions. For example, activity also increases after publication of important news or on closing a trading session. The biggest volumes on the Moscow Exchange take place during morning hours and during opening the American trading session. It happens because some futures contracts (for example, oil, gold, EUR/USD currency pair, etc.) on the Moscow Exchange closely follow the similar futures in the American and European platforms.
Some traders believe that it is very difficult to control risks on the trading session opening, because volatility increases.
Other traders believe that it is very profitable to trade on the opening – you just need to have certain skills and a clear plan. If traders take into account different types of the trading session opening, they could plan their time and focus on trading when the exchange opens.
Open Drive. Is it profitable or not?
The trading session opening is the first trading hour from the point of view of the Market Profile. In other words, this is the time when the Initial Balance is formed.
The trading session opening could look as follows:
- Open Drive (OD) – the price opens above or below the previous day’s value area and moves in a focused manner during the trading session without significant rollbacks. Trend days develop after such openings. As soon as a trader identified Open Drive, he should stay with the market rather than try to trade against it. According to statistics, there are less than 10% of trend days in the market and patient traders receive a bigger profit.
- Open Rejection Reverse (ORR) – the price opens above or below the previous day’s value area but falls back. These are non-trend days but it is less risky to trade since the range usually expands in one direction;
- Open Test Drive (OTD) is very similar to Open Drive. The price initially moves in a focused manner then sharply reverses and moves in the opposite direction.
- Open Auction In Range (OAIR) – the price opens inside the previous day’s value area and is traded in the range around the opening. It doesn’t move outside the previous day’s value area.
- Open Auction Outside Range (OAOR) – the price opens outside the previous day’s value area and is traded within the range around the opening. In other words, the price stays above or below the previous day’s value area during the whole trading session.
However, the trading session opening types could be out of touch with the Market Profile and not linked with the first trading hour.
For example, Toby Crabel considered a shorter period of time – around 30 minutes. He wrote the “Day Trading with Short Term Price Patterns and Opening Range Breakout” book in 1990. He tested various patterns on various instruments in it.
Trading became more global and competitive during 30 years after the book publication, that is why Crabel patterns should be applied carefully in the modern futures markets. Nevertheless, some rational observations of the author with respect to the opening could be used even today.
TWO TYPES OF THE TRADING SESSION OPENING ACCORDING TO CRABEL
- Early Entry 1 – the first 5-minute bar closes on the opposite to the opening side. In other words, if the bar opens on the price low, it should close on the high. The next several bars expand the initial range. Then the price consolidates and continues the focused movement. Such an opening resembles Open Drive very much. The price shouldn’t reverse sharply and move against the first bar on high volumes and wide range (range in this case is the bar height).
Early Entry 2 – its description coincides with EE1 but the volume of the first bar is significantly bigger than the volume of the similar bar during the previous 15-20 days. The price cannot expand the range immediately after such a volume since there should be a period of consolidation. New traders, who move the price further, emerge after that. Such an opening leads to a trend day.
Let’s consider an Early Entry 2 example in the 5-minute USD/RUB futures chart. The chart contains the following indicators: Delta, Open Interest and VWAP.
- Delta shows the difference between the market buy orders and market sell orders. Positive Delta appears if there are more aggressive buys than sells. Negative Delta appears when there are more market sells than market buys.
If Open Interest (OI) grows, it means that traders open new contracts and enter the market. If OI falls, it means that traders close old contracts and exit from the market. Only the Moscow Exchange shows Open Interest in the course of the trading session. See Picture 1.
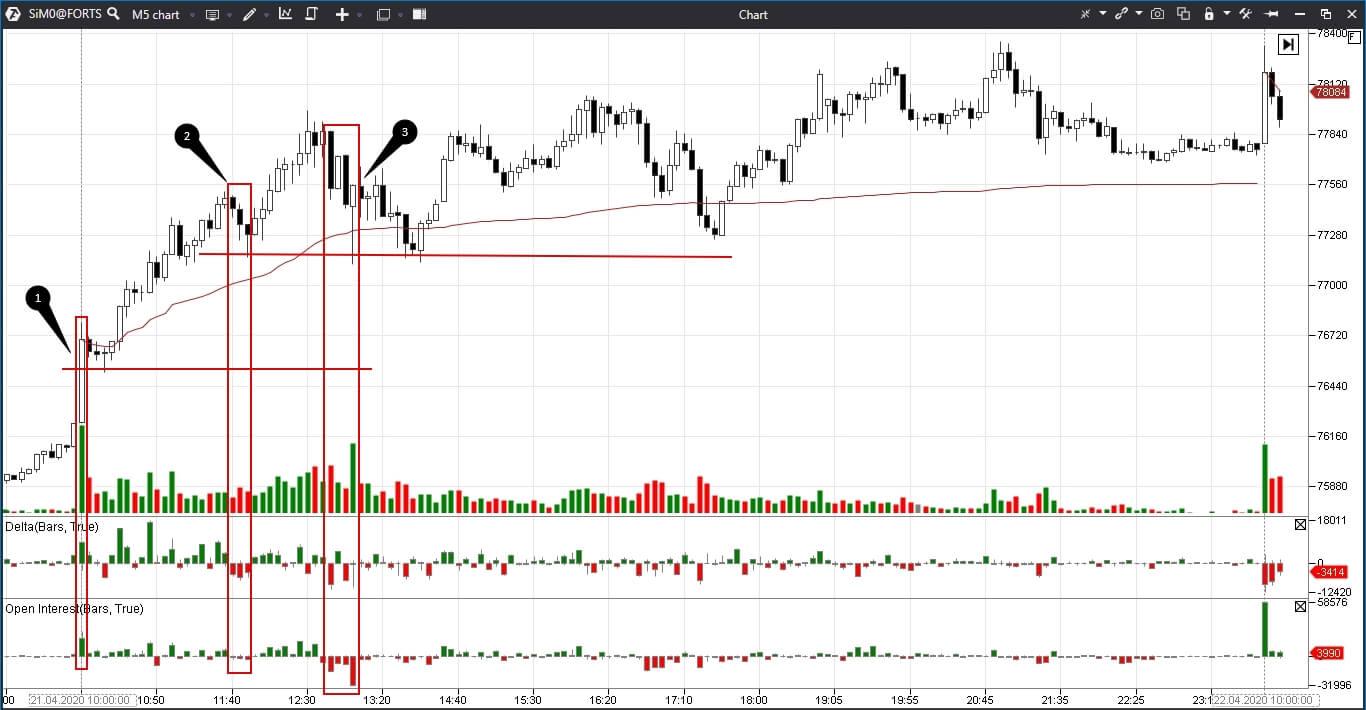
Volume of the first bar is significantly bigger than volumes of the first bars for the previous 10 days. The bar closing is nearly at the high and opening – at the low. According to Crabel, this trading strategy is closer to EE2, that is why consolidation should be expected after a huge volume. It takes place on the next three bars. Volumes fall and the price doesn’t move below the middle of the first bar. The growth continues after the consolidation.
A slight rollback takes place in point 2. Open Interest practically doesn’t change, which means that there are no new contracts here.
A new rollback takes place in point 3 and it is much stronger. However, the price fails to move below the low of the first rollback. Open Interest falls, which means that, most probably, traders with long positions register profit.
That day was very much like a trend day. That day could have brought a significant profit to the trader if he would have bought after the consolidation at the level of the first bar’s high and increased his positions on rollbacks.
EARLY ENTRY FAILURE
Another trading situation emerges if the price reverses at the 2-3 bar and the volumes increase. Crabel called such actions as the Early Entry failure. Quite often, at such moments, traders may open an opposite impulse trade. As a rule, impulse trades are quick. Traders need to be very attentive since the price could move sharply against them.
Let’s consider an example in the 5-minute PAO Sberbank stock futures chart. See Picture 2.
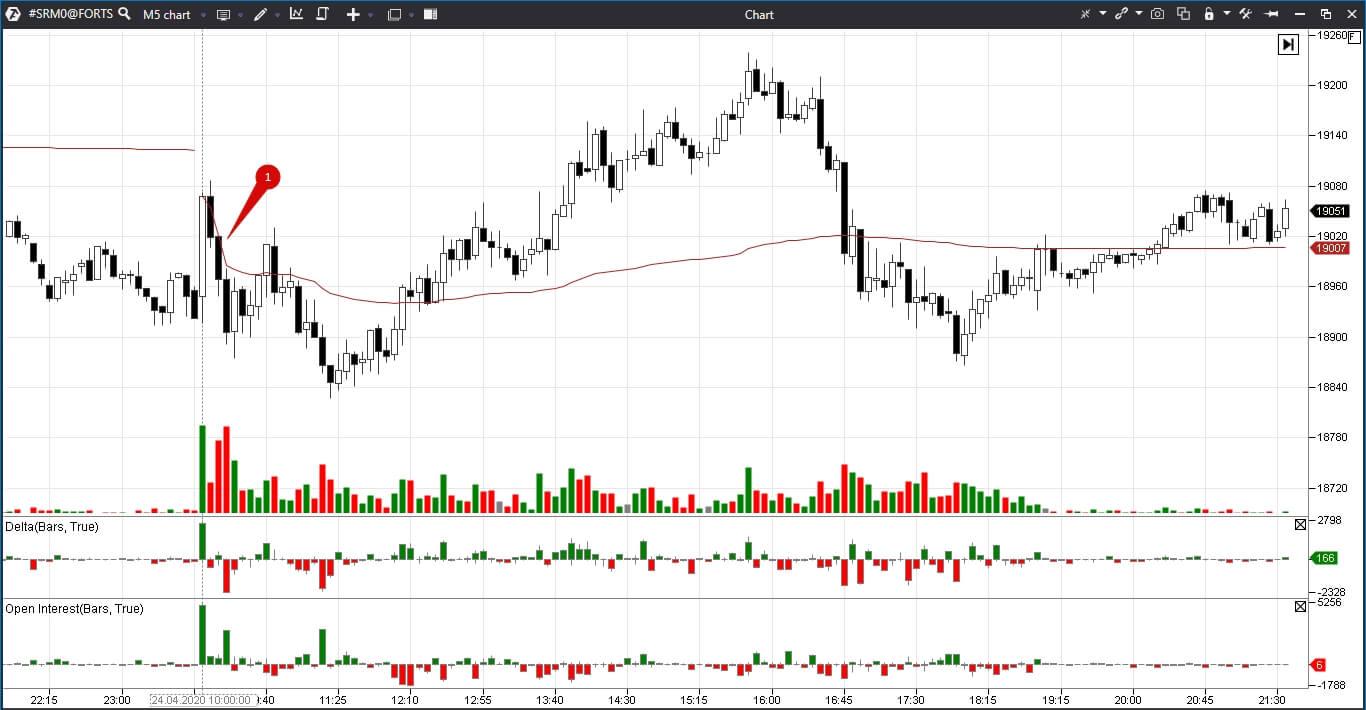
The first candle is white and the closing and opening are at the opposite sides – this should attract the attention of those traders who hope for a trend day. However, the next candle doesn’t expand the range but reverses. Volume of the second candle is significantly less than of the first one – could it be just an insignificant retracement? However, the third candle shows that the sellers took control over the situation.
Aggressive traders could open short positions but it is risky. Reading the Tape would add confidence. The Tape is filtered out in our chart and shows only those trades, which have more than 100 contracts. Smart Tape in ATAS could be used not only online but also in the historic mode, which means that there is a possibility to analyze historical data. See Picture 3.
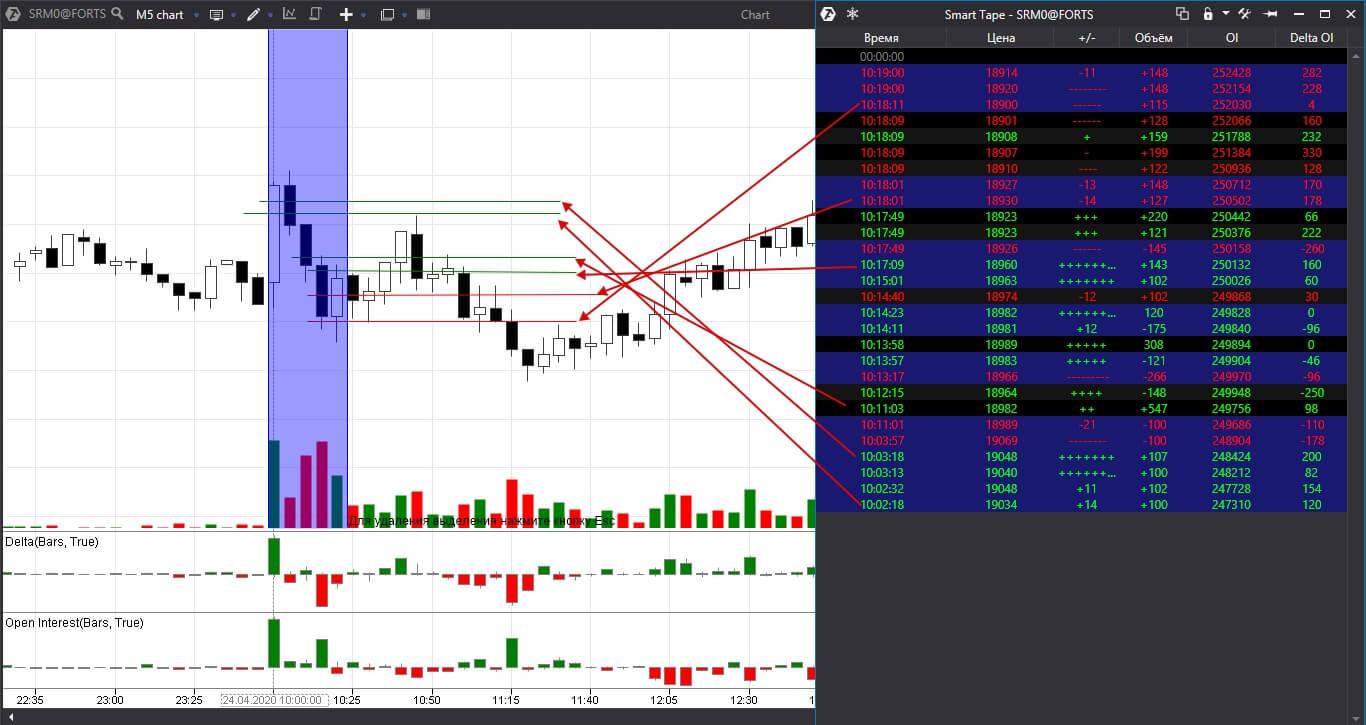
We marked price levels, at which buys and sells took place, in the chart. Green levels are buys and red levels are sells. We matched every level with a trade or trades in the Smart Tape with red arrows.
Buyers are active during the first seconds after opening but the trades take place rather high with respect to the bar’s low. The price moves upward reluctantly.
The next filtered out trades take place at the lower price than the first trade. Open Interest grows, which means that these are new buys rather than the closing of old contracts.
Then a major buy of 547 lots takes place but only 49 out of them are new contracts (we divide Open Interest in two because one half of it is sell contracts and the other half is buy contracts). However, this buy also doesn’t move the price up.
At 10:17, buyers enter into trades even lower – near the first bar opening. Thus, we see that the price doesn’t grow although there are aggressive buyers. Perhaps, the limit sellers, who met aggressive buys, had other intentions.
Aggressive sellers appear at 10:18 and they manage to move the price from 18930 down to 18900. 18900 is a new local low of the day immediately after the first bar’s low. It is obvious that sellers meet limit buyers here who do not want the price to move further down. Most probably, many traders considered this level as the support level.
Smart Tape helps to understand what takes place at every price level. It becomes more quiet and simple to trade.
UPTHRUSTS ON THE TRADE OPENING
Crabel writes that if the price opens outside the previous day’s value area on the first bar and closes inside, most probably, it would be traded within the previous day’s value area after that. This trading situation resembles Upthrust very much.
Let’s consider an example in the 5-minute PAO Sberbank stock futures chart. See Picture 4.
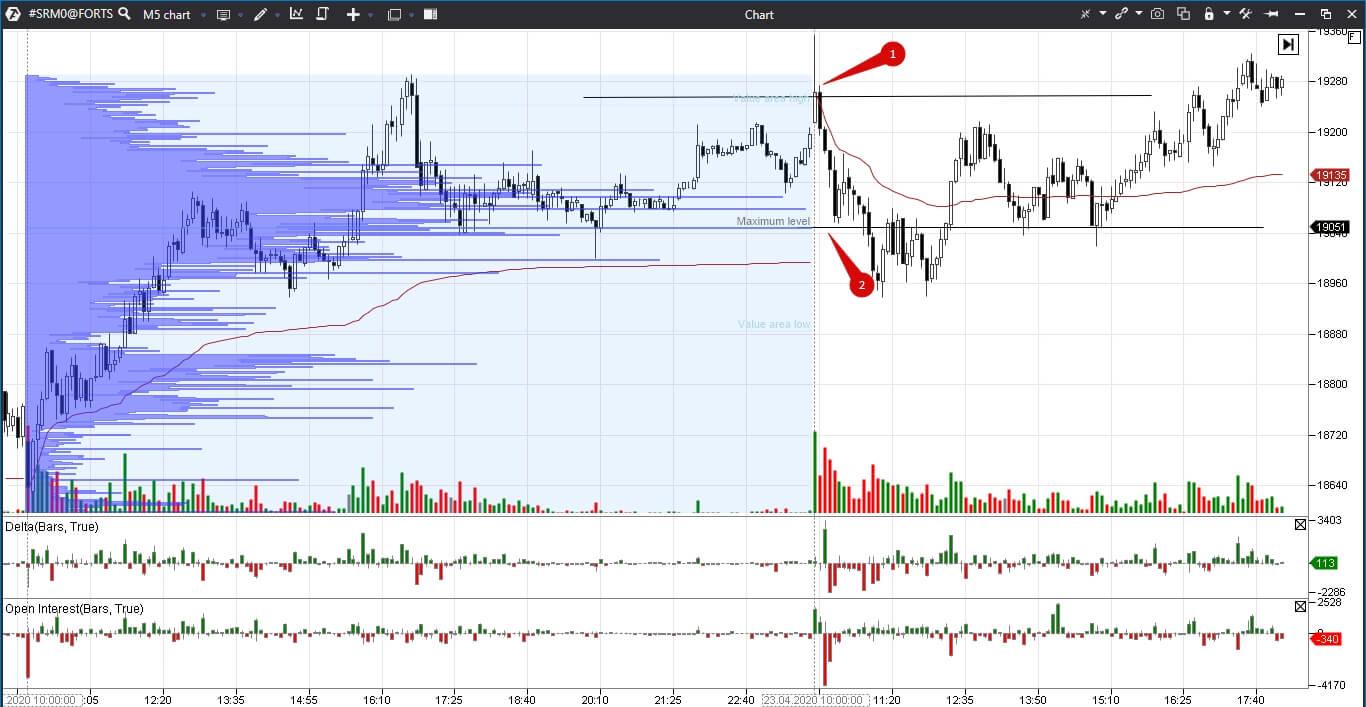
In order to see the previous day’s profile we used the Market Profile drawing object from the upper menu. We marked the Value Area High (VAH) and maximum volume level with black lines and numbers 1 and 2 respectively.
The price broke away from the previous value area on the next day’s opening but it returned back and continued to move down. The second bar completely overlapped the first bar’s body and closed below its low. Traders could open short trades with a stop, posted some ticks above VAH.
SUMMARY
- You need a clear plan and knowledge of average trading volumes in the instrument for the previous month for profitable trading on the opening.
- You need to identify key levels, from which it would be possible to open trades, before the opening.
- It is difficult and risky to monitor several instruments simultaneously on the opening since the price moves very fast at that time.
The accumulated (with eagerness and discipline) experience plus modern software would allow improving trading results and, perhaps, trading on the opening would become namely your competitive advantage.

