Bollinger Bands technical analysis indicator
We start a series of articles about technical indicators. In this article, we will tell you about Bollinger Bands. They are better known as the Bollinger Bands indicator or just BBands.
About the indicator developer
John Bollinger worked as a financial analyst and technical analysis specialist. He was the chief market analyst in the Financial News Network and, when it was closed, started to work in CNBC.
Investors and traders know John as a developer of a technical analysis indicator known as ‘Bollinger bands’. This (already classical) instrument is included in practically all packages of trading and analytical software.
The ‘Bollinger on Bollinger Bands’ book was published in 2001. You can find a lot of useful information on the official web-site, dedicated to the indicator.
Story of a trader John Bollinger
Bollinger started his trader’s career in 1970. Initially, he acted as a fundamental investor but was disappointed with the results. Then John decided to combine fundamental and technical analysis.
At the first stage, John selected companies by their fundamental characteristics. At the second stage, he used the technical analysis to decide whether he would buy their securities. John bought one of the first mini-computers to increase efficiency of his work.
The story of indicator development
Application of trading bands in technical analysis has a long history. Trading bands are lines (or strips), which are built higher or lower than some central axis. Usually, a moving average serves as a central axis.
Bands were not always symmetrical. Trading bands were mentioned for the first time in 1960 when the Twin-Line Chart of Wilfrid LeDoux was patented. The main problem of twin lines was identification of a distance between the central tendency and trading bands. Some analysts identified band boundaries by highs and lows of the prices at a certain period of time. Others used the parallel shift of the upper and lower bands for a certain number of percent from the central line. They had to draw these lines manually or constantly adapt to the current market state.
Bollinger believed that the band width should be identified by the market volatility. He identified experimentally after computer modelling that the use of a standard deviation for measuring the band width shows decent results. Then he decided that a standard deviation should change together with the average price change. His bands show relative highs and lows of the price.
Bollinger worked as an investment analyst at that time. One day he was invited to a TV show where he showed charts with his bands, which still had no name. The TV host Bill Griffeth asked him how these bands in the chart are called and Bollinger answered immediately that these were Bollinger Bands.
How to set the Bollinger indicator
The standard Bollinger Bands settings are 20 periods for the moving average and 2 standard deviations from the average. Such settings approximately correspond with the number of trading days in a month. It is necessary to change the deviation size if the moving average length changes. Bollinger offers to change parameters as follows:
| Periods | Multiplier |
| 10 | 1.9 |
| 20 | 2.0 |
| 50 | 2.1 |
How to use Bollinger Bands in trading
Since BBands is a technical analysis indicator, the bands could be used for finding reversal points or chart patterns.
Let’s consider 4 patterns:
- Double-top (“M”) reversal pattern.
- Double-bottom (“W”) reversal pattern.
- Trend strength confirmation pattern.
- The squeeze.
Double-top (“M”) reversal pattern – the first high is above the upper boundary of the band or touches it, while the second high is inside the band. Triple-top patterns occur more often than double-top ones. There should be a momentum decay at the classical peak. Traders call these patterns head and shoulders or double/triples peaks.
Double-bottom (“W”) reversal pattern – the first low is below the lower boundary of the band or touches it, while the second low is inside the band. Bottoms are more pronounced than tops in the charts. Their formation, as a rule, takes less time than peak formation. It is connected with the traders psychology – they act more actively at market bottoms than tops.
Trend strength confirmation pattern or ‘walking the band’. For example, in the event of a strong price trend movement, the prices may touch the band many times and close during a number of days above the band boundary. Bollinger calls such touches ‘walking the band’. The fact of touching the upper or lower boundary is not a signal for a trader because he has to take into account the general picture. In the event of a strong trend, the average line serves as the support.
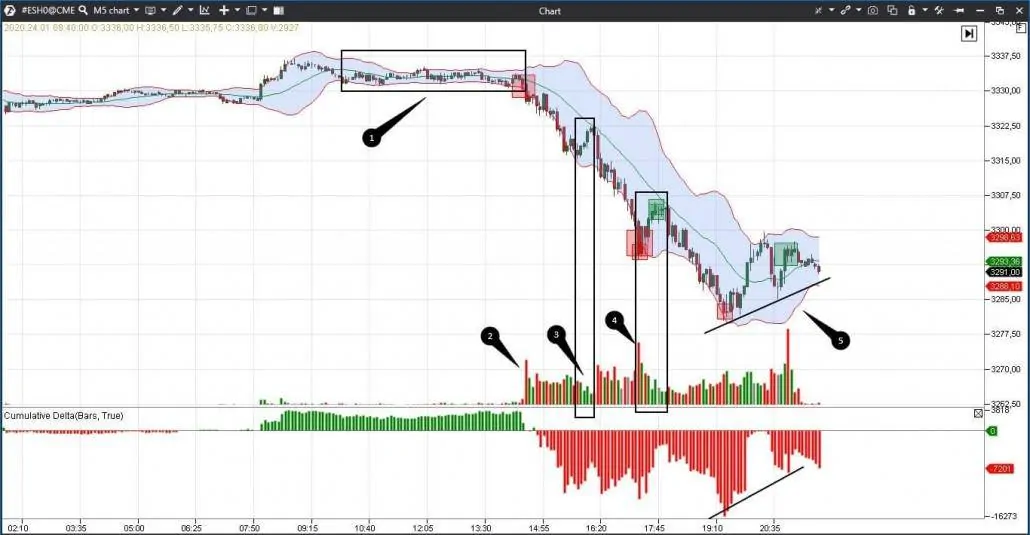
Let’s consider a ‘walking the band’ example in the 5-minute E-mini S&P 500 futures chart.
Apart from the Bollinger Bands, we added the Cumulative Delta, Big Trades and Volume indicators to the chart.
- Consolidation takes place in period 1. The breakout place is clearly seen (red square) – Big Trades shows aggressive sellers.
- Volume in candle 2 increased at the moment of the breakout and it could be assumed that it was a true breakout. The price constantly touches the lower boundary of the Bollinger Band during the down movement and this movement is called ‘walking the band’.
- Volume decreased during a small rollback in period 3. It is highly probable that the price decrease will continue.
- We see big sells and a huge red candle in period 4. Such a volume may indicate a selling climax, and it’s time the traders with short positions became alert and watched the market reaction. However, the local bearish trend is too strong, that is why we see a small volume during the rollback again. Perhaps, some of the traders would register the short position profit here.
- We see something that reminds us of a double bottom in period 5. The first bottom is below the Bollinger Bands boundary, while the second is inside. The trend strength reduces when the price stops touching the upper boundary or moves above it. Cumulative Delta confirms a possible trend change. However, you shouldn’t immediately open long positions in this situation. It is better to wait for additional confirmation because the bearish impulse was very strong.
The squeeze pattern. Bollinger Bands are put in motion by volatility. Consolidation takes place during a squeeze and volatility increases during the band expansion. Squeeze often ends with a false breakout. In the event of a squeeze, a trader sells during the lower boundary breakdown and buys during the upper boundary breakout of the Bollinger Bands. However, confirming signals from other indicators are required for opening a trade.
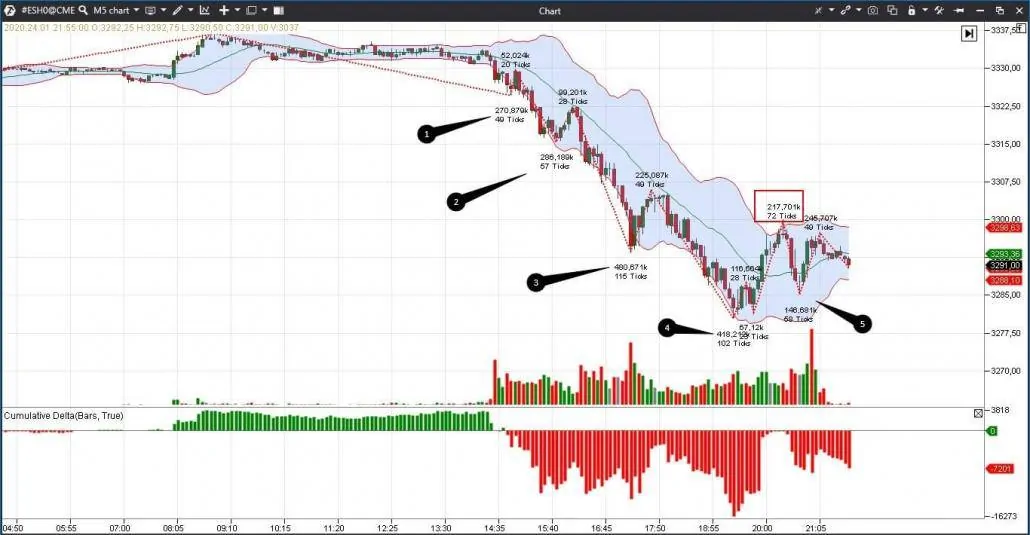
We already considered a 5-minute E-mini S&P 500 futures chart example. We used Big Trades and Cumulative Delta as confirmation indicators. Bollinger recommends in his book to use volume indicators for confirmation, that is why we will add the ZigZag pro indicator to the chart.
We see consolidation and very narrow Bollinger Bands in the upper part of the chart.
- The volume sharply increases during the breakout in point 1.
- Further on, the volume increases in points 2 and 3.
- The price fall slows down in point 4 and the volume decreases compared to point 3.
- We see the minimum volume for the whole local bearish trend in point 5. Perhaps, sellers ran out of steam and it’s time they registered the short position profit.
Examples of use
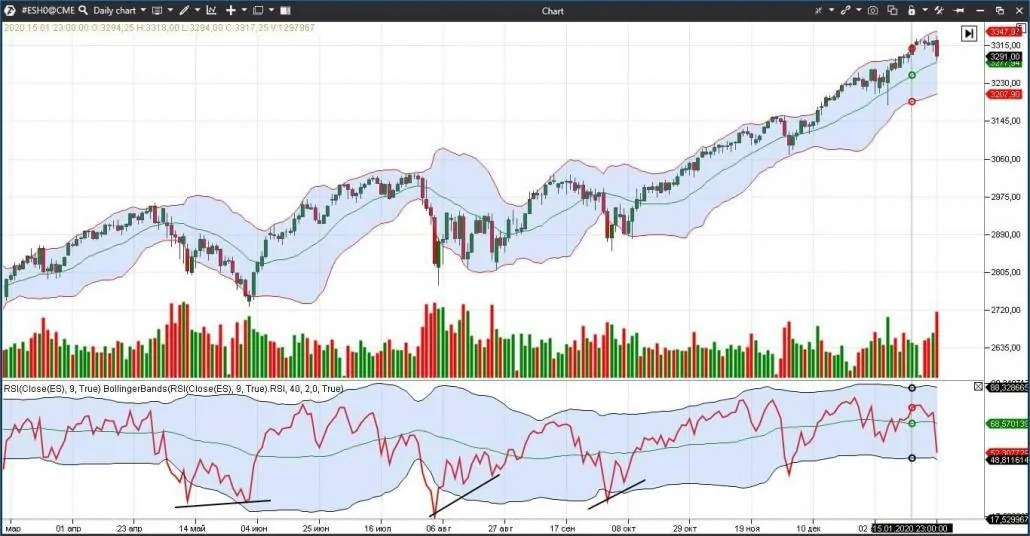
Bollinger Bands could be used not only for the price charts but also they could be ‘superimposed’ on other indicators, for example, RSI (Relative Strength Index). Bollinger recommends the following settings:
| Indicator | Length | Width |
| 9-period RSI | 40 | 2.0 |
| 14-period RSI | 50 | 2.1 |
Let’s consider an example in the daily E-mini S&P 500 futures chart.
Bollinger Bands identify overbought/oversold areas for the RSI indicator better than standard settings of 30/70. The same rules act here as in the price charts:
- divergence of tops/bottoms;
- the first top/bottom should be outside the band, while the second one – inside; the signal is considered to be true in this case only.
Main conclusions with respect to the Bollinger Bands
- High volatility alternates with the low one.
- Touches of the upper and lower band boundaries should be confirmed by indicators. Volume or cluster indicators should be used efficiently.
- Regression to the average is not so strong as it should be from the mathematical point of view. In fact, it means that the prices should come back to the average value after a significant deviation. However, it doesn’t always happen in actual practice.
- The biggest myth about the Bollinger Bands is that you should buy on the lower band and sell on the upper one. It might work and might not.
- Using additional indicators increases the number of successful trades.


