Fundamental stock market analysis.
Recently we spoke about the fundamental analysis of the currency market. Today we will focus on the company stock. Read in this article:
- What fundamental analysis of the stock market is;
- Industry analysis;
- Company analysis and financial ratios;
- Fundamental analysis of a Russian company;
- Fundamental analysis of an American company;
- Investment rules of Larry Williams.
What fundamental analysis of the stock market is.
Fundamental analysis of the stock market is identification of a fair stock price.
You can identify the fair price using mathematical calculations, for example:
- rate of return method;
- cash flow discounting method;
- or comparing competitive companies.
Mathematical models are rather complex, that is why we recommend to use annual reports, developed by different reference websites. Investors compare the fair price with the current market price and make a decision about selling or buying stock for making profit. In other words, the main goal of the fundamental analysis is to make profit, mainly in the long-term (investment) perspective. Two Americans, Benjamin Graham and David Dodd, laid the foundation of the fundamental analysis as early as in 1934. The full-fledged fundamental analysis consists of three parts:
- Macro- and micro-economic analysis. GDP, inflation, interest rates, unemployment and economic cycles – we will not consider these indicators in this article, since we considered them in detail in the article about fundamental analysis of the currency markets.
- Industry analysis. This analysis is conducted for better understanding of the company’s activity and its financial health.
- Company analysis.
It takes time and effort to conduct a comprehensive fundamental analysis. We will explain how to do it correctly from the theoretical point of view and will show you a practical example. The theoretical part of this article is scholarly and full of terms. If you have difficulties in perceiving a flow of terms, move to the practical section about the Lukoil company.
Industry analysis.
When conducting the industry analysis, investors assess attractiveness of the whole industry and prospects of its development. Besides, they assess the following indicators:
- Market size of the industry volume – this indicator is interesting for an investor from the point of view of the company’s growth potential. If the market size is limited, the stock price would not grow or would grow slowly. Such stocks are interesting for investors if the issuer pays stable and high dividends on the stock.
- Rates of the industry growth and profitability.
- Stages of the industry development:
Startup – earnings grow but there is no profit yet. It is risky to invest at this stage, but in case of efficient company development, the stock price would grow dramatically; Expansion – profit emerges and is reinvested into the company development. It is less risky to invest at this stage, but the growth of the stock price is lower; Explosive growth – earnings grow slower but the profit grows. The company has competitors. Inexperienced private investors, at last, notice the company at this stage; Maturity – the company starts to pay dividends at this stage. Conservative investors prefer a stable income and the stock price changes insignificantly; Downturn – it makes sense to sell the company’s stock at this stage.
- Industry significance. Export/import, state support and input into GDP are taken into account. Russia, for example, is oriented at the export of natural resources. The state supports oil producing companies.
- Competitive environment – whether there are monopolists, a number of competitive enterprises and their sizes.
- Dangers for the industry – for example, sanctions imposed against Rusal influenced the whole metallurgy industry and aluminium price in the world.
- Driving forces of the industry – for example, innovations connected with development of 5G networks would exert more influence on technological companies than on metallurgical ones.
Company analysis and financial ratios.
It is difficult and effort consuming to professionally analyze activity of a specific company. It is necessary to study financial reports for several previous years. Various reference and analytical resources provide these data in a convenient form. Sometimes this information is free of charge, for example, on investing.com, sometimes you have to pay for it, for example, on zacks.com.
- If you want to conduct the analysis independently, study balance sheets, profit and loss accounts, cash flow reports and other financial documents. Pay attention to:
- Income and expenditures;
- Pre-tax and after-tax income;
- Return on equity;
- Cash flow;
- Earnings per share;
- Company balance and leverage ratio;
- Capitalization;
- Book and disposal value of the company;
- Customer base;
- Technologies and innovations;
- Management;
- Market share.
Ideally, the indicators should improve every quarter and every year. If you do not want to read reports, use basic financial ratios.
Financial ratios.
Financial ratios reflect basic company characteristics briefly and clearly.
- EPS – Earnings Per Share – net profit on one ordinary share.
- ROE – Return On Equity – profitability of own capital or how much net profit was made on one dollar of own capital. It is the rate, under which the shareholders’ funds work. The higher the ROE is, the better the shareholders’ funds work.
- P/E – Price to Earning – relation of the company’s capitalization to the profit. Or, in simpler words, in how many years investment will return. The company is considered to be undervalued if this indicator is 0 to 5.
- P/B – Price to Booking – relation of profitability of own capital to the required rate of return. If the company ratio is higher than the industry ratio and the competitors’ ratio, the company could be overvalued. However, on the other hand, shareholders’ funds work more efficiently in companies with a high P/B. It is important for investors to understand why the ratio high or low.
- P/S – Price to Sales – relation of the share price to return on one share. Usually, this ratio is about 2, but if it is lower than 1, the company is undervalued.
- EBITDA – Earnings Before Interest, Taxation, Depreciation and Amortisation.
There are other financial ratios, some of which are used in specific industries only. For example, the relation of the company’s capitalization to the production is used for analyzing oil producing companies.
Fundamental analysis of Lukoil.
In this part of the article, we will show you how to conduct a fundamental analysis of the Lukoil company step-by-step. We do not conduct a multi-sided assessment and do not identify investment attractiveness, we just describe an algorithm consisting of 3 steps:
- assessment of the economy;
- assessment of the industry;
- assessment of the company.
First step is assessment of the RF economy
We take data from the analytical and reference websites:
- Analytical Center for the Government of the Russian Federation;
- Federal State Statistics Service;
- https://ru-stat.com;
- https://www.conomy.ru/.
We will not consider all economic indicators but only significant ones and will explain their influence on attractiveness of investing into the Russian business. This is not sufficient for a full-fledged and professional assessment but is quite acceptable for the purpose of an informative example.
| Indicator | 2015 | 2016 | 2017 | 2018 |
| GDP, trillion RUB | 83 232 | 86 043 | 92 037 | 97 283 |
| CPI (Consumption Price Index) – inflation indicator (by December), billion USD | 112,91 | 105,39 | 102,51 | 104,26 |
| Industrial Production Index in % to the previous year | 99,2 | 102,2 | 102,1 | 102,9 |
| Export, billion USD | 343,5 | 280,7 | 357,8 | 325,5 |
| Real wages in % to the previous year | 91 | 100,8 | 102,9 | 106,8 |
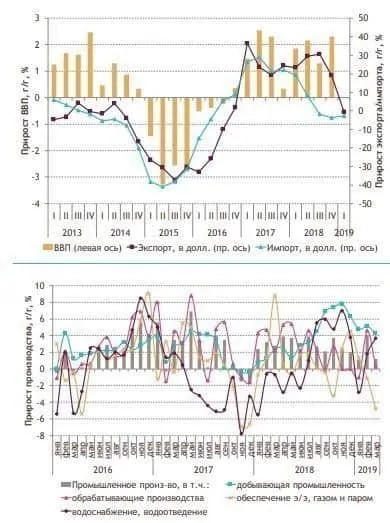
Picture shows GDP and production growth of the RF; the bulletin of the current tendencies of the Russian economy No. 48, April 2019.
Growth of GDP, Industrial Production Index and export increase investment attractiveness of the country. However, the GDP growth rates are insignificant and one shouldn’t expect a big inflow of investments. Slowdown in the growth of real wages reduces the consumer purchasing power, which is a negative factor. Reduction of inflation results in reduction of interest rates and economic growth, which is a positive factor for the economy and investments. When interest rates go down, investors would look for more profitable variants of investing money funds than bank deposits. However, slowdown of growth of real income might decrease investments and increase current expenditures. The sanction pressure exerts a big influence on the Russian economy. It is difficult to make firm conclusions about the attractiveness of investments. However, return on stocks and bonds of Russian issuers is higher than that of the American and European ones.
Second step is analysis of the oil and natural gas industry.
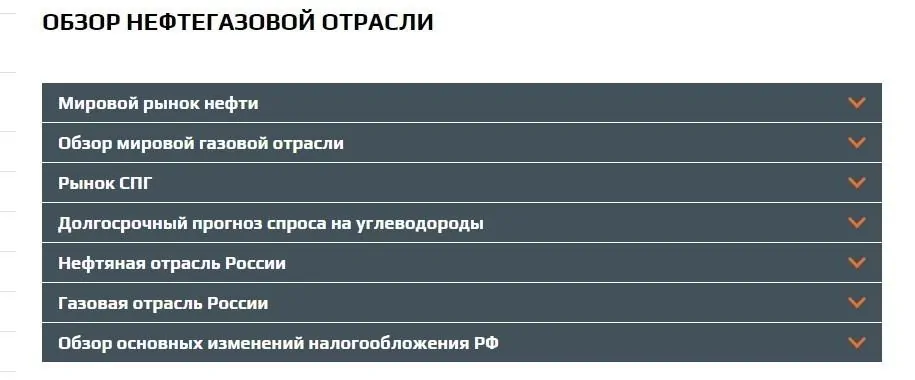
We take data from analytical, reference and information websites and also from the websites of the companies of the oil and natural gas industry:
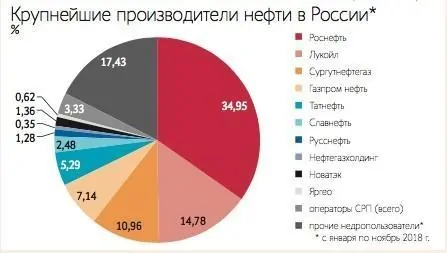
Russia is one of the world leaders in oil extraction and refining. The industry is stable and the oil prevails in export. Main players in the oil industry are shown in the picture from the Vedomosti newspaper as of December 18, 2018.
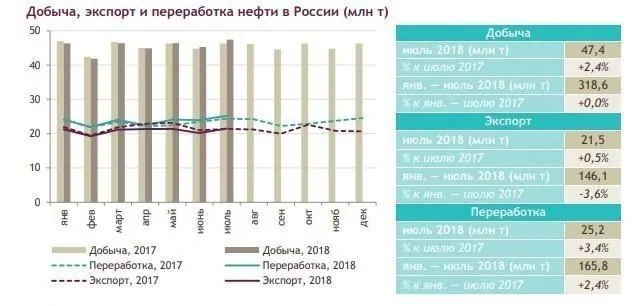
We took the data about oil extraction, export and refining from the Energy Bulletin No. 63.
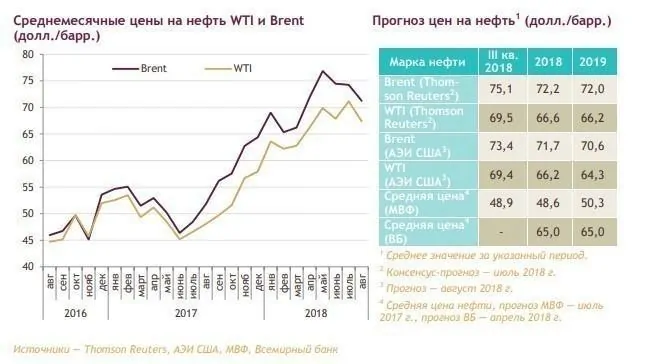
Monthly average prices on oil are also taken from the bulletin.
These data are again insufficient for a comprehensive industry analysis.
An investor needs to consider nearest (time-wise) data and additional specific parameters of the industry, such as refining structure and production dynamics of oil products. For more information use data of oil and natural gas companies, such as Rosneft or other analytical data.
We make a conclusion on the basis of the collected information that the oil industry attracts investors and the current prices on the oil futures contracts do not pose threats to the Russian economy.
Third step is the company analysis.
Now we will analyze financial indicators of the company. We will use data from reference websites and the company issuer website:
In order to conduct a comprehensive analysis, an investor would have to study accounting and financial reports not only of the Lukoil company, but also of its closest competitors, as well as specific ratios of the oil and natural gas industry, which we didn’t include into the table.
| Indicator | 2017 | 2018 | Change | Average by the industry – for independent calculation |
| EPS – earnings per share, RUB | 589,14 | 874,47 | 1,48 | |
| P/E | 5,66 | 5,67 | 1,00 | |
| P/B | 0,8 | 1,045 | 1,30 | |
| ROE, % | 13 | 17,78 | 1,36 | |
| Dividends, RUB | 215 | 250 | 1,16 | |
| Dividends, % | 6,45 | 5,04 | 0,78 |
The company indicators improve, which is a positive factor for investments. For a comprehensive analysis, it is necessary to compare the company indicators with the indicators of its competitors and also to assess which factors additionally influence the current value of the company stock. For example, the stock repurchase, which Lukoil does now, increases the stock price. The threat of American sanctions decreases the company value. The fundamental analysis should end with a conclusion about expediency of investing into the Lukoil stock. Each investor should make such a conclusion by himself.
Fundamental analysis of American companies.
Use the data from reference or official websites for a fundamental analysis of American companies:
- US Federal Reserve System;
- https://www.yardeni.com/;
- https://www.bloomberg.com;
- https://ycharts.com – free test access for 7 days.
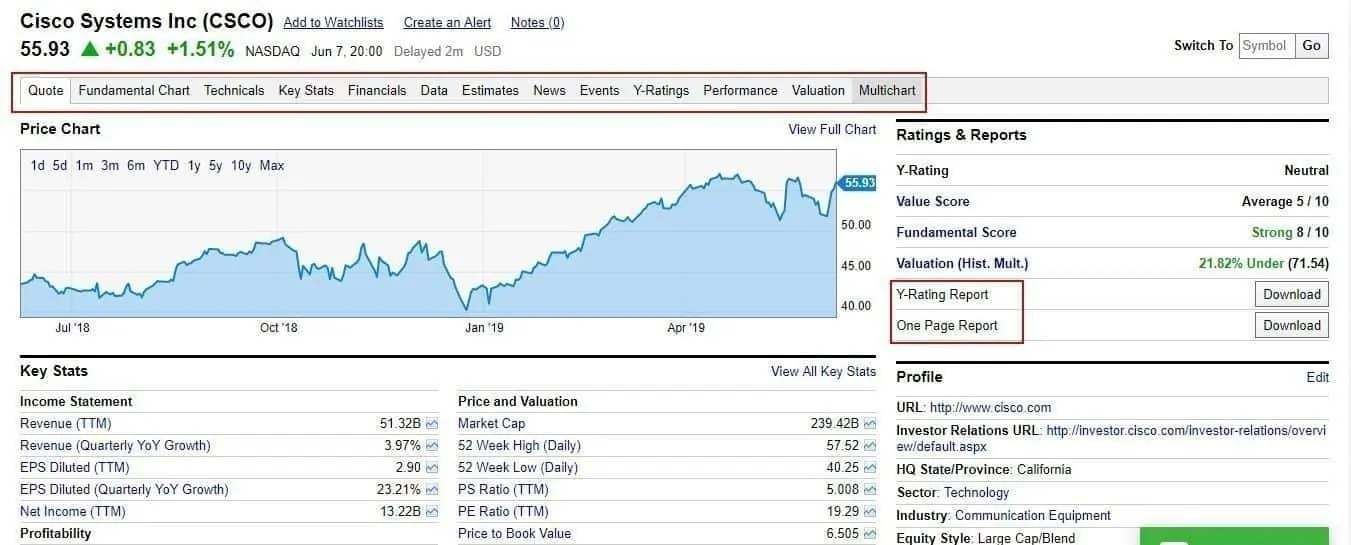
For example, a fundamental analysis of the Cisco company. We marked key data and reports, which an investor may download from the website, with red rectangles.
The algorithm of a fundamental analysis of an American company coincides with the algorithm of analysis of a Russian company. A difficulty emerges due to the documentation in a foreign language and a big number of issuers. The American stock market is much bigger than the Russian one and also it is more developed. A majority of companies offers a wide range of accompanying services (such as fundamental analysis and other services), which is very interesting for long-term investors.
Investment rules of Larry Williams.
Let’s consider the investment strategy of Larry Williams. Larry Williams is a legend of the forward market, who increased his startup capital from USD 10 thousand to more than USD 1 million during one year. He traded not only forward contracts but stock too. He describes his methods of long-term investing in his The Right Stock at the Right Time book. Here are some of the advice for investors from this book:
- Avoid risk or avoid companies with P/S > 1. Parameters were essential in 2003, when the book was written. Perhaps, they should be adapted to the current markets now. We already wrote above that this parameter is about 2.
- Take into account seasonality. Trading on different days of the week, month and time of year is a favourite Larry William’s subject.
- Take into account business cycles.
- Buy shares with low P/E ratio. Such shares are undervalued by the market and a probability of growth of their price is high.
- Buy shares with a high return and low price. If you find such shares, you will get profit both from the price growth and from the dividend income.
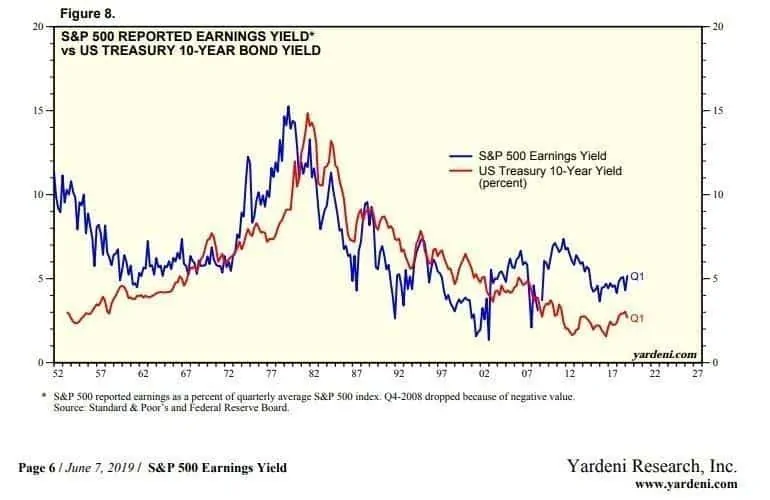
- Compare the stock price and profitability of state bonds. High rates and low cost of bonds is the bearish market of stocks. When companies have to pay more for the use of the borrowed capital, they will reduce dividends and profitability. The chart below shows interconnection of the yield of 10-year American state bonds (red line) and yield of S&P 500 index (blue line).
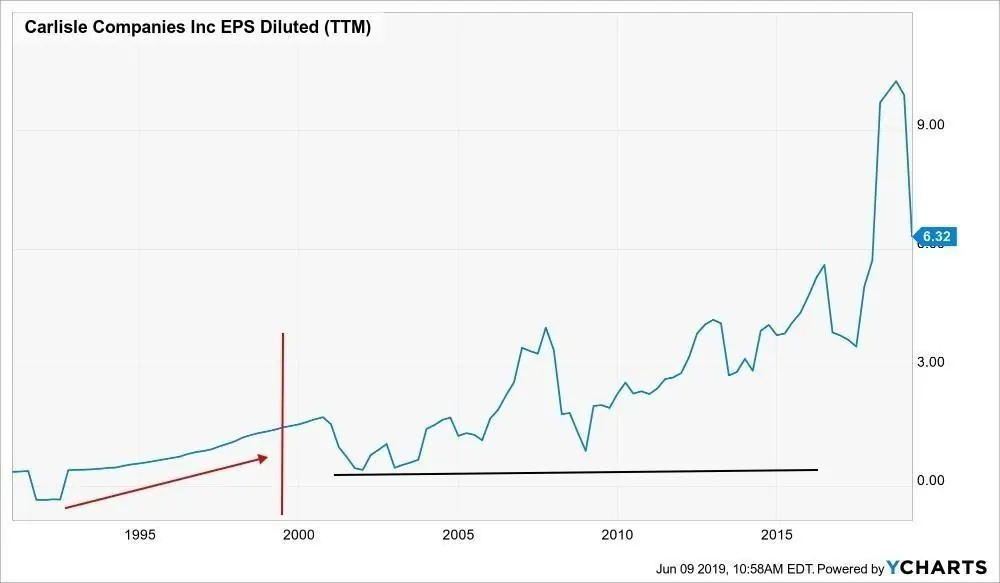
Buy stock, which outruns the market by EPS in a stable manner.
Larry Williams gives an example of Carlisle Companies Inc, but the chart ends on 1999. Further on, EPS was not that smooth, however, the ratio has never moved below the lows of 2000s. The P/S of this company is 1.82 in 2019, and it was less than 1 in 2012.
Summary.
The legend of the financial markets Richard Wyckoff started from learning the intrinsic value of the railroad companies’ stock. He made a conclusion about expediency of investing into stock if:
- the current price of the stock was lower than its intrinsic value;
- technically, the chart demonstrated signs of strength (demand was over supply).
Fundamental analysis of the stock market is useful for a long-term investor for selecting stock. Technical analysis and/or cluster analysis:
- confirms conclusions made during fundamental analysis, for example, if the chart demonstrates initiative buys;
- allows choosing the right moment for entering into a long position.
The trading and analytical ATAS platform will help you to select the best moment for buying perspective stock. Download the free version. Perhaps you can beat Larry Williams.


