Imbalance: trade on the winning side
This war ended after just being started. From the first shot until the total victory of Britain, the Zanzibar troops managed to protect their positions for about 38 minutes. Zanzibar commanders definitely didn’t estimate imbalance in forces before they got into the shortest war in world history.
Since buyers and sellers fight in the market, understanding of whose volumes dominate in it at a certain moment of time has a crucial influence on profitability or unprofitability of your trading. Detection of imbalances in buys or sells in the chart would allow you to accurately assess who got the initiative and where a trade with a high success probability should be opened.
In this article:
- Superior forces in the fight for the price.
- Looking for strong trading formations.
- Stand along the trend from the very beginning.
- Distinguish exchange of shots from a full-scale offensive.
- Profitable trading on the side of superior forces.
Superior forces in the fight for the price
Every minute millions of retail traders take aggressive positions in the market being completely ignorant with respect to what forces act against them. Such an opposition in the market takes the form of imbalances, which represent major formations of buyers or sellers at specific price levels.
The price levels, at which imbalances were formed, could be marked by traders in the chart and used in further trading as support or resistance levels.
Imbalances are represented by two groups of participants in the market:
- Aggressive buyers: traders who wish to enter the market at the best price for the buyer (best Ask), which is offered by the seller, in order to push the price higher.
- Aggressive sellers: traders who are interested to move the price lower. They enter the market at the best price for the seller (best Bid), which the buyer offers.
When these groups of buyers and sellers massively open trades in a narrow price range, they could be allocated into imbalances. Imbalances, which are located close to each other, could be assessed as a force the retail traders should regard with. Detection of such imbalances in the market gives a trader an immediate understanding of the size of the force, which intends to push the price in one or the other direction.
Looking for strong trading formations
Institutional traders are interested in protecting each position, which they take in the market. In their turn, retail traders need to know when and where these positions were aggressively taken by institutional players. This is very important since retail traders do not possess sufficient resources for independent protection of their own positions. But how to detect ‘entrenched’ positions of the superior institutional forces? Advanced instruments of the trading and analytical ATAS platform will help you in it.
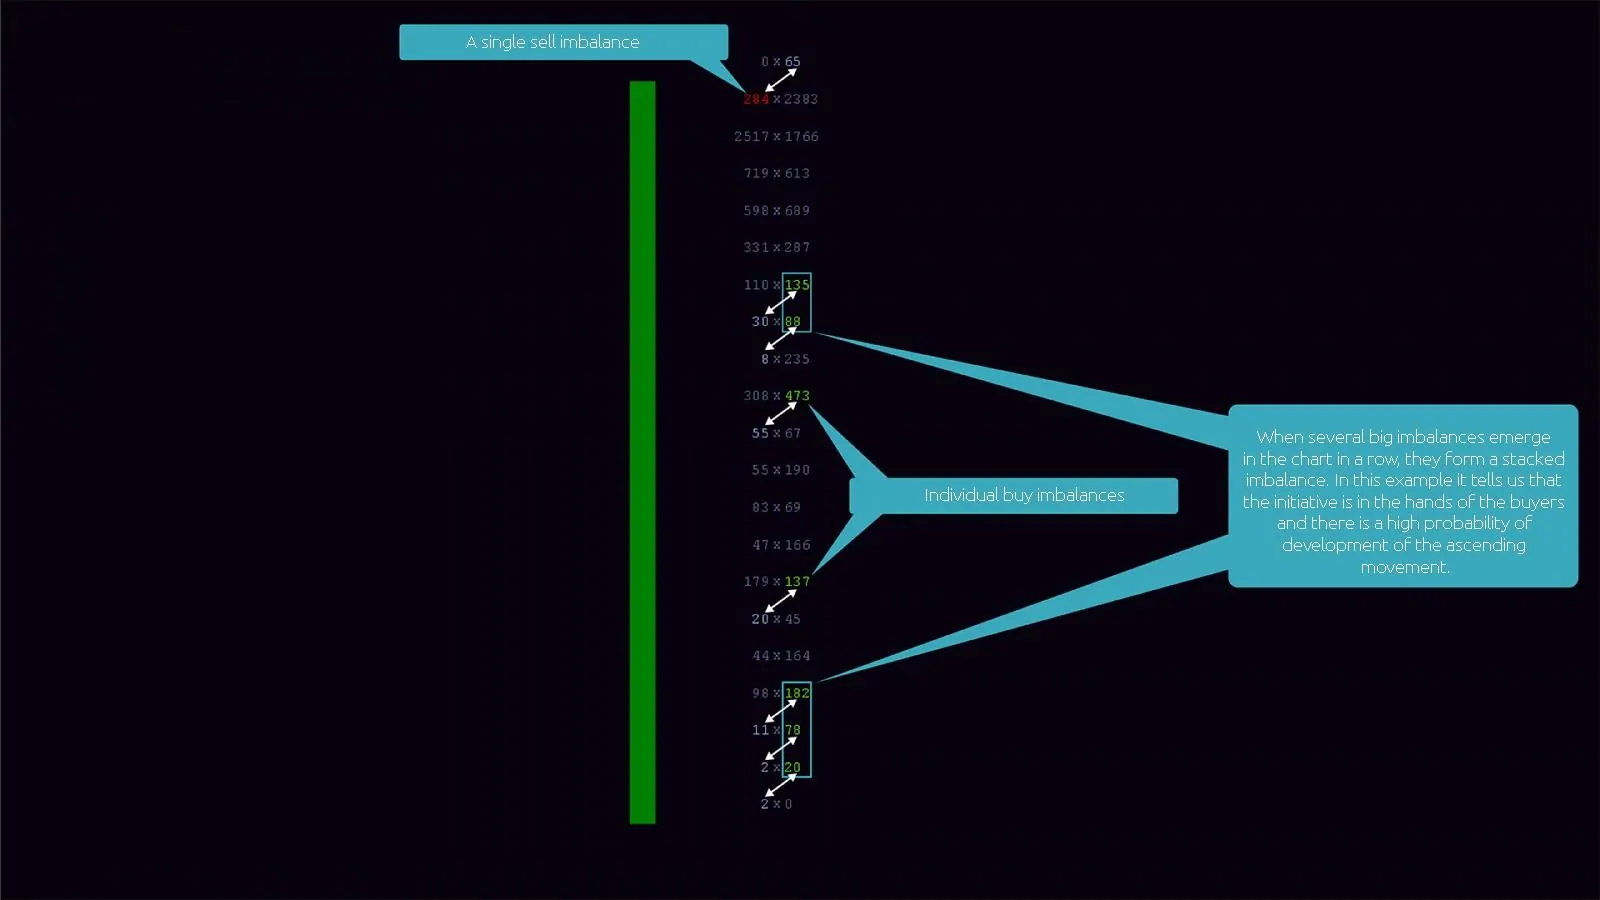
Example of a Bid x Ask Imbalance Footprint chart bar of the ATAS platform.
It is very easy to find and analyze imbalances with the help of advanced instruments of the volume analysis of the trading and analytical ATAS platform. Note the right part of the bar with imbalances in the picture above. Imbalances, which are coloured bright-green, mean that preponderance of buyers is more than 300%. A single imbalance in the upper part of the bar, coloured red, means that preponderance of sellers is more than 300%. Imbalances, in which none of the sides has preponderance of more than 300%, are coloured grey.
The flexible settings of the ATAS platform give you a possibility to independently set any size of preponderance in percentage which is currently important for the traded financial instrument. It could be done through the Visual Settings menu item, selecting then the Cluster Settings tab and then find the Bid/Ask Imbalance Settings item at the end of the list.
- Values 135, 88, 473, 137, 182, 78 and 20, coloured bright-green from the right side of the bar, are imbalances for buying at the Ask price.
- Compare these buy imbalances with respective sell imbalances at the Bid price. To do it you need to move down cornerways by one tick down and to the left. Thus, the Ask position in the volume of 135 contracts will be compared with the Bid position in the volume of 30 contracts.
- You can see that difference in volumes between buyers and sellers is not less than 300%. We can draw a conclusion from this that, following the results of closing the bar, which we consider, the initiative is in the hands of the buyers.
Stand along the trend from the very beginning
If Zanzibar military officers had knew about three British first-class protected cruisers and two gunboats, which were ready to strike their positions, they would have thought twice before getting into a one-sided fight. This way they could have avoided shellfire from more than 50 British guns or, at least, could have better prepared for defense.
A single buy or sell imbalance, which emerged in the bar, doesn’t mean anything yet. A number of imbalances, closely located to each other, visually representing a stacked imbalance, could be metaphorically compared with 50 warning shots from naval guns.
A stacked imbalance represents two, three and more imbalances which go one after another. Stacked imbalances mark areas in the chart which are controlled by buyers or sellers. As soon as these areas of big volumes are detected, be assured that they will be tested by the price, playing the role of the support or resistance level.
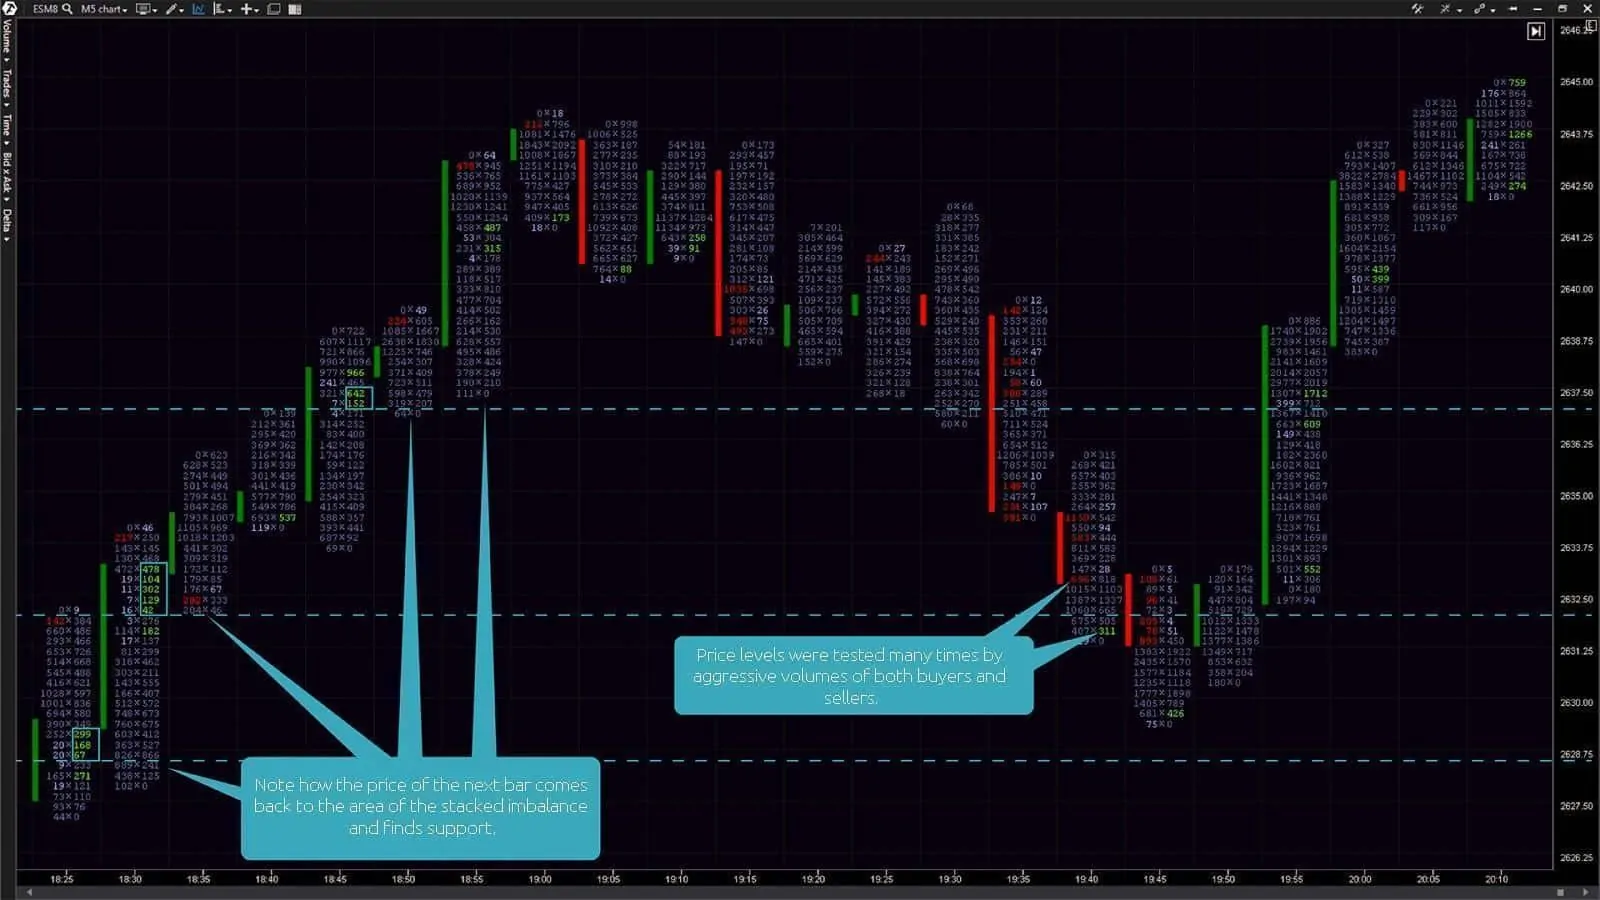
Let’s check how it works through the example of the 5-minute chart of an S&P 500 futures mini-contract (ticker: ES) below. The chart shows a multitude of single imbalances, which is a result of opposition between buyers and sellers. However, when you note the stack of 4 imbalances inside the second growing bar in the left part of the chart, bear in mind that:
- Imbalances are connected with price levels, which were set earlier by the stack of 3 imbalances in the first growing bar to the left. The first stack consists of 3 imbalances, while the stack at the moment of final recapture of initiative by the buyers consists of 4 imbalances already.
- Price levels are tested many times by aggressive volumes of both buyers and sellers.
- Emergence of a stack with 4 imbalances means that the buyers control the price.
5-minute chart of an E-mini S&P 500 futures. Bid x Ask Imbalance Footprint chart.
As soon as you decide where to enter the market, wait for emergence of the second stack of imbalances in the chart. It would help you to stand along the trend. Entry into the market should be confirmed by availability of a previous stacked imbalance towards your trade and price testing of this level.
Distinguish exchange of shots from a full-scale offensive
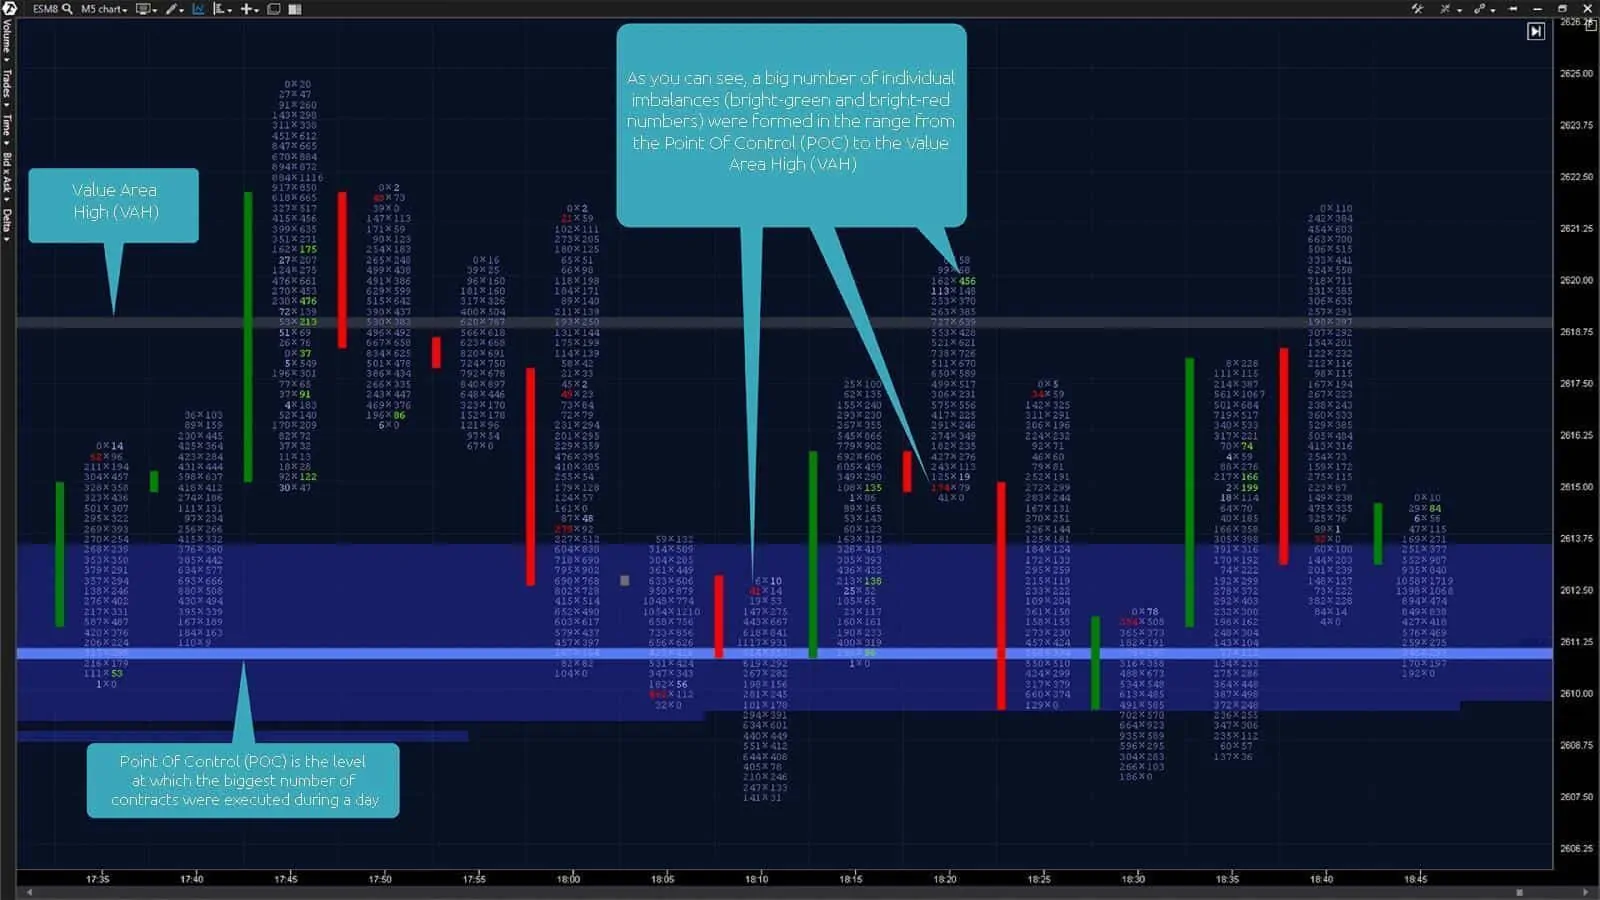
There will be imbalances both from the side of sellers and buyers during the market fight, especially in the area of a fair price. The chart below shows that 5-minute bars contain multiple single big imbalances from both sides. It seems that the predominating force in the market hasn’t been identified yet.
5-minute chart of an E-mini S&P 500 futures. Bid x Ask Imbalance Footprint chart and the Market Profiles indicator (with an external period = 1,440).
Monitoring the difference of buyer and seller forces in the immediate proximity to imbalances, coloured bright, will tell you whether this imbalance is an anomaly or not. Preponderance of open aggressive positions from one or the other side is assumed as the difference of buyer and seller forces. Quite often, individual imbalances, which are not anomalies, are accompanied with smaller, coloured grey, but still big imbalances which difference is smaller than 300%. They could be analyzed the same way as we did through the example of the Bid x Ask Imbalance Footprint chart bar at the beginning of the article.
If the difference in buyer and seller forces stays insignificant at the moment of completion of the bar formation, be careful and do not enter the market until the side, which took the initiative in its hands, is identified in the next bars. If the difference in forces is only being formed in the bar, look attentively for the previous stacked imbalances, which are located at previous price levels, characterized with big volumes.
Profitable trading on the side of superior forces
In the result of the 38-minute war the sultan fled leaving its army on the battlefield. In general, the Zanzibar troops lost 500 soldiers, while The British troops had no losses apart from one sailor who had a couple of light wounds.
Millions of traders today take positions in the market being sure that they would be able to protect them. However, they have no idea about the scale of the superior forces of institutional players. Look at the battlefield from above and identify the winner with the help of the advanced volume analysis of the ATAS platform before the ‘first shot is fired’.
Try to detect superior forces among aggressive buyers or sellers using imbalances which are formed in each bar. Distinguish emergence of single imbalances from stacked imbalances which testify to availability of the momentum in the market or send a signal about a probable change of the price movement direction. Cross-check stacked imbalances with previous trading volumes and earlier formed imbalances for confirmation of opening your trade.
Act only after the dominating side manifested itself. Triumphantly gain profits while your rivalries give up their positions and ‘throw out a white flag’ over their trading accounts.
If you have got interested in the imbalance subject, we can recommend you to read our earlier articles about it, namely: Imbalance: how to make money under any conditions and Imbalance: why the size matters. Lucky trading!


