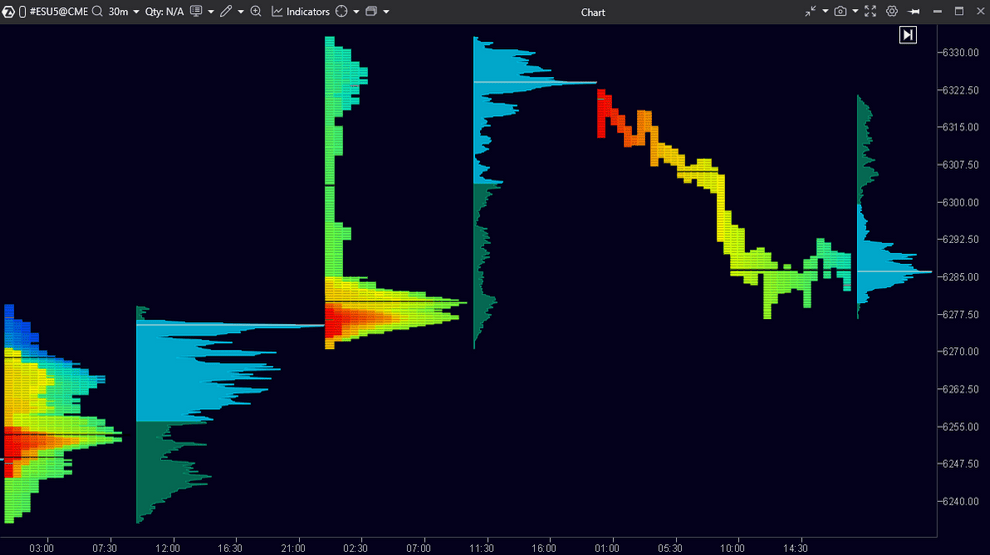
Unlimited Charts and Frames
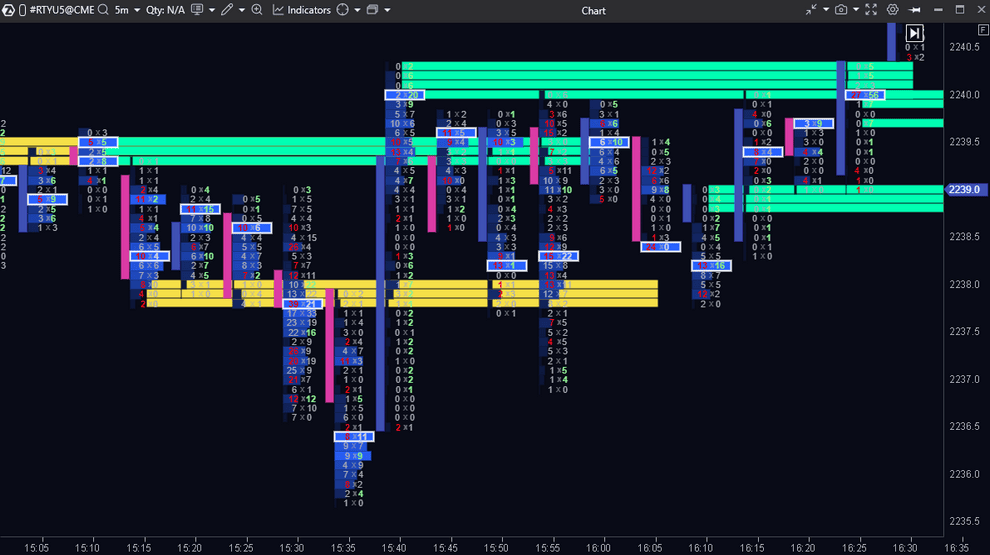
ATAS charts give traders complete freedom of analysis — from classic candlesticks to cluster-based Footprint charts.
You can observe market activity in fine detail, track supply and demand imbalances, and identify key price levels where major players acted.
Choose from a wide range of frames, combine volume, delta, and trades to get a transparent view of market dynamics.
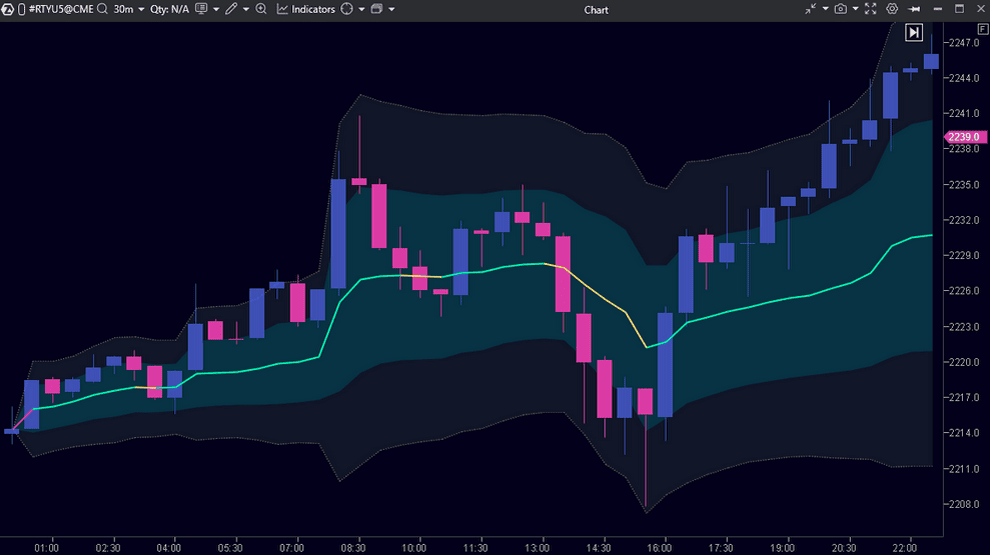
Advanced ATAS Indicators
ATAS includes over 240 indicators for both volume and traditional technical analysis — from Delta and VWAP to Market Profile and Cluster Search.
Combine them on a single chart to identify patterns, track institutional activity, and confirm your price movement hypotheses.
Customize filters, ranges, and visualizations to match your trading style — from scalping to position trading.
Exchange and Broker Connectivity
ATAS brings together exchanges, brokers, and data providers in one unified workspace.
Connect your trading accounts via API to analyze stocks, futures, and cryptocurrencies in real time or using historical data.
Test your strategies on demo accounts, work with prop firms, and manage your crypto connections — all while maintaining full control over your data and security.
Trade Management Made Simple
The ATAS trading interface gives you full control over every trade — from placing orders directly on charts and the order book to automating risk management.
Set up trading panels, hotkeys, and protection strategies, and monitor your positions and trading history in one window.
With the Market Replay module, you can practice strategies and study market behavior without risking real capital.
Smart Tape and Order Flow Analysis
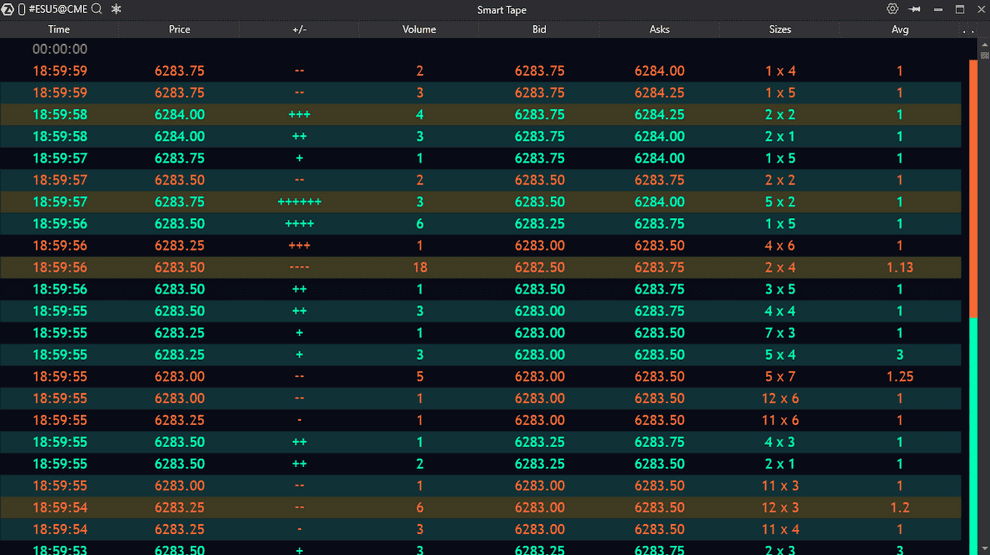
ATAS tools for Bid/Ask and Smart Tape reveal the true structure of market activity.
They filter out noise and show where buyers and sellers are active, how volume is distributed, and who drives the market initiative.
Smart Tape visualizes the order flow in real time, helping you detect imbalances, impulses, and key areas of liquidity.
See the Market from the Inside
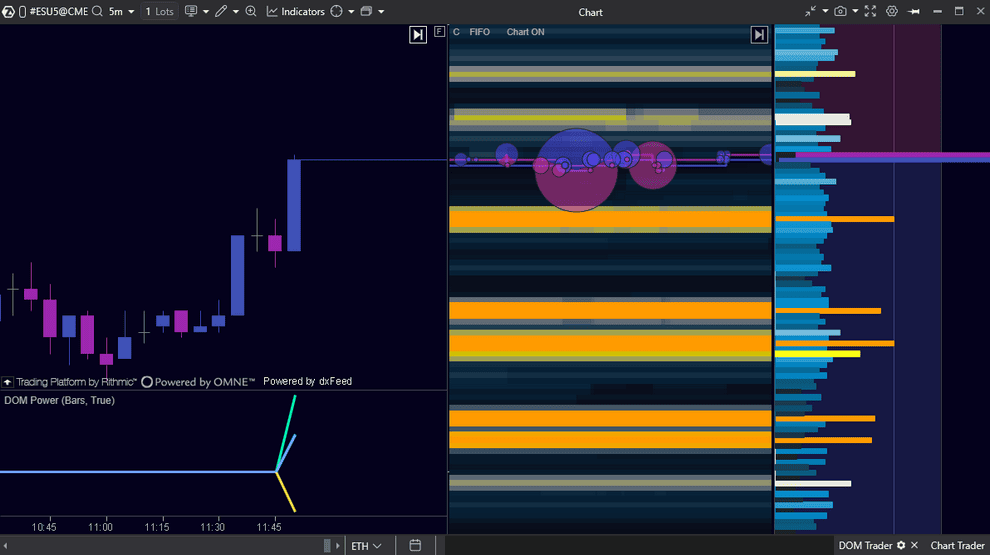
ATAS tools let you view the market from the inside — from order book depth to large order activity.
Smart DOM, DOM Power, and Heatmap visualizations help you identify areas of supply and demand, spot manipulations, and locate key entry points where liquidity is concentrated.
You see how orders form, where they cluster, and how capital moves — all in one place.