Professional Trading Charts
Unmatched flexibility in chart analysis software:
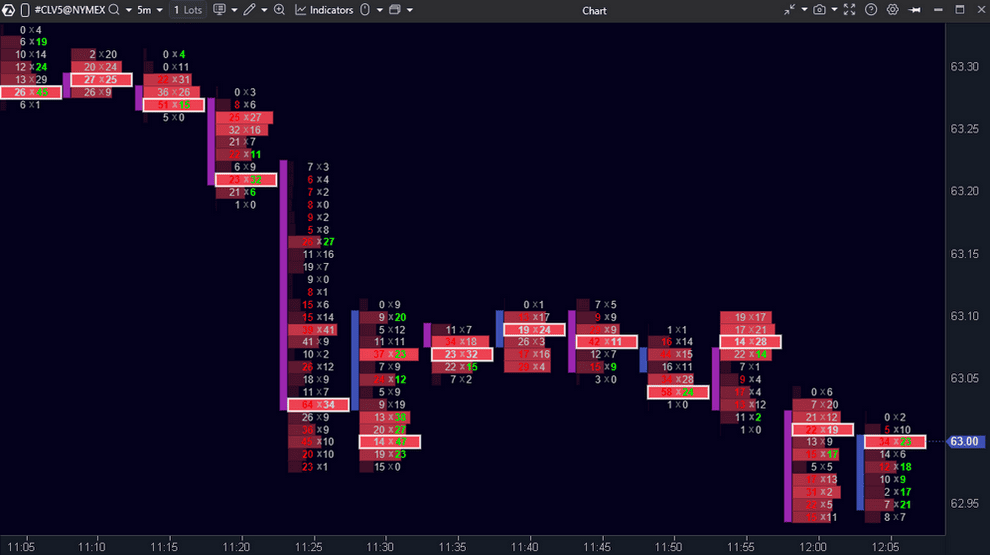
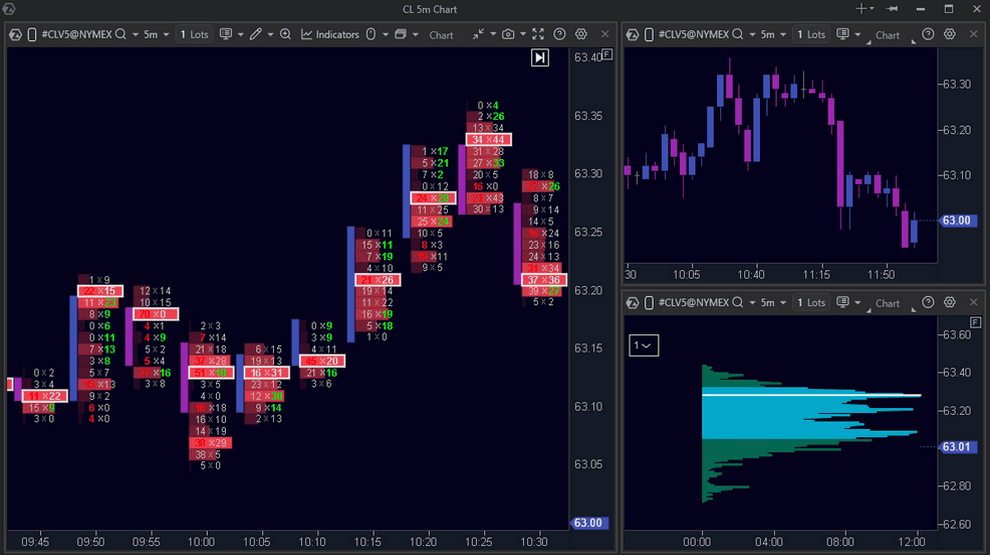
- 400+ cluster chart configurations based on Volume, Delta, Trades, and Bid x Ask data;
- Line and candlestick charts in classic or transparent styles.
Analyze charts in real time or use historical data to uncover market dynamics hidden from other traders: trading speed and volume, buyer-seller imbalances, trade concentration, and the activity of major players. Whether you use it for stocks, futures, or crypto, ATAS is among the best charting platforms for in-depth market visualization.
Unmatched flexibility in chart analysis software:
- 400+ cluster chart configurations based on Volume, Delta, Trades, and Bid x Ask data;
- Line and candlestick charts in classic or transparent styles.
Analyze charts in real time or use historical data to uncover market dynamics hidden from other traders: trading speed and volume, buyer-seller imbalances, trade concentration, and the activity of major players. Whether you use it for stocks, futures, or crypto, ATAS is among the best charting platforms for in-depth market visualization.
A Unique Set of Time Frames
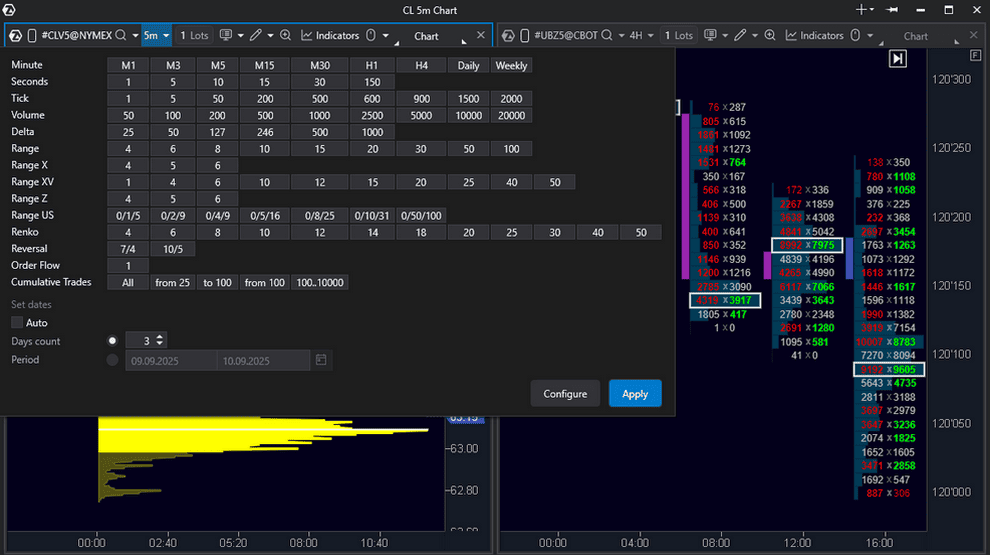
14 customizable time frames with flexible settings and chart trading functionality for precise analysis and full control over orders:
- Standard time frames: seconds, minutes, hours, weekly, and monthly;
- Advanced trading charts for reducing market noise: Range, Range X, Range XV, Range Z, Range US, Renko, and Reversal;
- Volume-based time frames: Cumulative Trades, Volume, Delta, Tick, and Order Flow Chart;
- Custom time frames: create unique time frames with any desired period.
Universal Profile
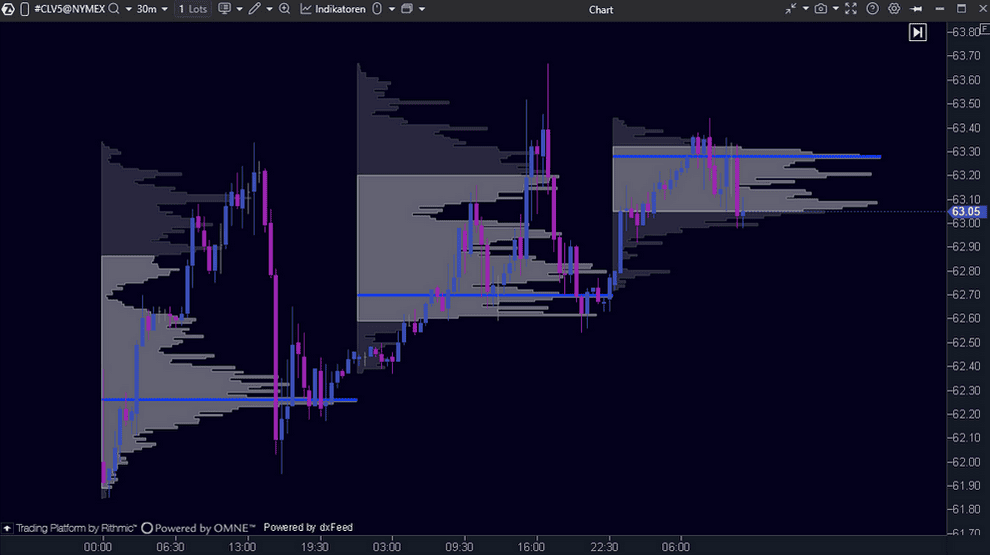
Market Profile provides a new perspective on the market. Trends and ranges help identify fair value zones, overbought and oversold areas, and key support and resistance levels directly on your trading analysis chart.
Market Profile is built on Time Price Opportunity (TPO) analysis. Each TPO block shows when and at what price an asset was traded.
Profiles analysis reveals volume distribution across price levels, making it easier to identify high-activity zones and pinpoint key areas of significant shifts in the supply-demand balance.
Powerful Technical Analysis Tools
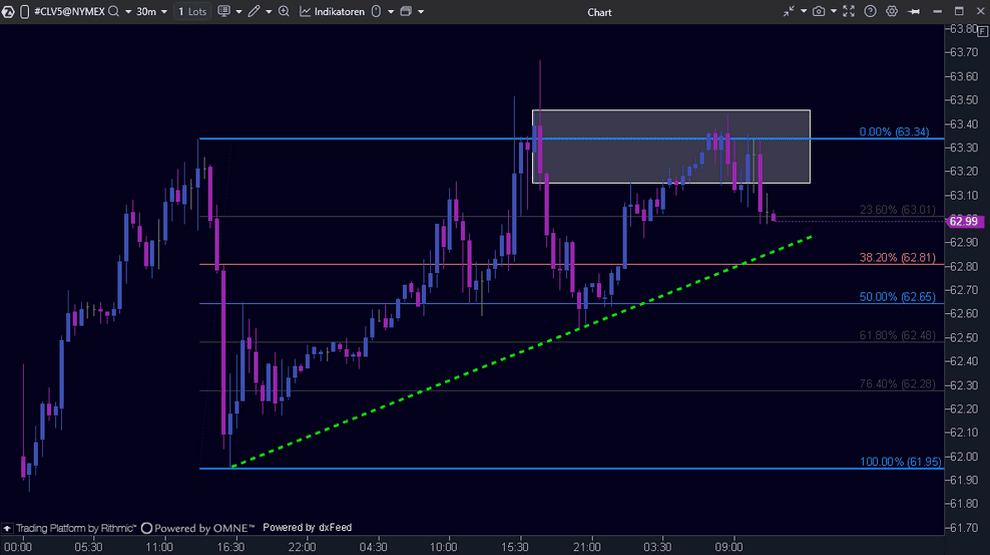
ATAS is one of the best footprint charting software that also provides a wide range of classic drawing objects:
- 20+ lines, channels, and other classic drawing objects;
- Tools for in-depth analysis, such as Anchored VWAP, Dynamic POC, CVD Correlation, Market Profile and TPO, and Long/Short Position;
- Global objects enable you to add shapes with a single click and manage them across all charts using the same instrument.
Full Control Over Interface and Settings
Customize the interface of real-time charting software via modular architecture – efficient and clutter-free:
- Move, group, and resize modules with your mouse;
- Instantly switch between chart layers, tape, and DOM – with no data loading delays.
Save templates with preconfigured charts, frames, indicators, and drawing objects.
Create advanced trading charts, footprints, and heatmaps with your visual styles.
Customize orders, alerts, hotkeys, news feed, language, and time zone – everything for fast and convenient work.