Uncover Hidden Footprint Patterns
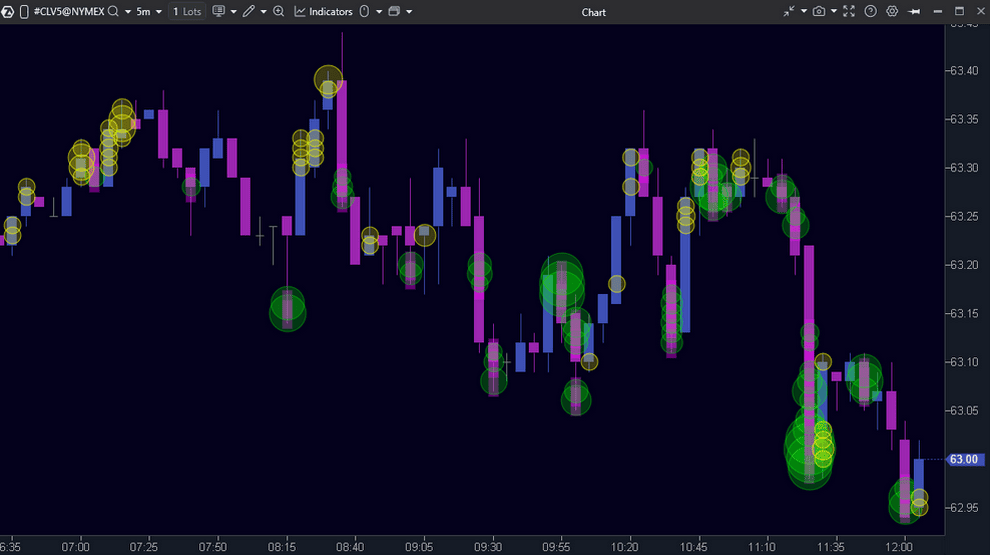
Cluster Search is a powerful feature of our software for identifying cluster patterns, offering a wide range of filters and flexible visualization options:
- Highlights key clusters based on criteria such as bids, asks, volume, delta, trade count, and time;
- Helps filter market context based on the balance of buyers and sellers, bar direction, price location, and ticks from extremes;
- Filters delta and imbalance data to understand market dynamics;
- Reveals the true drivers of price movement through delta and imbalance filters;
- Adapts to market activity changes throughout the day with time-based filters.
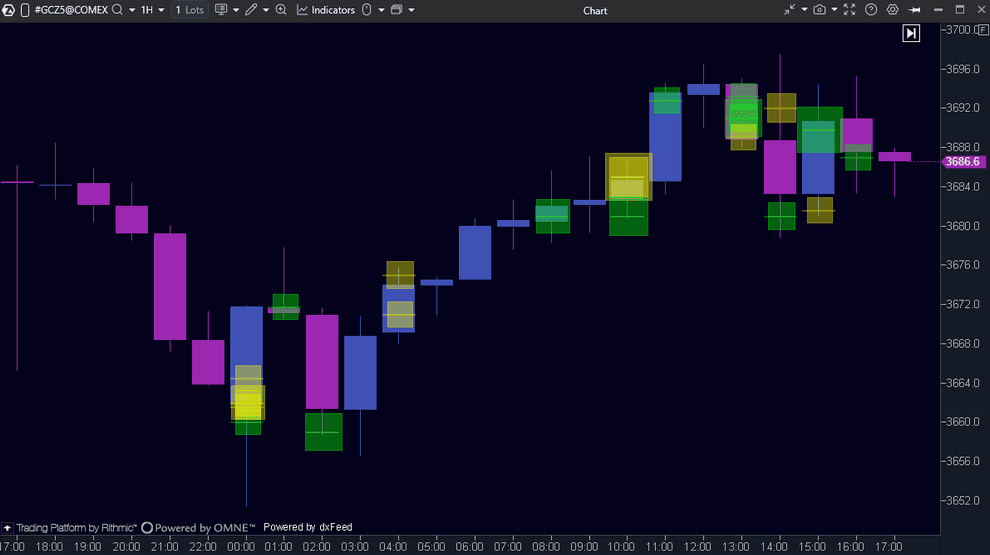
Look Inside the Candle
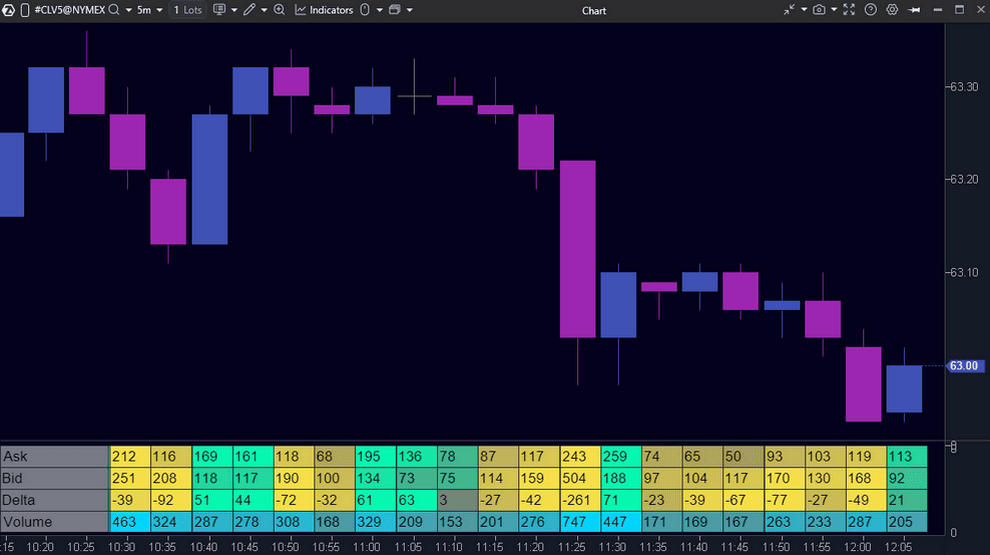
Cluster Statistic is a robust tool within our analysis software, providing comprehensive insights into the vertical volume structure of each candle:
- Percentage breakdown of buys and sells (Bid/Ask);
- Volume for a specific candle and the entire trading session;
- Duration of the trading session;
- Classic delta values;
- Percentage of delta and volume for individual candles and the entire session.
Never Miss a Big Trade
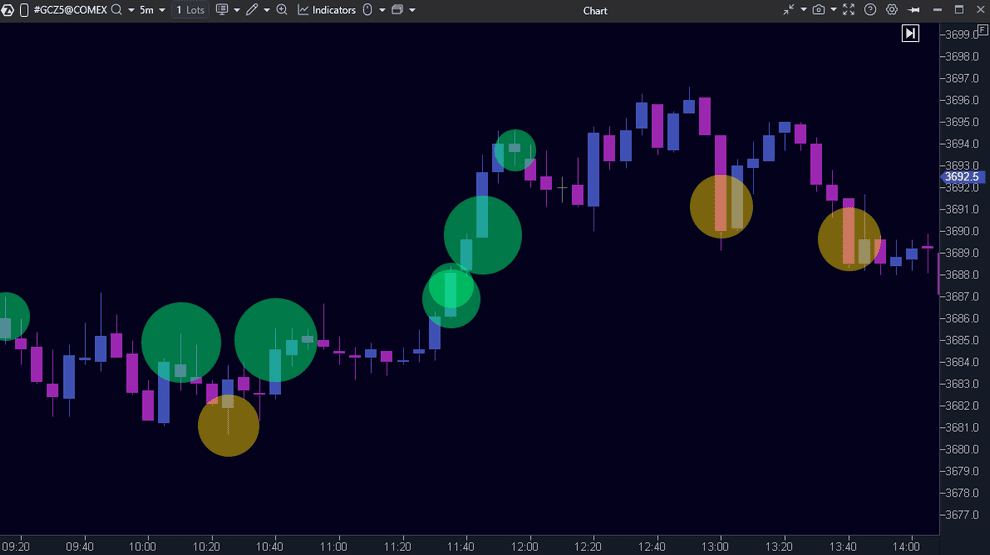
Big Trades visually displays high-volume market trades directly on the chart:
- Marks trades from major market participants based on specified parameters;
- Shows the aggregated trade size instead of the fragmented prints generated by exchange algorithms;
- Automatically adjusts settings to match market conditions;
- Adapts to market activity fluctuations throughout the day using time-based filters.
Streamlined Visualization of the DOM
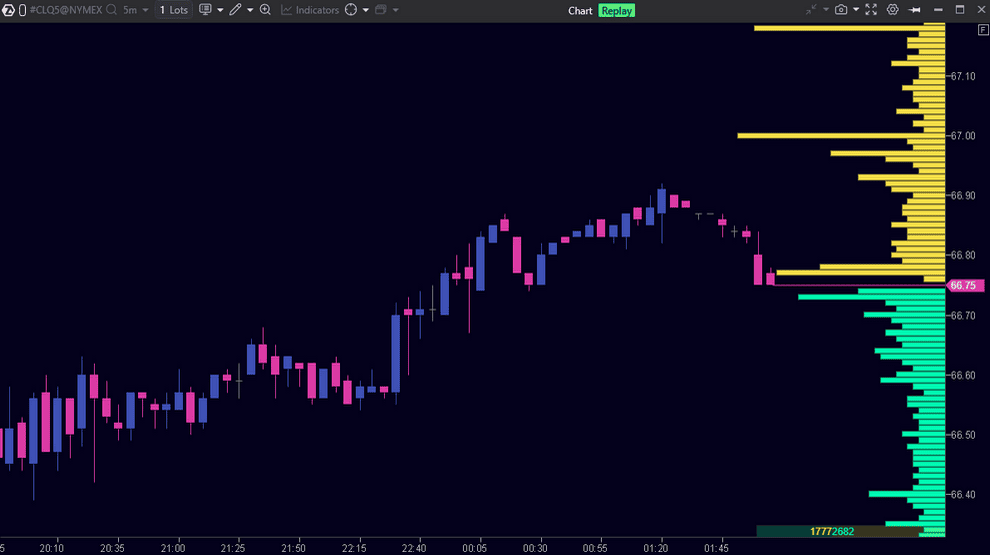
Depth of Market reveals the order book structure: buy and sell orders with their volumes at each price level:
- Monitor real-time market dynamics to make scalping more effective;
- Identify key price levels that buyers and sellers consider critical;
- Find ideal entry and exit points using real-time support and resistance levels;
- Customize the display of cumulative market depth, colors, and scale to fit your trading strategy.
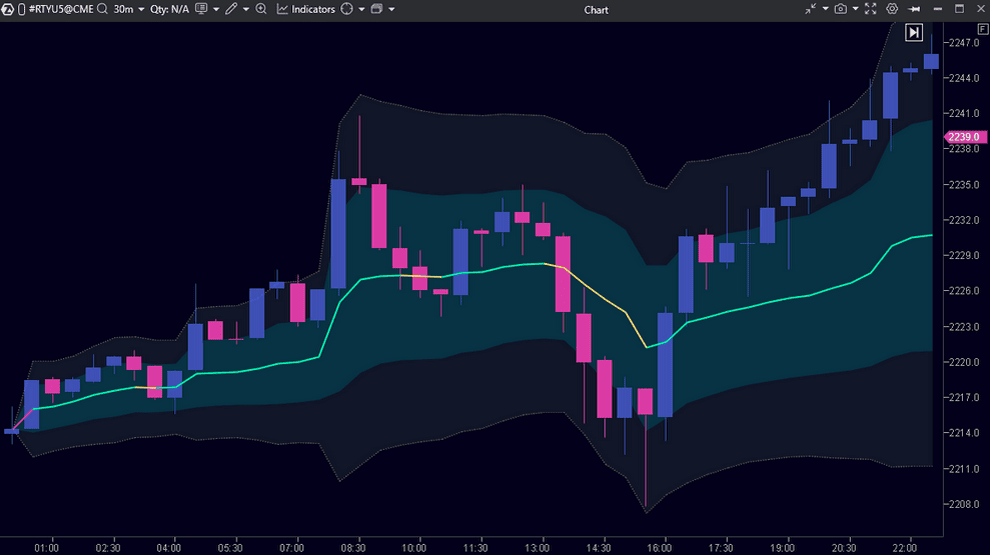
True Market Power Ratio
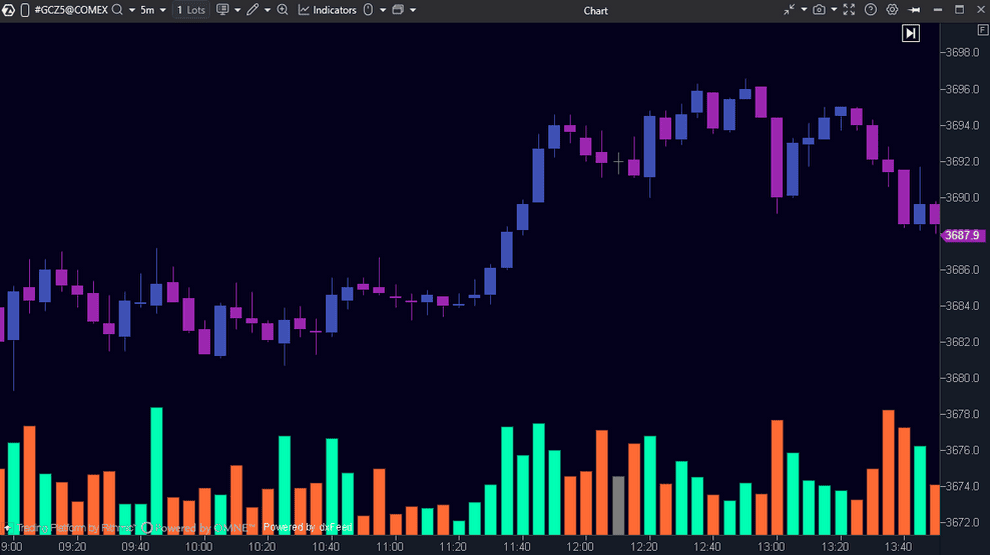
Volume is a histogram that shows the trading volume for each candle, helping you assess the true balance of power between buyers and sellers:
- In Volume mode, it displays the exact number of contracts traded within a given time frame;
- In Tick mode, it shows the number of trades involving one or more contracts;
- It is presented in an intuitive format with customizable colors, line types, scaling, and volume display directly on the chart, helping you save workspace.
Delta Indicators: See Who Is Leading the Market
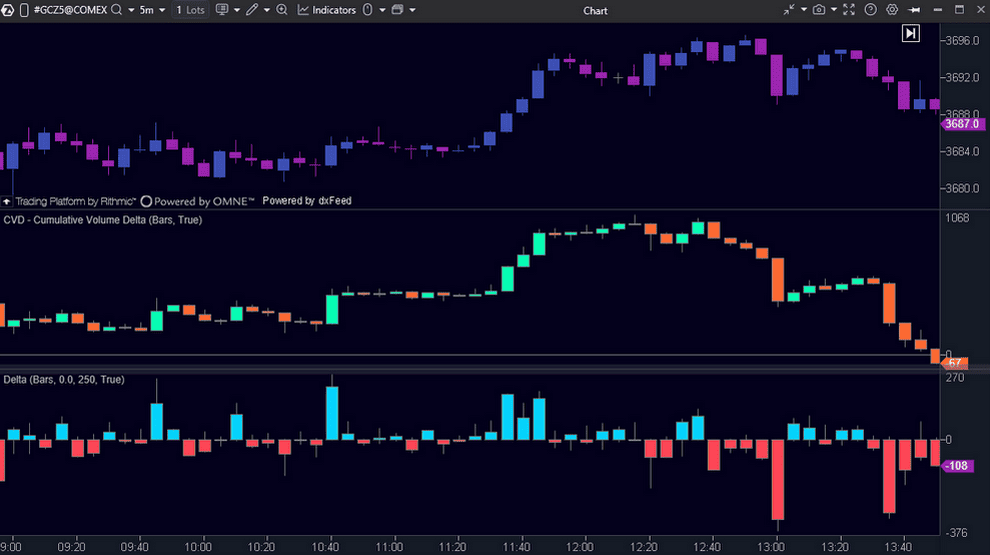
Professional analysis tools for traders in candlestick, bar, and extreme mode help you quickly see who is leading the market and spot players with different levels of capital:
- Delta is a powerful analysis tool that shows the difference between market buys and sells. A negative delta indicates more selling initiatives, and vice versa.
- CVD (Cumulative Volume Delta) adds up the negative and positive delta values over a set period, showing the overall market buy/sell dynamics since the start of the trading session or contract.
- CVD Pro enables you to filter by volume and track the cumulative delta of large or small trades, allowing you to focus on the activity of strong or weak players.
Get the Most Out of Horizontal Volumes
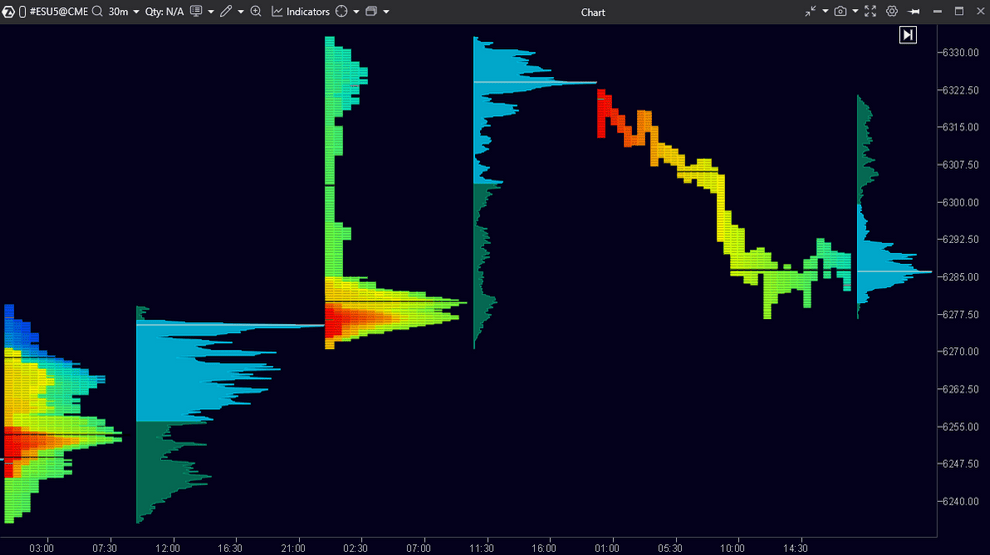
Market Profile & TPO shows where and for how long the price stayed at certain levels, helping to identify areas of balance, interest, and potential reversal:
- Builds profiles based on time (TPO) and volume, highlighting key levels: POC, VAH, VAL;
- Displays the Value Area where the market spends the most time;
- Identifies areas of highest trading activity and formation of key price levels;
- Helps detect the shift from balance to impulse – critical decision points;
- Adapts to any trading session, timeframe, or instrument.
Assess the Market Imbalance
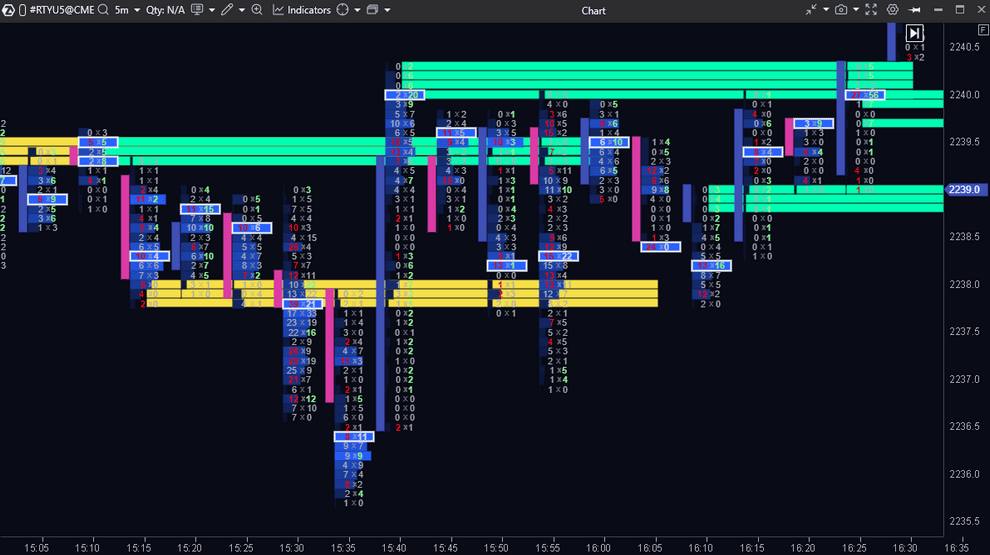
Stacked Imbalance highlights a clear imbalance between demand and supply:
- Helps identify aggressive buyers and sellers;
- Used for trend confirmation;
- Spots potential areas of interest based on volume differences between buys and sells at adjacent price levels;
- Imbalance Ratio, Range, and Volume settings enable you to define precise imbalance criteria – its absolute and relative magnitude, as well as the number of price levels to analyze;
- Can mark support and resistance levels, even before the price reaches them.
Volume-Weighted Average Price (VWAP)
VWAP is an excellent example of technical indicator. The signal shows how the current price compares to price trends over the day, week, month, or even year. The indicator displays the same line regardless of the time frame: whether it is a minute chart, hourly, Range Bar, or Renko. VWAP stays consistent across time frames!
- Helps identify trends, ranges, and reversals;
- Used to find support and resistance levels in real time;
- Shows market sentiment across different periods with no data processing delays – VWAP compares current values to those from yesterday, last week, or last month.
Track Intensity and Speed of Volume Appearance
Tape Patterns analyzes the flow of trades (Time & Sales) and detects recurring market patterns that may indicate the activity of large participants:
- Identifies typical print sequences related to aggressive buying or selling;
- Highlights repetitions and anomalies in market participants’ behavior;
- Can help spot the start or end of hidden accumulation and distribution phases;
- Works with both live and historical data – convenient for analysis and testing.
Unique tools from community members
You can access indicators developed by ATAS partners and community members. These analytical tools draw on practical experience with volumes, market structure, and participant behavior.
The ATAS API lets you create and connect your own indicators for specific analysis tasks. You can implement your idea in C# yourself or hire professional programmers who work with the ATAS ecosystem.