Limit Orders Under the Microscope
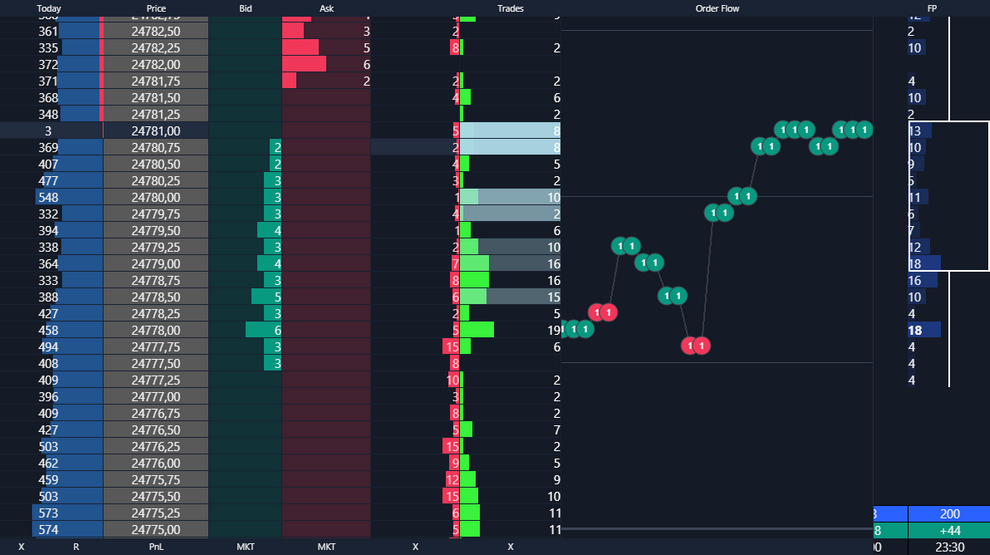
The Smart DOM module and the DOM Power indicator are advanced tools for analyzing the depth of the market. These features provide a clear view of an asset’s liquidity and display actual volumes at different price levels:
- Analyze order volumes waiting in the queue for execution and data from completed trades;
- Easily identify liquid support and resistance levels with indicators;
- Assess the buyer-to-seller ratio with the DOM Power indicator;
- Detect manipulations by large players;
- Apply filters to reduce market noise.
Visualizing Liquidity with Heatmaps
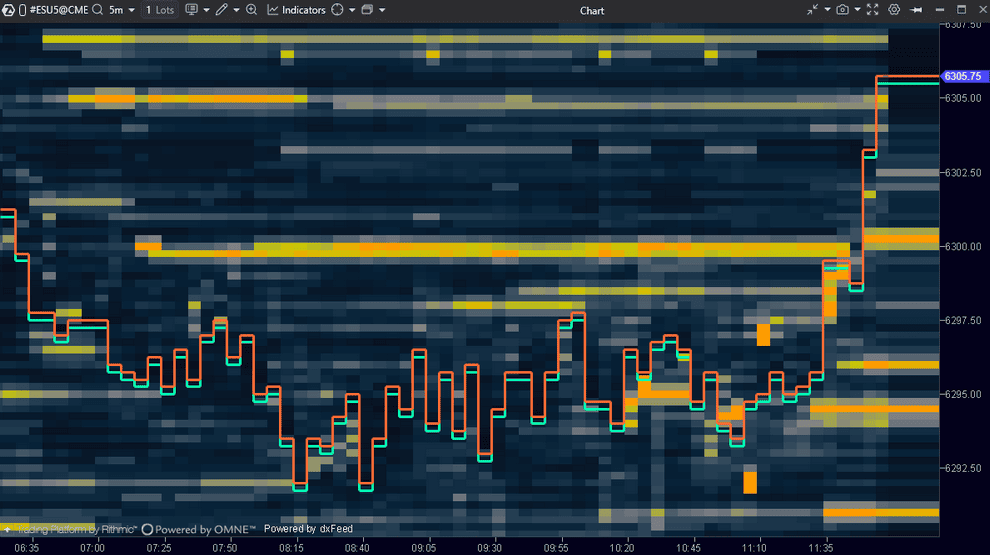
The Heatmap is a visual tool for analyzing liquidity, designed to work with the DOM Trader module and DOM Levels indicator. The brighter the level on the chart, the greater the volume of limit orders placed at that level in the DOM:
- Identify the most promising entry points;
- Make scalping more convenient.
Detailed Order Information
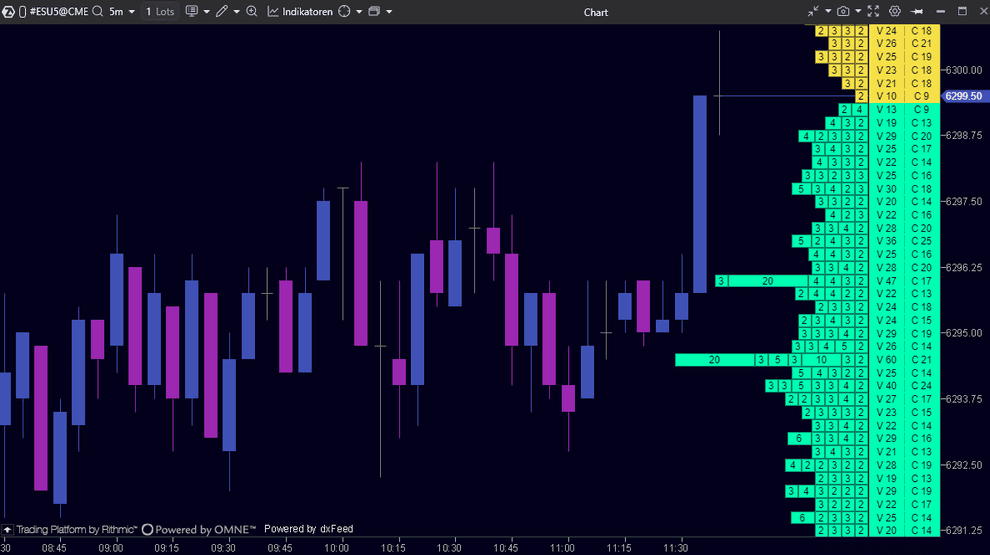
MBO DOM is an advanced tool that builds the order book using exchange-provided data on individual orders (Market by Order):
- Explore the composition of each order book level, including order volumes and the sequence of their placement;
- Analyze detailed information for each order, such as price, volume, time of last update, order ID, and priority in the execution queue;
- Customize filters by volume, adjust square colors and transparency, highlight rows, and more.