A simple method to read stock price quotes
It is difficult to imagine trading without price charts and running price quotes, isn’t it? Just to think that there were no charts, we are used to today, a century ago and they used chalk, board and telegraph, through which the price change data was broadcast from the exchange, to register the price. A famous speculator Jesse L. Livermore started to trade drawing stock price quotes on a board using chalk.
Nowadays, you can read price quotes from American, European, Russian and Asian exchanges sitting at home. You just need:
- to download a trading platform, ATAS for example;
- to turn on price quotes;
- and you have all instruments, required for professional analysis of the stock and futures market, in 5 minutes.
However, you should remember that reliable online price quotes cost money, since they transmit a detailed information about all trades of buyers and sellers. Further on, ATAS takes this information and processes it building a price chart, but not a simple one. You can load a footprint, delta, volume profile and about 20 more different instruments of the professional volume analysis.
What should you know when reading stock and futures price quotes?
The most important is to monitor actions of buyers and sellers. Namely they move the price with their market orders or stop movement with their limit orders. That is why it is very important to find the following in the chart:
1. Emergence of major buyers.
2. Emergence of major sellers.
3. Price reaction to the levels, where buyers or sellers emerged.
This will be sufficient to build a trading strategy and get fresh intraday support and resistance levels. Moreover, you will get this information immediately, unlike the indicators based on price (for example, stochastic or MACD – Moving Average Convergence Divergence), which are late by their nature and do not carry urgent information about actions of buyers and sellers.
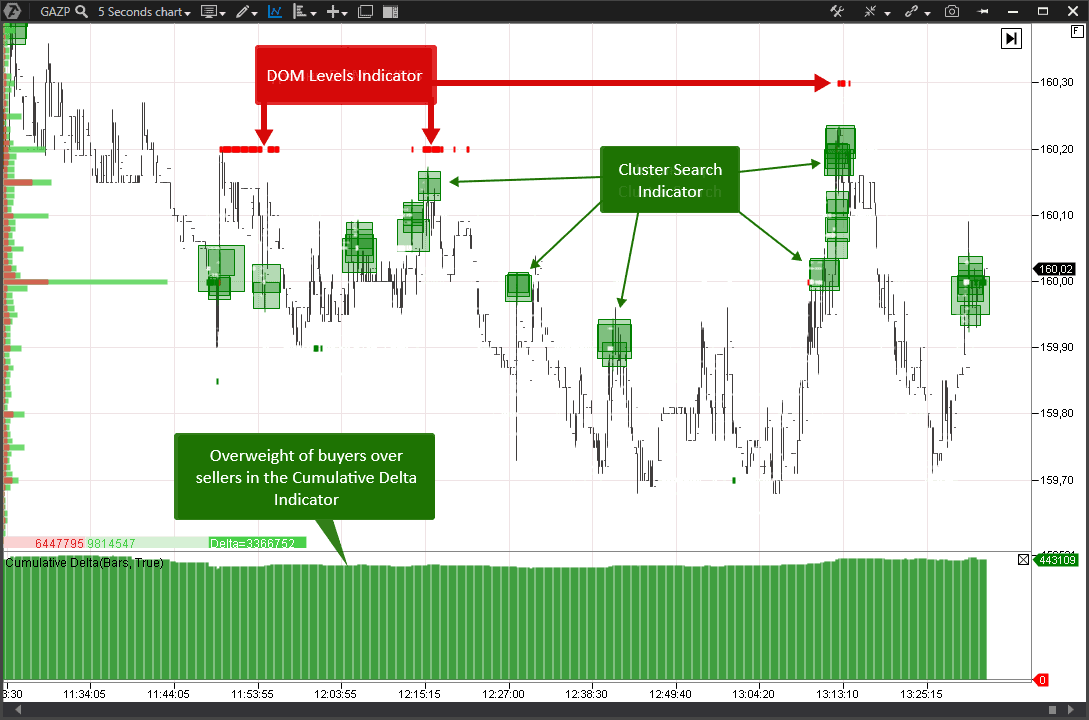
Here how the chart with online stock price quotes and some of the most advanced ATAS indicators – Cluster Search, Cumulative Delta and DOM Levels – looks like.
- Cluster Search will help to find splashes of buyers and sellers in the chart. It will also help to build important levels, which you should pay attention to during trading.
- Cumulative Delta will show general dynamics of changing the mood of market buyers and sellers during a day. You will be able to see when traders open short or long positions aggressively, which would be reflected in the form of growth or reduction of the bars. After which you will see the price reaction to these actions and will be able to make a conclusion about whether buyers or sellers are really strong.
- DOM Levels will show you levels with big limit orders. These orders also play the role of reference points, which could stop the price movement in future. In other words, apart from the intraday clusters, which Cluster Search would show you, you will get understanding to which levels the price would tend. You will also be able to understand where it might reverse.
Don’t you think it’s great to get all the necessary information about what buyers and sellers do “here and now” and what they, most probably, would prefer to do in future?
Examples of chart reading
Let us consider several examples with this set of indicators in the chart in order to conduct stock market analysis and read price quotes.
First example – SBER
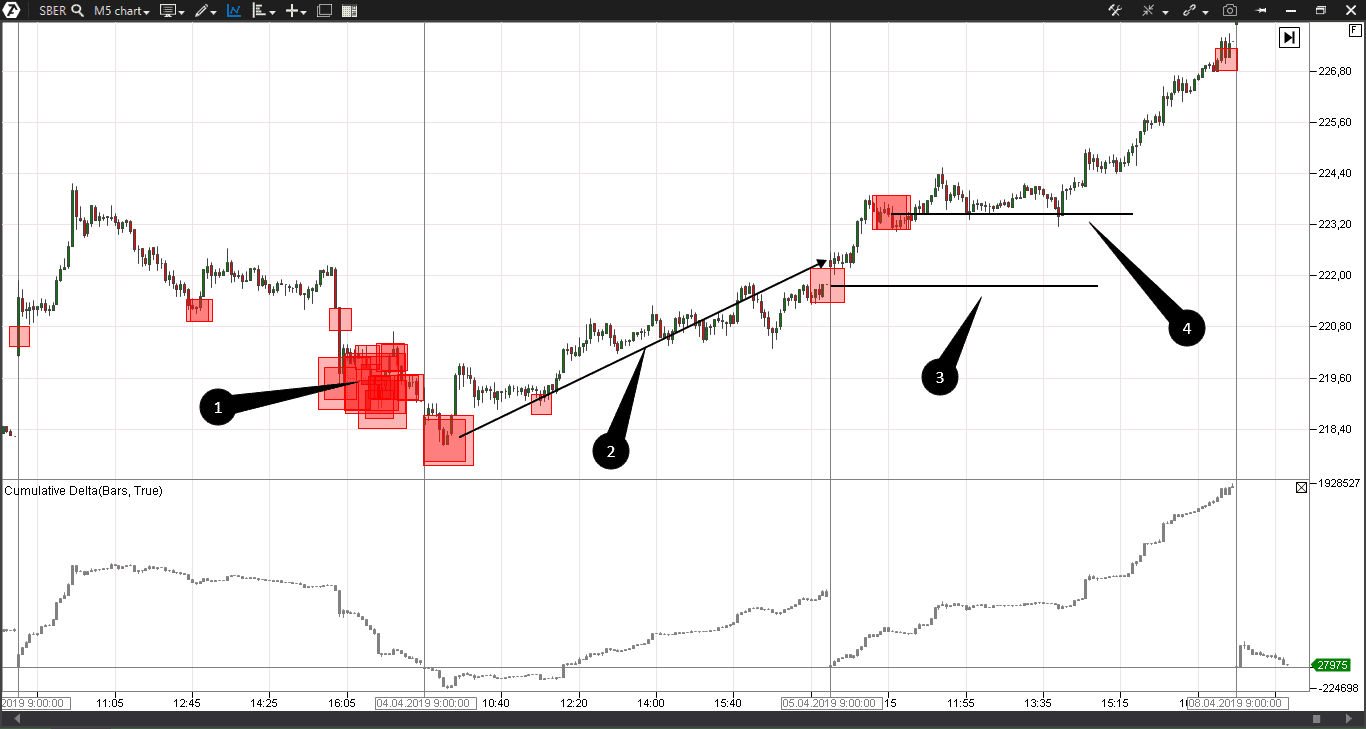
We use the 5-minute chart and Cluster Search and Cumulative Delta indicators.
We can see very many red clusters (big aggressive sells), which tell us that these prices of the SberBank stock attract major traders , in point 1. Thus, we know the place where sellers became active and now we need to see the price reaction on the following day.
To do this we monitor the price quotes in point 2 and see increase on the following day. Also, buyers predominated that day. It can be seen from the growth of the Cumulative Delta Indicator bars during the day with mark 2.
Now we have more information and understand that big sells, which should have pushed the price down, fell into a trap. They discovered the next day that they were blocked in loss-making positions without a chance to exit without losses. A price quote reader just has to find a right place for opening buys.
Big clusters of aggressive sells are marked in points 3 and 4. But we know that sellers were entrapped and, most probably, there is still a buyer in the market. It means that these clusters can become support levels. The price didn’t come back to point 3, while the price touched the level at point 4 several times and continued to increase.
This is a bright example of a trap for sellers. We also showed how to apply the logic of price formation and monitoring the price reaction to actions of traders. This practice provides arguments when looking for a good place for opening buys with a low risk.
Another example of price quote reading – Gazprom stock.
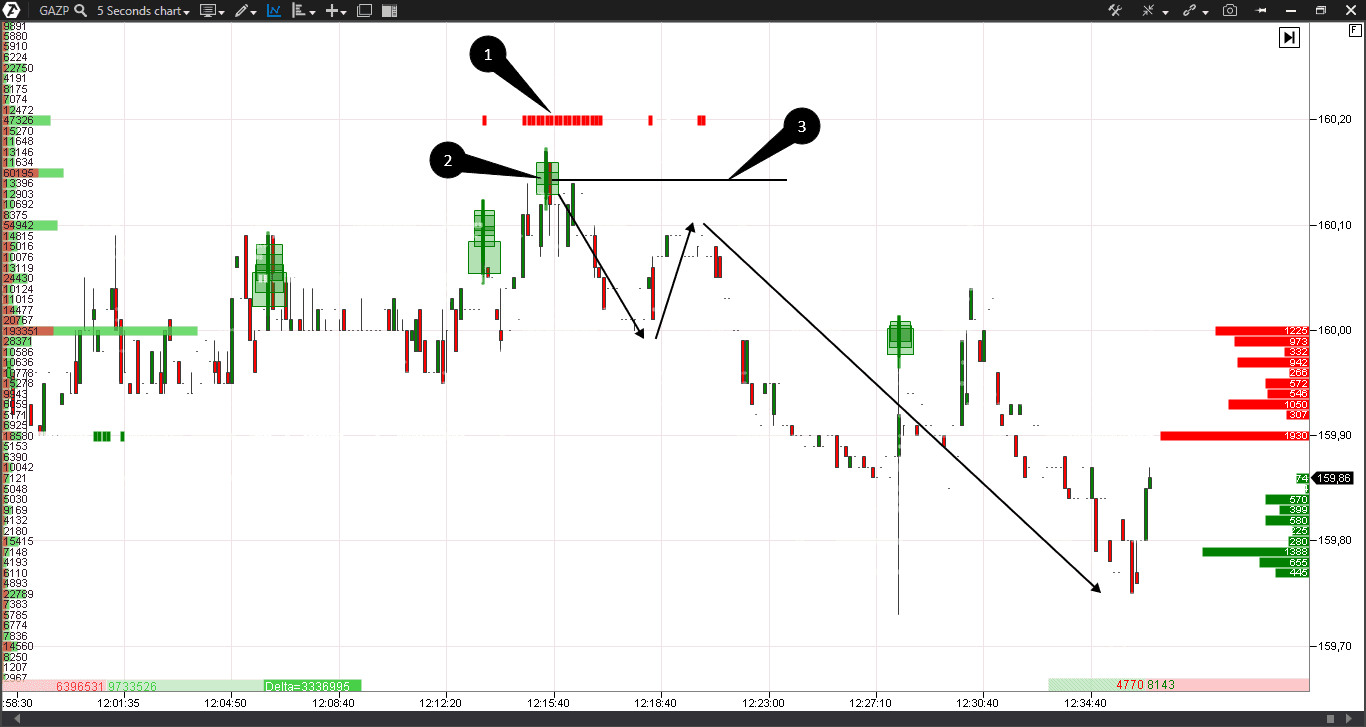
Let us take the ultra-fast 5-second timeframe and monitor intraday actions of buyers and sellers.
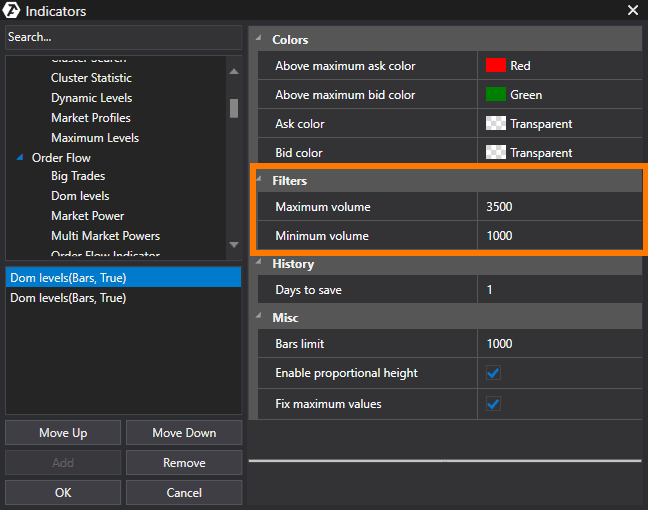
Point 1 marks a big accumulation of limit sell orders with the help of the DOM Levels Indicator. The picture below shows settings, which we used for Gazprom stock.
Big levels are marked red and they (by their nature) should stop the price movement. We do not know for sure whether these sell orders would be executed, since limit orders could be withdrawn.
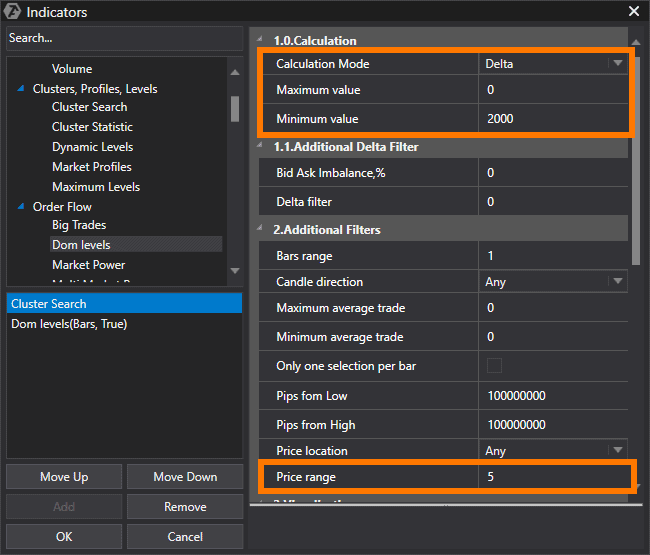
Nevertheless, time will show whether this is a manipulation or no, and we can monitor actions of buyers during testing this red level. To do this we will use Cluster Search, which marks aggressive buys with green squares. Indicator settings are under this text.
The price starts to approach the seller’s red level in point 2. We marked this level with a black line in point 3. We do not see a level breakout after the cluster’s exit. Instead, the buyer stops holding the price quote and the down movement starts. Having combined all these factors, we can make the following conclusions:
- the seller didn’t remove limit sell orders during testing, since the level didn’t disappear from the chart;
- the buyer’s effort to break this level was unsuccessful;
- the price reaction showed us that the buyer stopped controlling the price quote in the short-term perspective.
These factors are a strong basis to assume that the seller is really in the market and might take the price quote under his control in the short-term perspective. As a result, we see a continued decrease. It is not a bad opportunity for an intraday trader to use the situation in his own favor.
Summary.
Drawing up a conclusion, we would like to underline importance of the buyers and sellers volume analysis and the market background analysis. By and large, the standard logic, combined with the ATAS market analysis instruments, can give a trader a vitally important advantage over other traders, who use outdated information from indicators, based on the price historical data.

