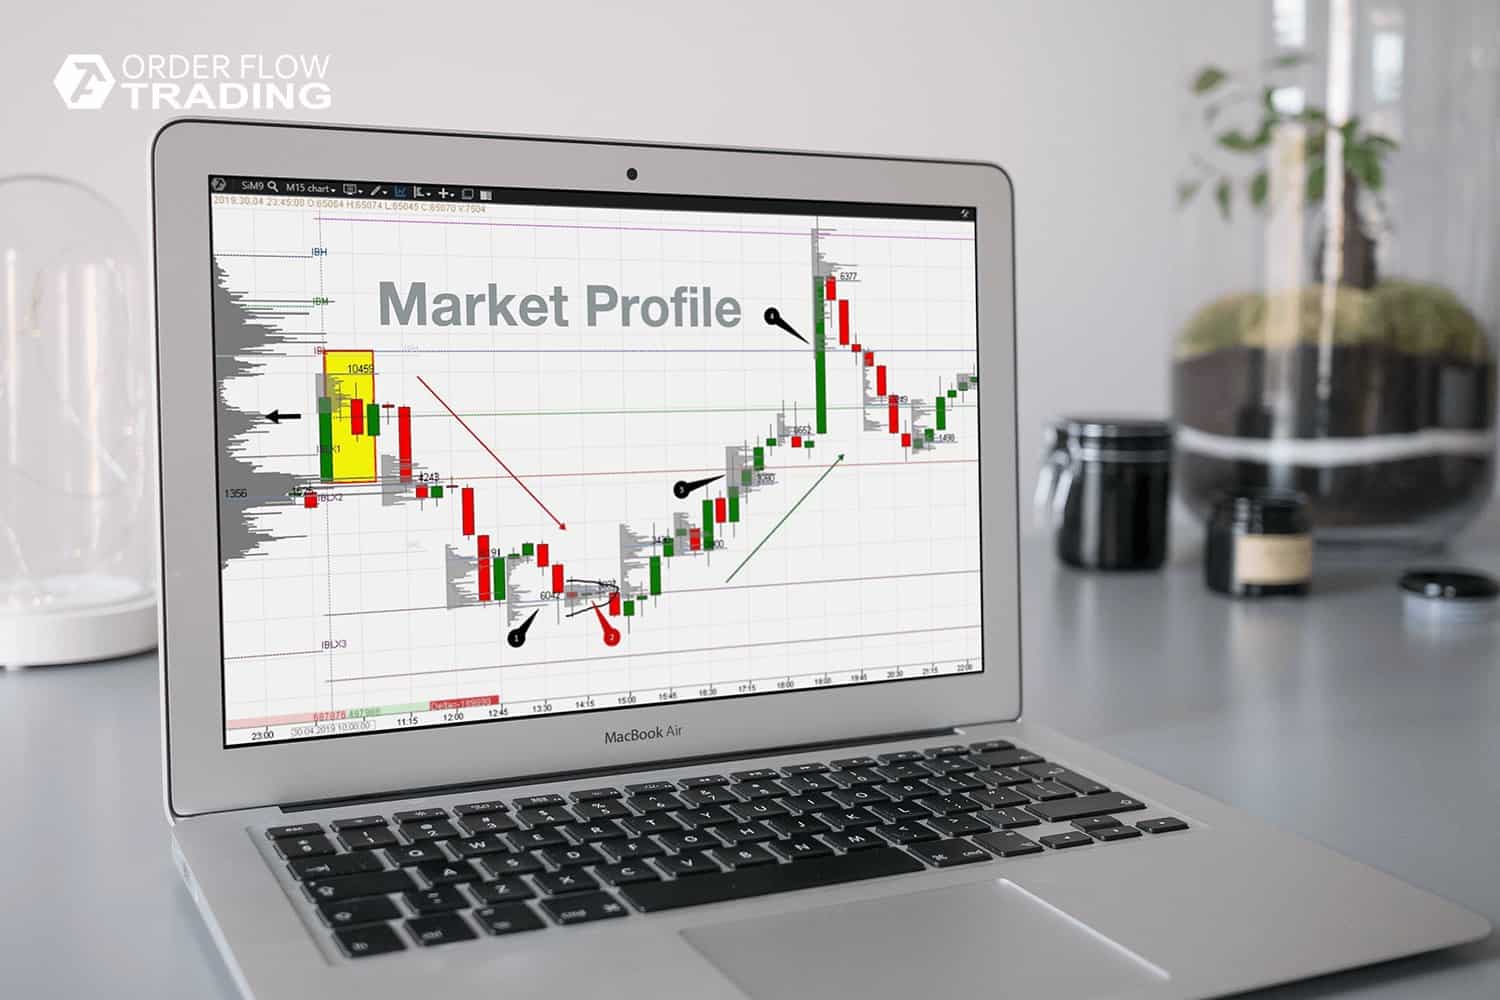
More advanced information goes below. We assume that you know already what Value Area (VA), Point Of Control (POC) and Initial Balance (IB) are. And we will speak about how to increase trading efficiency using the Market Profile.
In this article we will discuss research of a Czech specialist Jan Firich. He concentrated on those stock markets, where first price movements after beginning of a trading session play important role (IB – Initial Balances). It might seem that significance of these research vanishes due to the fact that many traders prefer to work with futures. And the modern forward markets with abundance of non-stop robots do not have clear session divisions, since they are closed on weekends only. Nevertheless, we consider the below material useful. First, knowledge doesn’t hurt. Second, forward markets have regular clear splashes of activity, synchronized with opening spot markets of underlying assets. And those who trade futures may consider such splashes (as, for example, ES at 16:30 Moscow Time) as beginnings of sessions. You can also take the count of IB from the moments of news broadcast, when buyers and sellers start to look for a new fair level.
Read today:
- What the Market Profile is;
- How the Market Profile is used in trading;
- Improvement of trading using IB;
- Types of days – statistics and form of distribution;
- Improvement of trading using VA and POC;
- The 80/20 rule;
- Composite Market Profile;
- Let’s get all improvements together;
- Conclusions.
What the Market Profile is.
We will briefly remind you what the Market Profile is and who its author is.Market Profile is a graphical display of the volume distribution at each price level. The founder of the Market Profile is Peter Steidlmayer. He was the first to introduce the Market Profile to the Chicago Board Of Trade (CBOT) traders in 1985. The technical analysis had had only the volume per time unit before Steidlmayer.
Let us explain the Market Profile concept using simple words. There is a struggle between buyers and sellers in the market every day. Buyers want to buy low and sellers want to sell high. The price moves up and down or (according to Steidlmayer) is distributed in search for the fair price, which satisfies both buyers and sellers.
When the market reaches the fair price or (according to Steidlmayer) balance, the graphical Market Profile forms a bell shape. Stages go one after another and the trend price movements of various duration and strength start from the balance area.
The Market Profile helps a trader to see in what stage the market is – balance (flat) or distribution (trend) – at any point of time.
How the Market Profile is used in trading.
Different sources specify two types of trades based on the Market Profile:- Proactive – a break of the previous balance area in search for a new fair price;
- Responsive – a return to the fair price area from unreasonably low or high prices.
Let us consider an example using the 4-hour E-mini Euro futures (E7M9) chart.
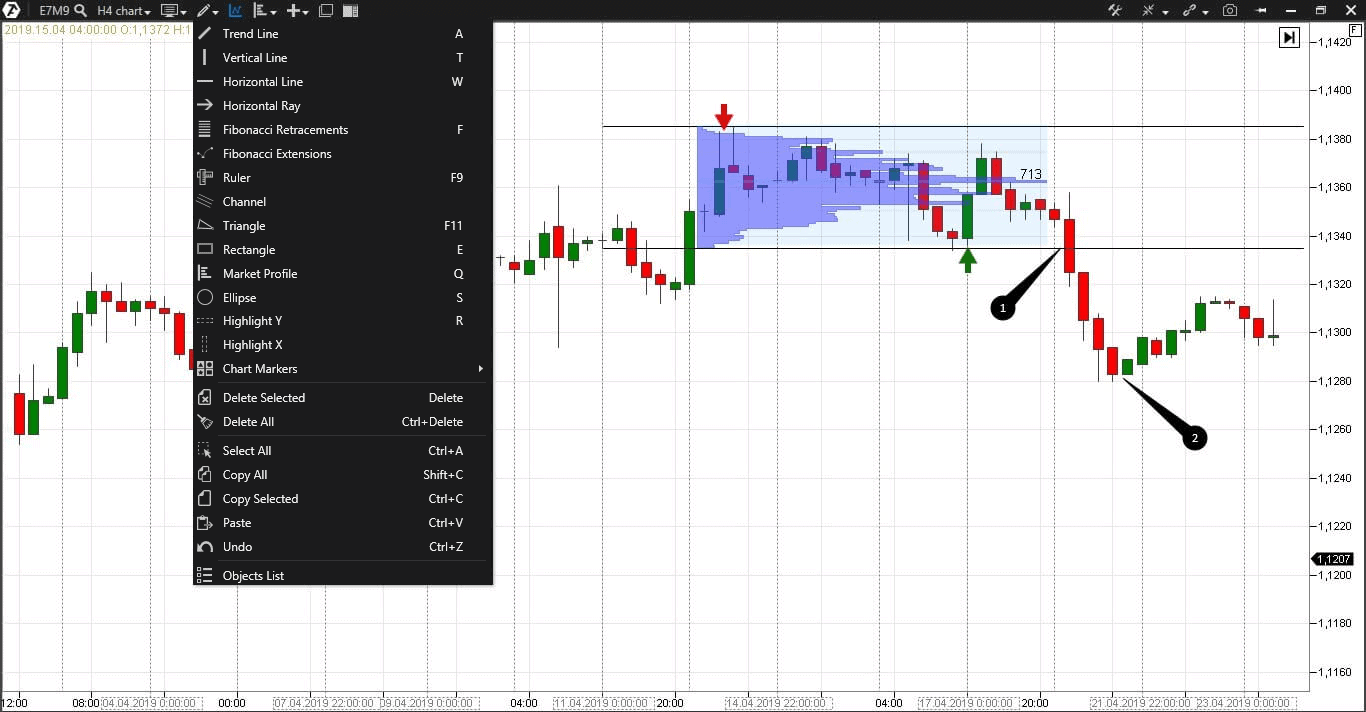
Trade responsive trades from the range boundary (red and green arrows), while the balance is formed and the price moves within a narrow range up and down. Note that we marked only those places with arrows, where the price touched the 70% edges of the already formed balance area.
Trade proactive trades or breakout as soon as the balance area is formed, as it is in our example. Since the price was compressed as a spring for a long time and is ready to sharply stretch. Breakout takes place when the market learns about some new factor, which influences the instrument price, and starts searching for a new fair price.
From the visual point of view, it is easier to detect the already formed balance areas. The breakout in our example took place in point 1. You can open this trade with a limit order from the boundary of the support level, marked with a black line. It is difficult to calculate the take profit by proactive trades beforehand. There are two possible variants of closing such trades:
- to register the profit in point 2, where the focused downward movement temporarily stops;
- to move the stop into the breakeven and wait for a new balance area formation, in which to close the trade. This is a more risky way, since it can leave you in the breakeven, but can bring you a bigger, than in the first case, profit.
Proactive and responsive trades are standard trading methods which use the Market Profile. Let us try to improve them and increase probability of making profit.
Improvement of trading using IB.
Initial Balance (IB) is the price movement during two first time intervals of the current trading session. Steidlmayer considered a day chart, consisting of 30-minute candles. IB for such a chart is two first candles or the first trading hour. This logic was correct when when trading on CME was trading in a pit within a set timeframe. Impulse trades were frequent during the first hour and traders often got into traps. Nowadays, the global markets trade 24 hours a day and trades of the first trading hour do not have such a significance. You can select beginning of a trading session in the IB indicator of the ATAS platform depending on a market activity.
Jan Firich published an article in 2012, in which he analyzed breakouts of the Initial Balance area and interaction of various types of trading days on the basis of historical data of American exchanges. We will speak about trading days in the next section. Now we will discuss statistics of the breakout of the Initial Balance area.
The table below shows calculations of a probability of breakouts of the Initial Balance area of today depending on whether there was a breakout of this area yesterday. Jan Firich does not specify in his research what futures contracts he considered and what he took as a beginning of a trading session.
| No IB breakout (today) | IB breakout (today) | |
| No IB breakout (yesterday) | 19,87% | 73,72% |
| IB breakout (yesterday) | 8,14% | 78,34% |
If these data are correct, the price breaks the Initial Balance area in the majority of cases. If a breakout was the day before, the probability of a today’s breakout increases to nearly 80%. Jan Firich does not give a clear definition of the breakout area of the Initial Balance. He recommends to watch attentively and use this statistics in trading based on your experience.
Let us use the Initial Balance indicator in the trading and analytical ATAS platform. We marked Initial Balance areas of each day with red rectangles with the help of the indicator in the 30-minute E-mini S&P 500 futures (ESM9) chart. Note that an E-mini S&P 500 futures is traded globally and it is difficult to apply the classical concept of the Initial Balance area to it. We did it just as an experiment.
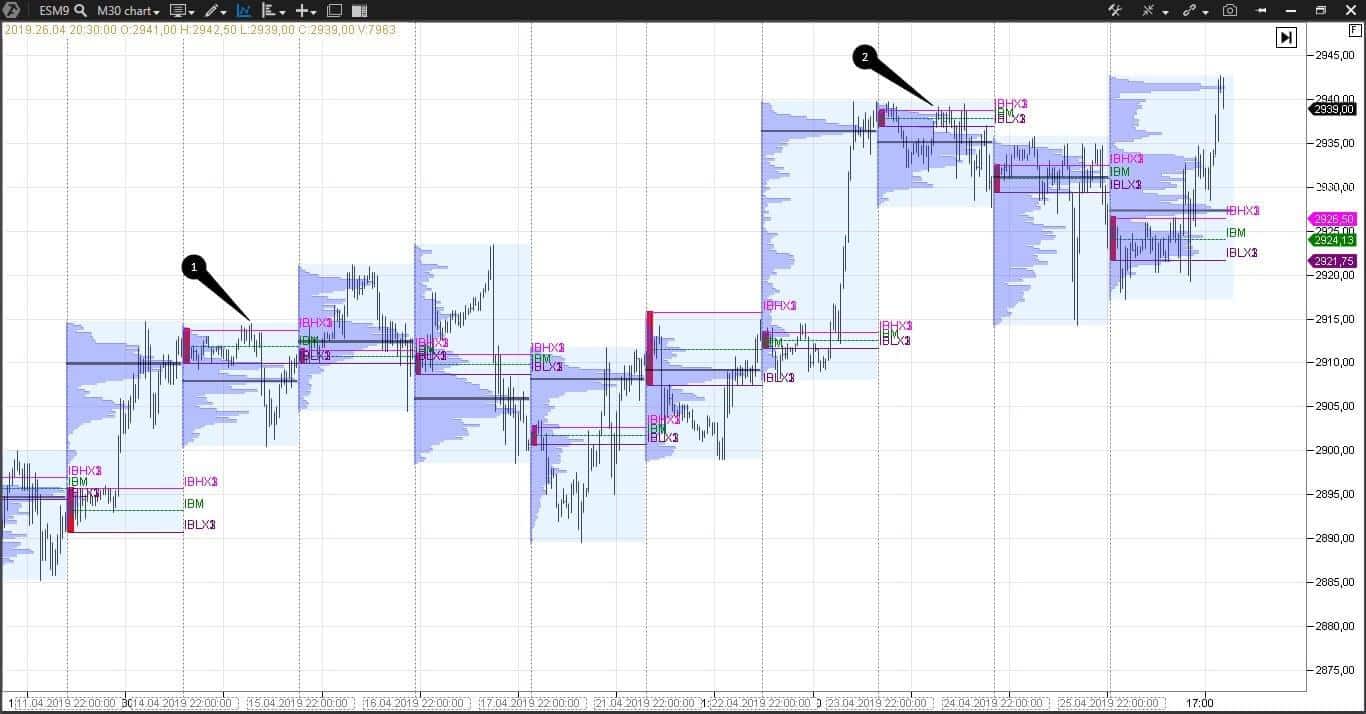
Indicator settings allow selection of the time of beginning a trading session independently, which is important for futures that are traded nearly round the clock but with various intensity. If you are a follower of the classical Market Profile theory, leave automatic settings of the beginning of a regular session.
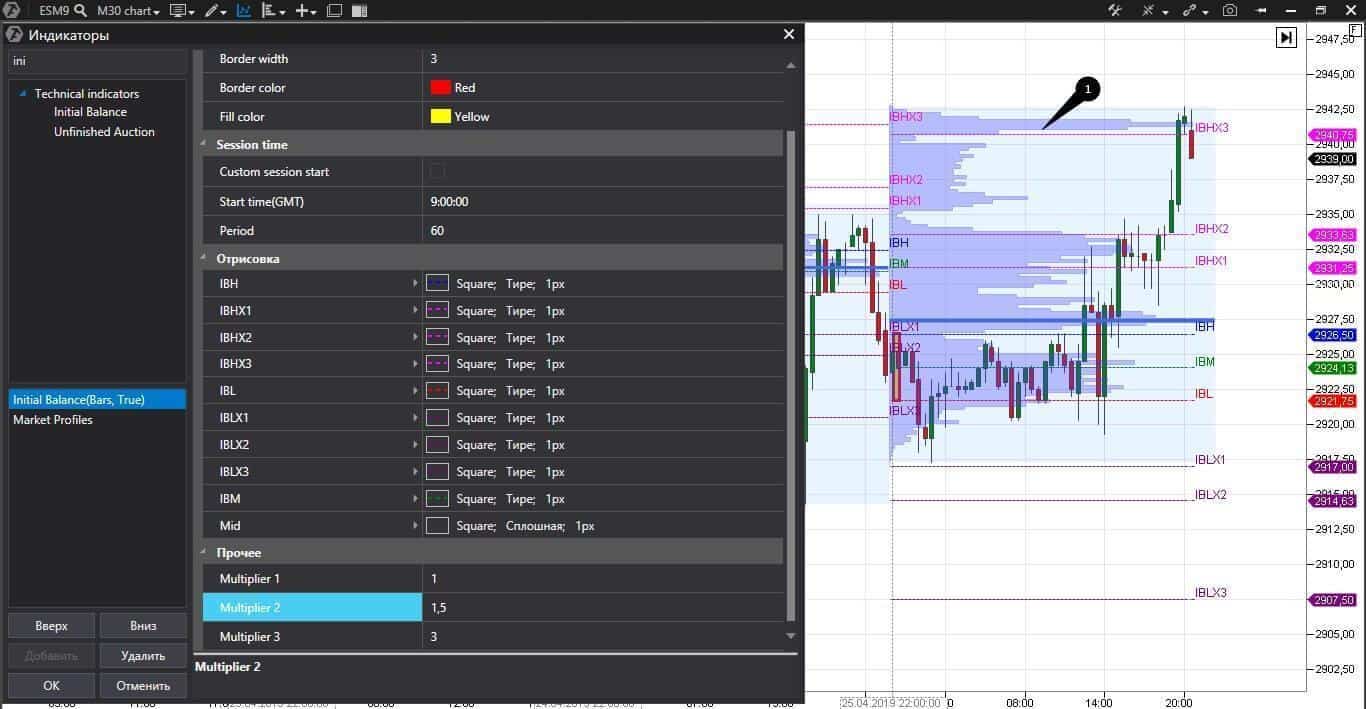
The Initial Balance indicator gives traders one more visual advantage – it shows adjustable levels of excess of the Initial Balance area.
For example, we adjusted the 1, 1.5 and 3 coefficients in the following chart. Thus, the level of Initial Balance High X3 and Initial Balance Low X3 is three times wider than the Initial Balance area.
Types of days - statistics and form of distribution.
Peter Steidlmayer specified 5 types of days:- non-trend day. Initial Balance practically does not expand and the price is traded in a narrow range;
- normal day. The price moves within 50% from the Initial Balance area;
- trend day. The Initial Balance area is small and the price movement exceeds the Initial Balance area more than in three times. The price closes near the reached high or low;
- neutral day. The price expands the initial range both up and down, but insignificantly;
- normal variation day. The price movement exceeds the Initial Balance area approximately in two times on such days.
| Day type | Occurrence |
| Non-trend day | 6,81% |
| Normal day | 2,43% |
| Normal variation day | 22,39% |
| Trend day | 9,54% |
| Neutral day | 30,21% |
| Total | 71,38% |
| Day type | Occurrence |
| Non-trend day | 6,81% |
| Normal day | 2,43% |
| Normal variation day, which exceeds the Initial Balance area in 1.5 times | 41.77% |
| Trend day | 9,54% |
| Neutral day | 30,21% |
| Total | 90.76% |
We know that the price usually breaks the Initial Balance area and calculated that the normal, trend and normal variation days take 81.52% of all trading days. The price movements exceed the Initial Balance area in 0.5-3 times on the above-listed days. This information helps us to calculate automatically the take profit level with the help of the IB indicator and close the position in parts or, on the contrary, accumulate it, if trend or normal variation days develop.
Many traders would prefer to forecast the tomorrow’s day type on the basis of today’s day type. Is it possible?
For example, we identified a normal variation day, the most frequent type in the markets, with the help of the IB indicator. Let us assume that statistics tells us that a trend day will be tomorrow with a probability of 80%. It could be a huge competitive advantage, since we just need to identify the trade direction and ride the gravy train. However, unfortunately, calculations of Jan Firich do not confirm interconnection of various types of trading days.
| Normal variation day (today) | Trend day (today) | Neutral day (today) | |
| Normal variation day (yesterday) | 39,72% | 9,50% | 30,50% |
| Trend day (yesterday) | 38,51% | 9,94% | 34,16% |
| Neutral day (yesterday) | 43,92% | 10,39% | 31,96% |
The American stock market statistics shows that a probability of occurrence of a specific day type is always less than 50%. This does not allow us blind posting of limit orders in expectation of profit. Maybe other instruments and markets will give us different statistics, since there are no certainty and guarantees in trading.
Improvement of trading using VA and POC.
In this section we will speak about Value Area (VA) and Point Of Control (POC). We hope that you read the introductory article about the Market Profile and understand what VA and POC areValue Area can look in different ways:
- bell-shape – the market is in balance;
- positive (p-) shape – the price and volume move up;
- negative (b-) shape – the price and volume move down.
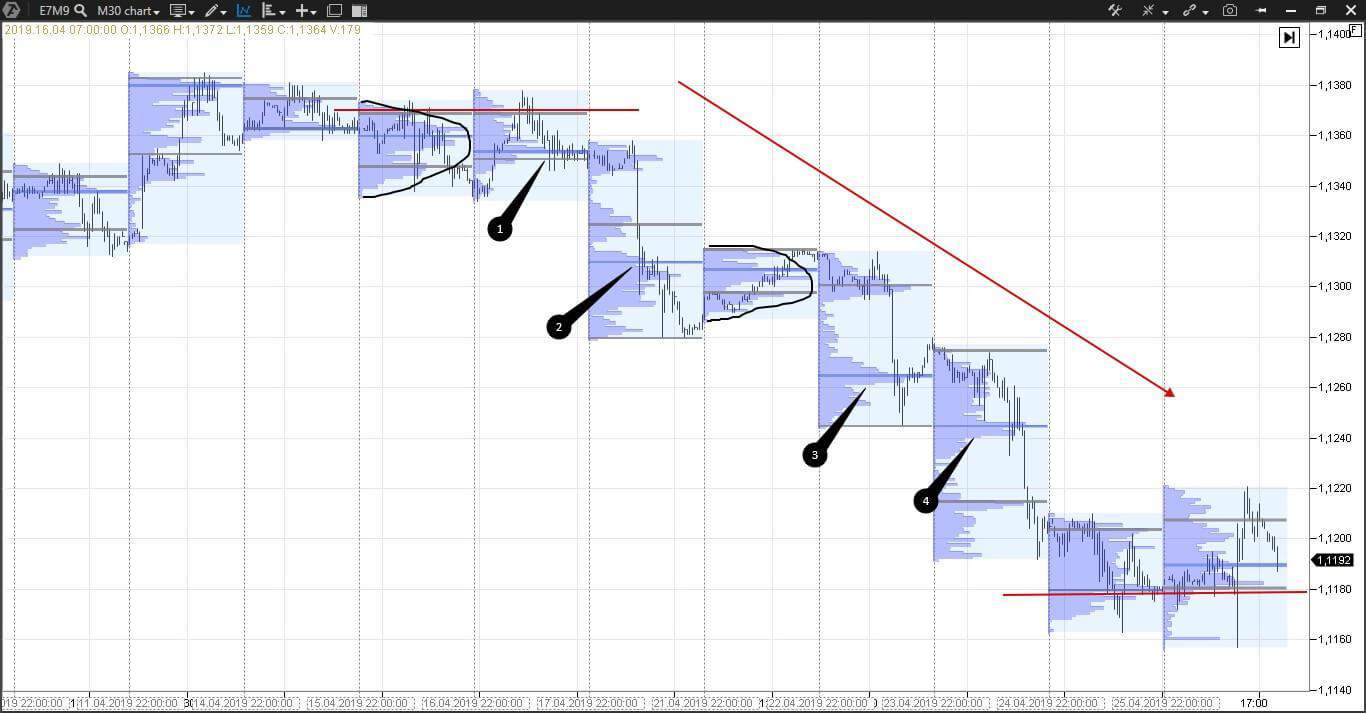
Do you remember that the price stops and strikes a balance after a focused or trend movement? That is, if you see b- or p- shapes of the Market Profile, you should expect the bell shape or balance after them. These are not strict rules – just general observations of how the auction trading occurs.
Pay attention to how Value Areas of neighbouring days interact with each other:
- Opening above the previous day VA – bullish sign;
- Opening below the previous day VA – bearish sign;
- Opening within the previous day VA – the price moves within a range.
The POC maximum volume level, as a rule, also moves along the trend. Coincidence of several POC levels forms strong resistance or support levels.
Example of trend movement in the 30-minute E-mini Euro futures (E7M9) chart.
Let us consider one more market. Example of movement within a range in the 30-minute E-mini S&P 500 futures (ESM9) chart.
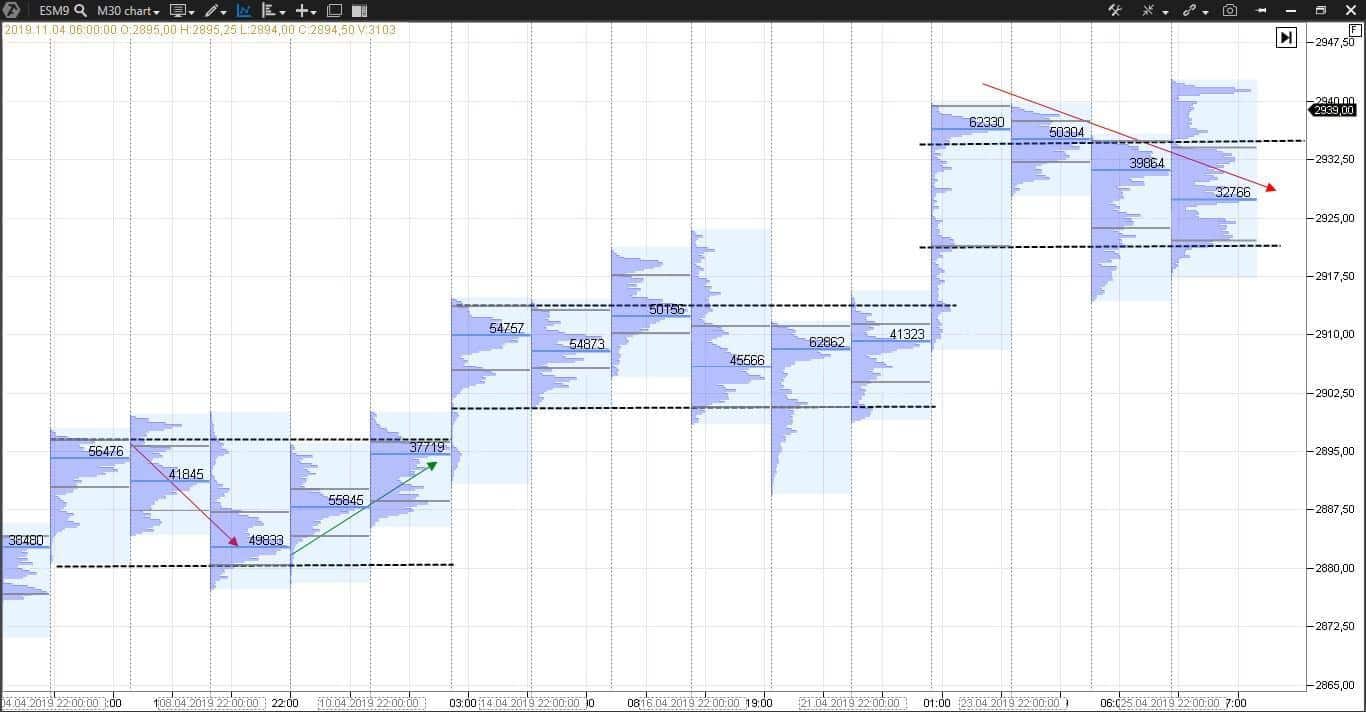
We purposefully removed prices from this chart and left profiles of each trading day only. We marked coincident range boundaries with black dashed lines and POC level movement with red and green arrows.
Pay more attention to VA boundaries, when the price moves within a range, since they form strong levels of support and resistance.
Apart from the standard POC levels, there are also Virgin Point Of Control maximum volume levels, which were not reached again. You can work differently with these levels:
- the price often reverses after them;
- they serve as support and resistance levels;
- you can post stop losses and take profit on them.
Example of the 5-minute gold futures (GCM9) chart (what you need to know about a gold futures).
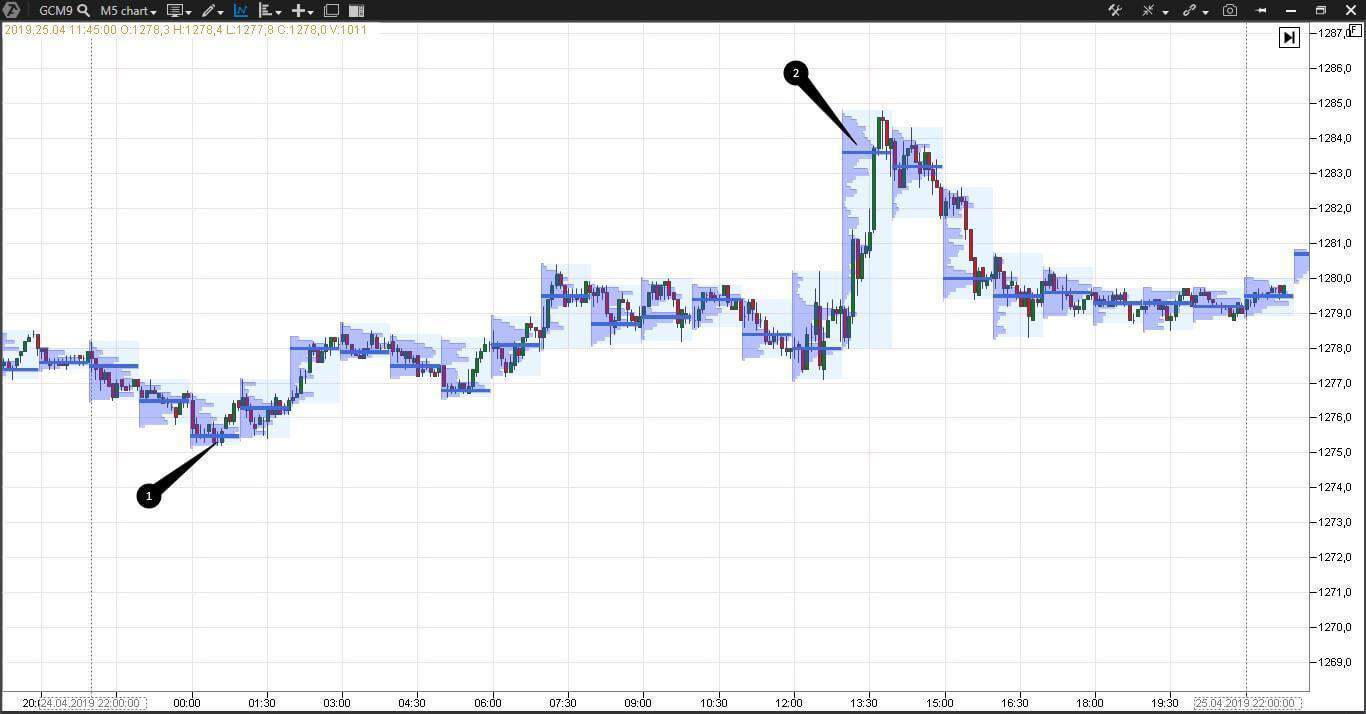
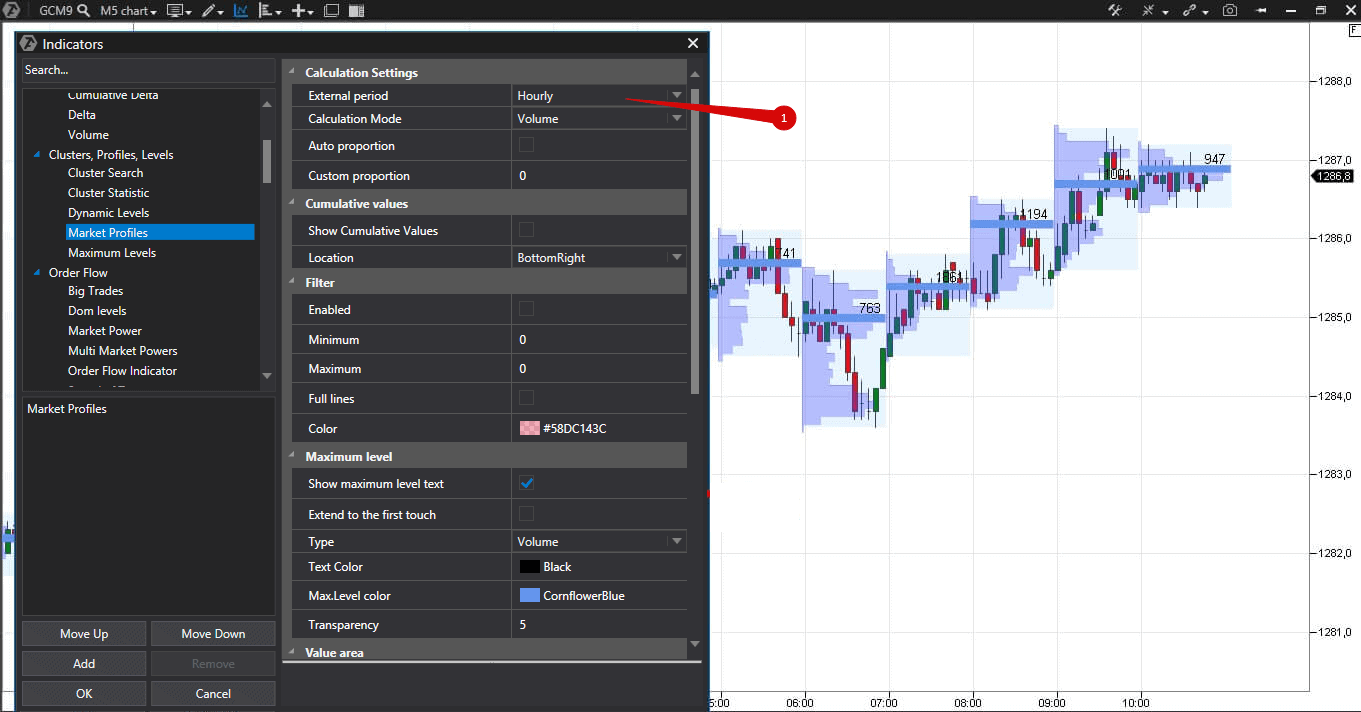
Points 1 and 2 mark the low and high Virgin Points of Control of the trading session. Note that both times the price reverses after these levels. This chart is also interesting due to the Market Profile indicator settings. This time we broke away from Steidlmayer and use the hourly profile and 5-minute bars, which helps us to see the day development with a much better dynamic pattern.
The 80/20 rule.
The Pareto Principle states that 80% of the effects come from 20% of the causes. It is an empirical rule, that is, it describes complex and non-uniform processes in very general terms. The proportion could be different and the rule itself is used in various fields. For example, 20% of clients bring 80% of profit in business.
Traders could not have passed by this rule and James Dalton (the author of the Mind Over Markets book) offered the following version of the rule, which has to do with the Market Profile.
If the opening price is above or below the previous day VA, but then comes back to VA and trades within the Value Area during two consecutive bars, the price will pass the whole Value Area of the previous day with a probability of 80%.
It sounds complex when we read it, but it looks easy when we consider a visual example. We take the 30-minute E-mini Euro futures (E7M9) chart.
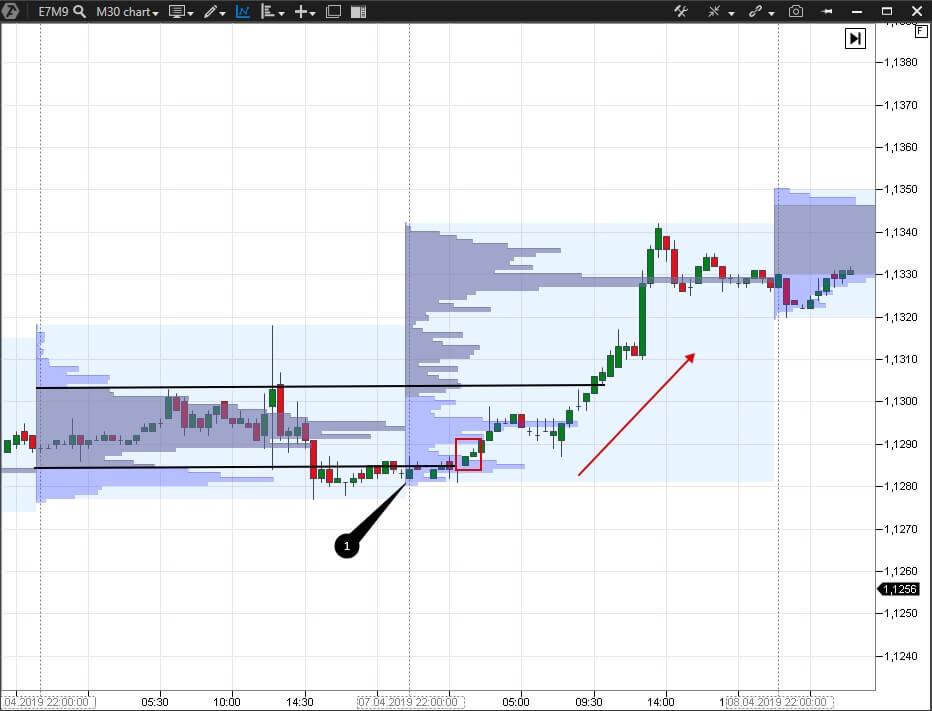
Most certainly, the 80/20 rule could be applied in other trading areas, just noone has done it yet. Have ideas? Share your ideas in comments.
Composite Market Profile and its advantages.
ATAS provides wide opportunities for working with various Market Profiles simultaneously.
Composite market profile is an aggregate profile from several marked days. Apart from the preset current day, previous day, previous week and some other variants in the upper menu, you can select any period of time directly in the chart and to see the profile of this period to the left.
The composite profile shows support and resistance areas and general state of the market. Here we have the 30-minute RTS index futures (RIM9) chart.
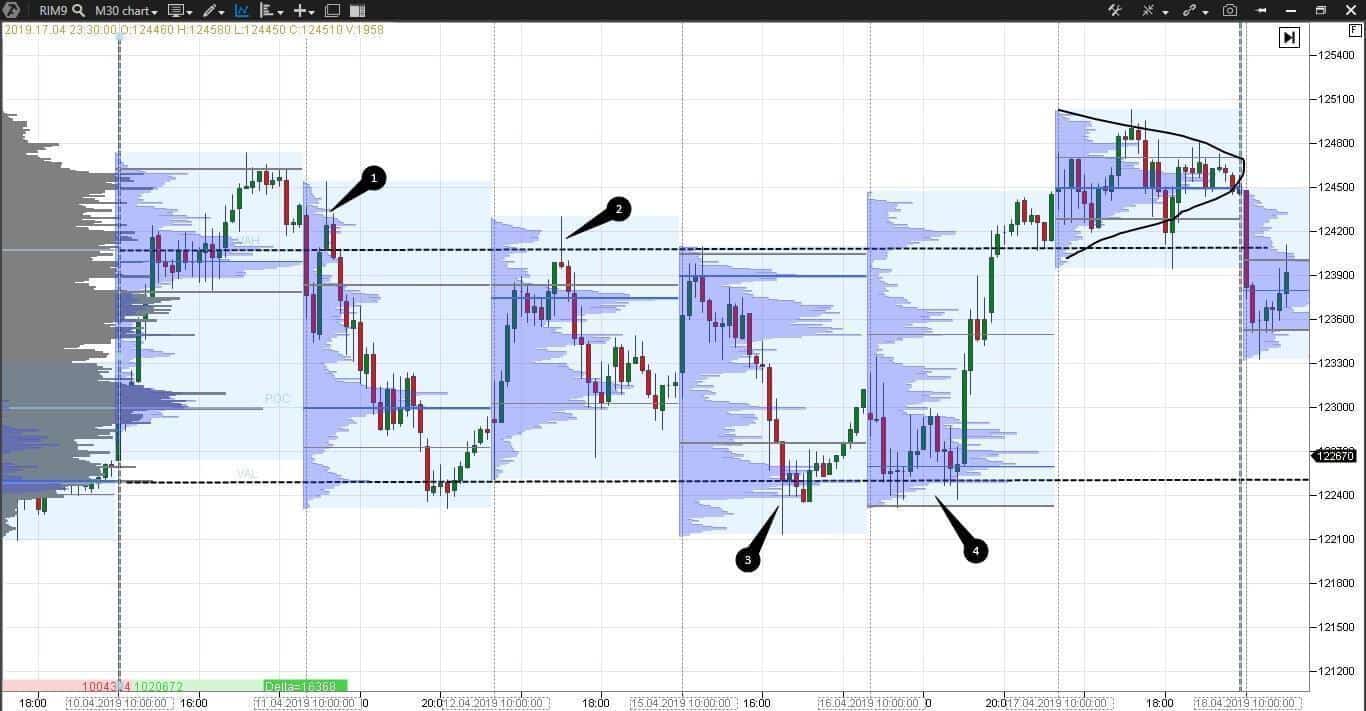
We selected 6 days to see their composite profile. We marked them with vertical dashed lines for better view. We marked the upper and lower boundaries of the Value Area (they are support and resistance levels) with horizontal dashed lines. Note how the price moves within the range – we marked candlestick tails, which show the struggle between buyers and sellers, with black dots. The market came to a balance above the upper VA boundary, which is confirmed by a bell-shaped distribution, after which the price moved back to the range.
Composite Market Profile provides us with a more global view and allows assessing long timeframes.
Let’s get all improvements together.
Thank you for reading this article. We have had long and sometimes boring explanations, so, let’s get all improvements together.
For the intraday trading we considered:
- breakout of the Initial Balance area;
- reversals at the Virgin Point Of Control levels;
- the 80/20 rule;
- VA and POC movement;
and for the positional trading we also added
- composite Market Profile.
Let us consider how to use these improvements in the 15-minute USD/RUB exchange rate futures (SiM9) chart.
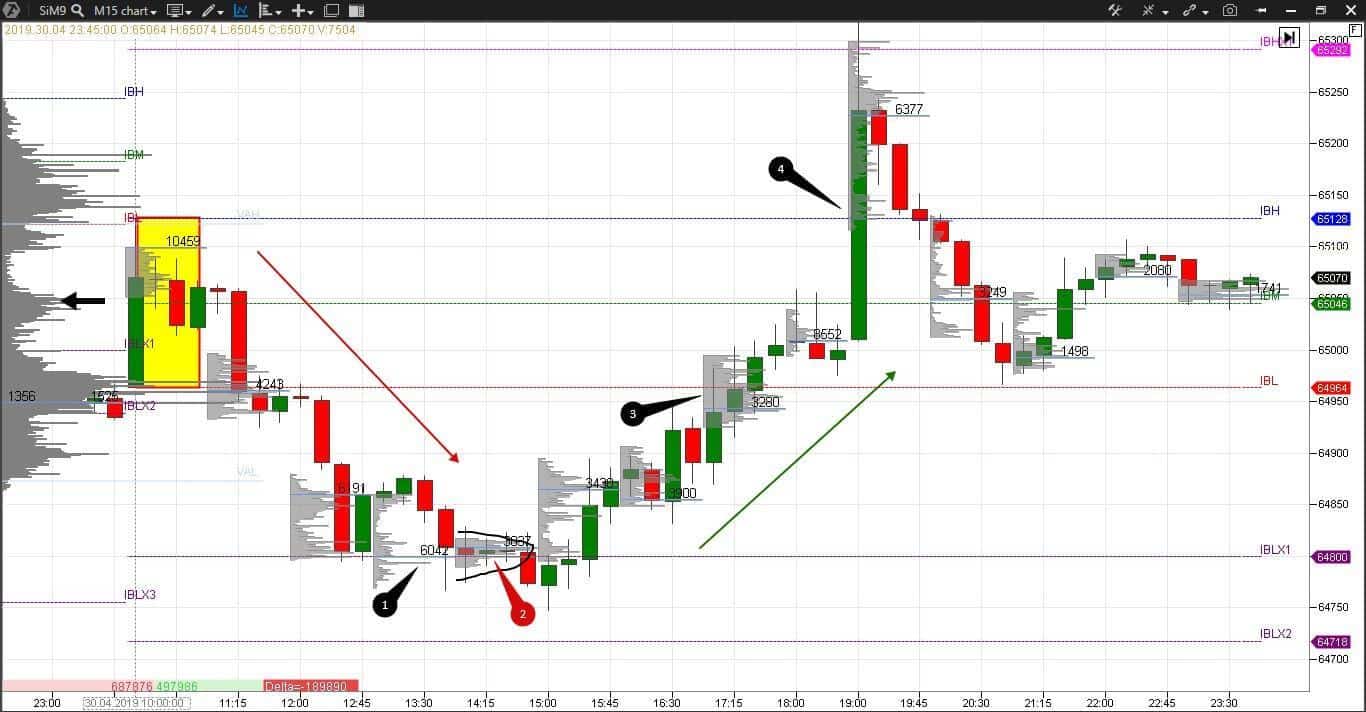
- Initial Balance with 1, 1.5 and 3 area settings;
- Market Profiles with settings of display of the hourly VA and POC level only.
Opening of a trading session was within the previous day VA. It gives us nothing as a reference point. We will wait for formation of the Initial Balance area and possible breakout.
POC of the first trading hour is on the very top of VA, which resembles letter ‘p’: these are bullish signs. But the first two candles of the second hour simply destroy the price increase plans and the breakout of the upper boundary of the Initial Balance area is cancelled at this point of time.
Value Area of the second trading hour is much lower than the Value Area of the first hour – it is a bearish sign. We add here the trading outside the Initial Balance area and make a decision to open a short position immediately below the lower boundary of the Initial Balance area. We post the first take profit at the IBLX1 level, which is the Initial Balance area increased by itself, and post the second take profit at the IBLX2 level.
However, we have to close the trade earlier, since the balance area was formed, from which a new focused movement can start, which, in fact, starts. Points 1 and 2 mark the Virgin Point Of Control, from which a reversal occurred. We open a long position at the IBLX1 level with a limit order, posting a stop order one level lower – at the IBLX2 mark. VA and POC levels are increased consequently and the price enters the previous day VA again in point 3.
Do you remember the 80/20 rule? Two consequently closed candles increase the chances to trade the previous day VA completely. Now you can easily move the stop to the entry level or a bit higher. We post the take profit at the upper boundary of the previous day VA in point 4. In our case, the previous day VA boundaries practically coincide with the Initial Balance area boundaries, which is convenient since you do not have to calculate anything. The price reached our take profit and the trade is closed. Note that the price also reached the IBHX1 level, which means that we could have posted two take profits and close the position in parts as was the case with a short position.
Conclusions.
Market Profile is a professional instrument, which assesses the auction course. Exchange trading is just a two-sided auction of buyers and sellers, isn’t it? An analyst can assess dynamics of trading development both during a day and during long-term periods using various methods of building the Market Profile.
- Watch the breakout of the Initial Balance area attentively;
- Analyze who is on top – buyers or sellers – through monitoring VA and POC movements;
- Control possible reversals using the Virgin Point Of Control;
- Calculate take profit beforehand depending on what day develops;
- Use the 80/20 rule when the price comes back to the previous day VA.
We offer ideas and our analytical platform. You adjust these ideas to your trading strategy and increase your profit.
Have you liked the article? Press the like button.

