In this article:
- Why exchanges conceal big trades.
- Principle of display of big trades.
- The Big Trades Indicator settings.
- How to use the Big Trades Indicator in your trading.
- Examples. 4 useful tricks.
What managed money is
There is an opinion that the markets are driven by “managed money”, also known as string-pullers, professionals, insiders and composite operators. They have different names but the essence is the same.Managed money refers to major investors, banks, hedge funds, investment funds and financial management companies. It is considered to be managed since it has resources, both financial and human, which allow collecting and processing an impressive volume of data from open and closed sources and carrying out high quality analysis with the aim of receiving profit in the financial markets.
Managed money, as well as minor traders, carries out a similar activity on the same exchanges – it buys and sells stocks, bonds, futures and options. However, the volumes the managed money works with are much bigger than that of the retail traders. It is rather difficult for the managed money to conceal its presence, since they operate with significant positions. However, the managed money has a big desire to conceal its intentions in order to simplify its trading.
Why exchanges conceal big trades
Possibilities for analysis of the price quote flow expanded after introduction of online trading. A retail trader has access not only to a chart itself, but also to the Time and Sales Tape, on which he identifies presence of a major participant.An analyst might notice big trades at separate price levels on the tape. Recently, traders used to track emergence of such trades and used them as an indicator of a direction, in which it is worth opening a position.
It was assumed that an opened trade in harmony with the managed money has more chances to bring profit.
As it is known, different exchanges transmit the price quotes differently, some transmit ticks and passed volume only, some show bid and ask direction and volume. If an exchange transmits a trade direction, everything is rather simple. But if a transmission goes without specifying a trade type, the ATAS platform would identify a trade direction using a special algorithm. In any case, a user will have access to the tape with specification of their directions:
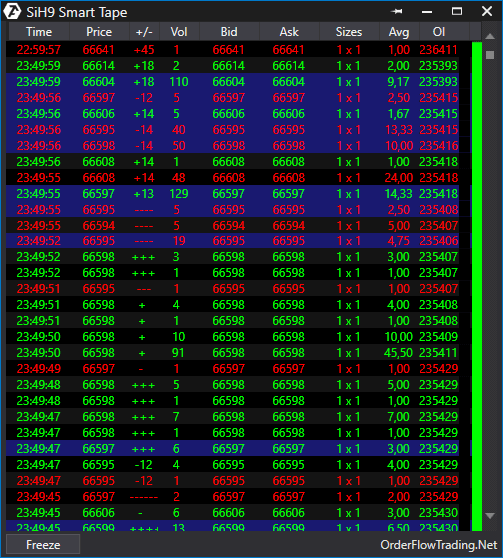
The FIX/FAST protocol had been used before the May of 2015. That protocol sent each message from the exchange as an individual packet. This was related to the order book, executed trades, price quotes, etc. It allowed noticing individual trades on the tape.
The new MDP 3.0 protocol collects the information sent by the exchange in packets of up to 1,420 bytes capacity. If a number of messages are ready to be sent simultaneously, they are put in one and the same packet. One message is not split into several packets. You can get acquainted with this innovation on the CME web-site.
Big trades display principle
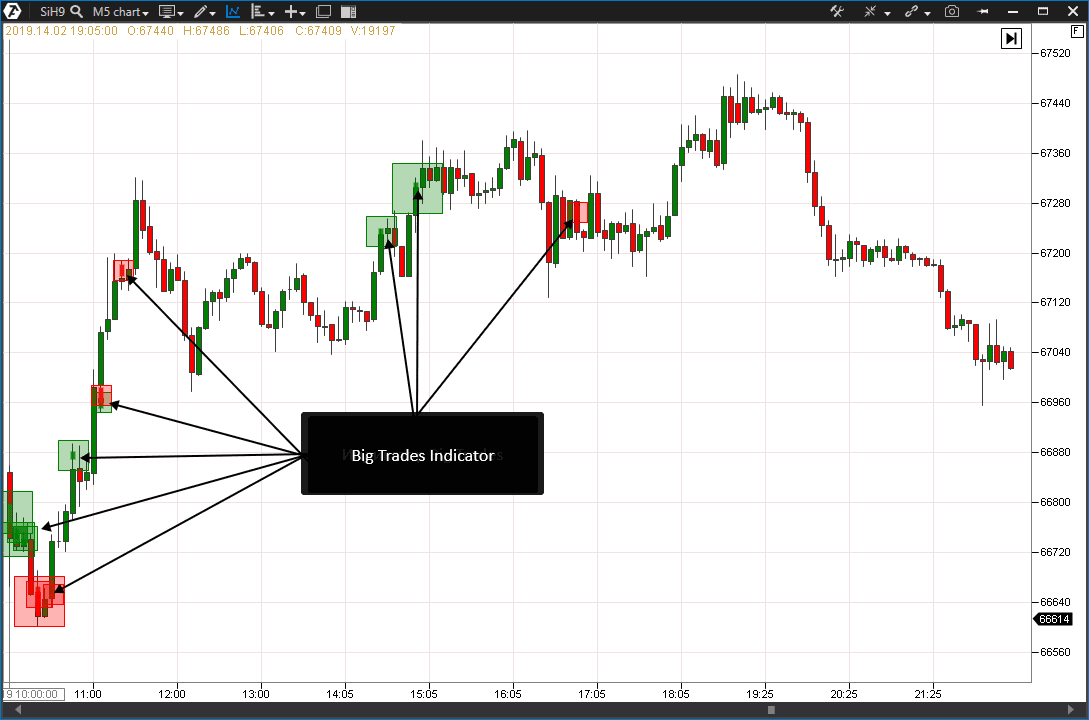
In order to assemble such trades back, a special algorithm is required. Namely this algorithm is in the basis of the Big Trades Indicator in the ATAS platform. This indicator sums up a big number of similar trades into one trade and transmits its signals to the chart in the form of a special mark.In the example below, the indicator marked all areas on a Si futures, where big trades took place, with colored squares. Green color marks the buys and the red one marks the sells.
The Big Trades Indicator settings
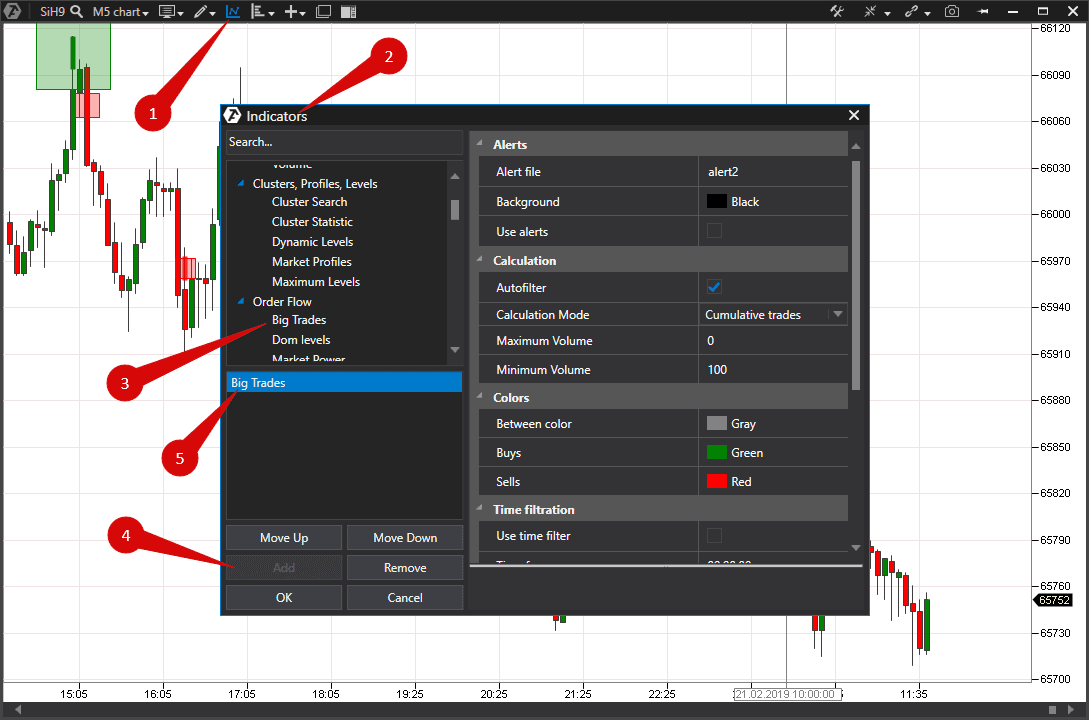
Let us consider the indicator settings:
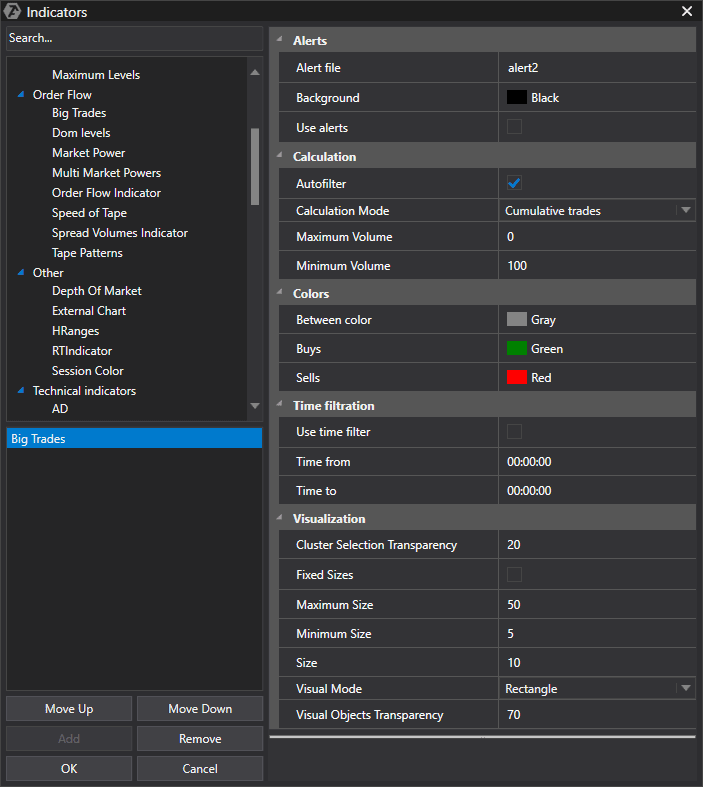
The Visualization section contains parameters of the indicator display in the chart. You can select sizes of display and pattern type:

In the Filtration by time section you can set time limits, within which it is preferable to display the indicator, there will be no indication outside these limits.
The Colors section allows setting display colors for the indicator.
How to use the Big Trades Indicator in your trading
Here comes the most interesting part. How to use this indicator in trading.To begin with, we do not know beforehand whether a major trader opens or closes his position. We have a specific price area at our disposal, which fixed a big initiative trade. That is why, an important task is an additional data collection for understanding what the intention of the managed money is.
- First, look how many price levels were covered by the Big Trade. If the price covered several price levels (the value could be from 2 to 20 and bigger for various instruments), we may state that the big trade did not meet any limit resistance and there were no icebergs or other interests in holding the price in the whole area.
- Second, it is necessary to note whether there was a limit volume in the specified section. The DOM Levels indicator, which fixes those areas in the chart where a big limit volume was noticed, will help us to do that. If a big trade met the limit resistance and was stopped by it, we can note that there is an opposing party.
- Third, note where the price moved after emergence of a big trade. If the price moved towards the trade, we should note absence of opposition. But if the price moved into a reversed phase, this, most probably, is a sign of a trap, in which the big trade fell. The market is full of such traps.
- Fourth, if your broker transmits an open interest, check whether the open interest value increased or decreased. The open interest value allows splitting big trades into position opening and position closing.
Four useful indicator tricks
Indicator tricks lie in a method of interpretation of big volumes in a chart. We will show four variants of interpretation. The described logic could be similarly applied to other instruments/timeframes.Example 1. A big sell trade covers several price levels and moves the price in its direction, while the open interest increases.
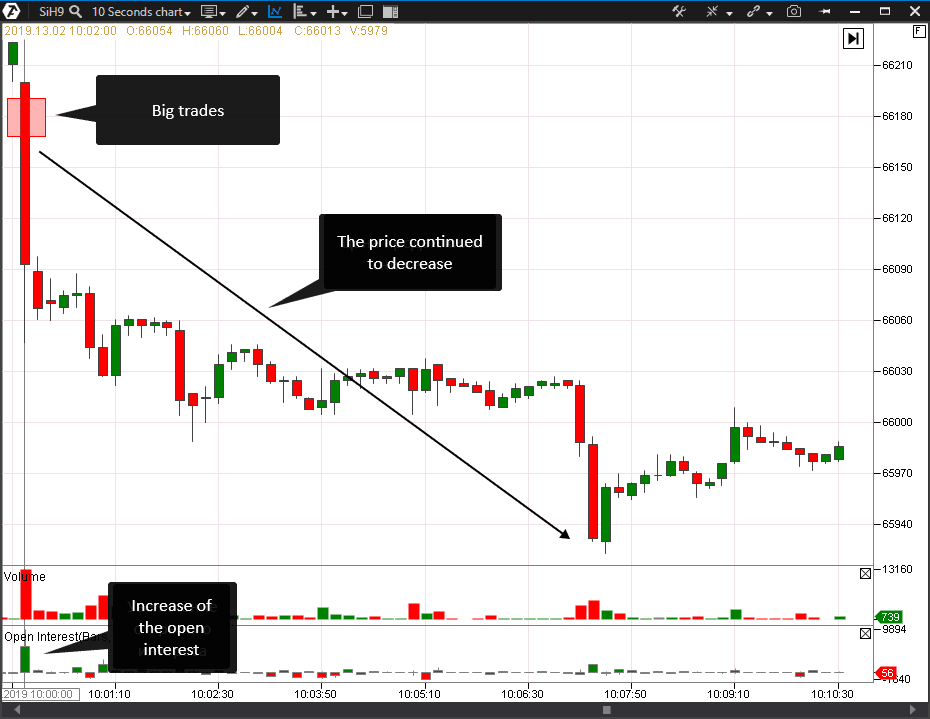
Conclusions: a major seller expects price decrease, opens a position and trading towards a big trade, most probably, will bring profit.
Example 2. A big buy trade opens a position, does not move the price in its direction or moves it slightly, however, the trend develops in the opposite direction.
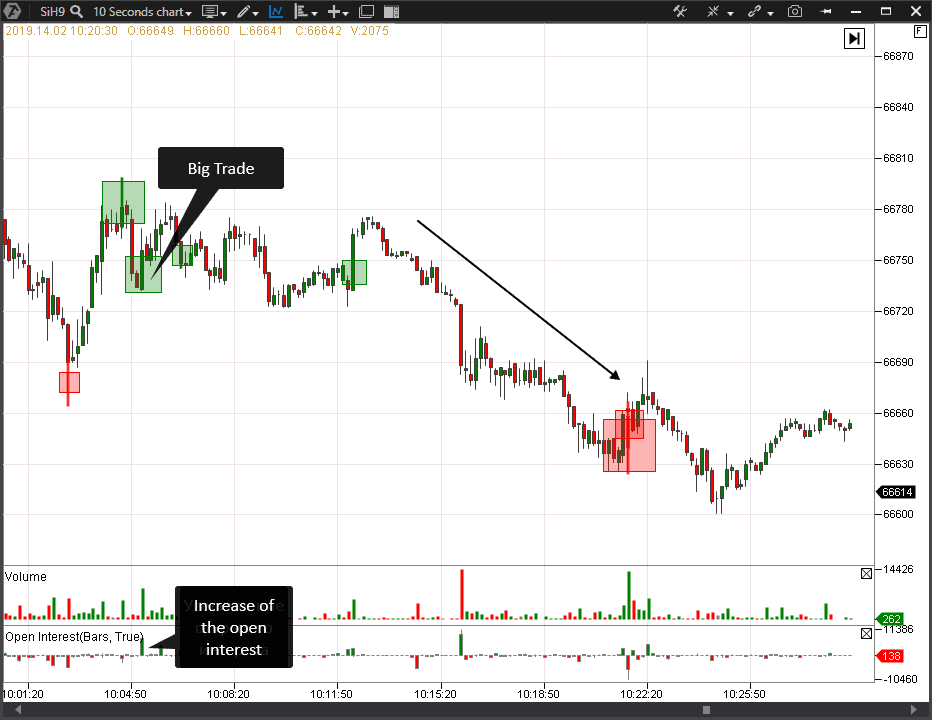
Conclusions: a buyer does not control the price and suffers losses, the trend will develop against the buyer and it is expedient to open a position in the opposite from the big trade direction.
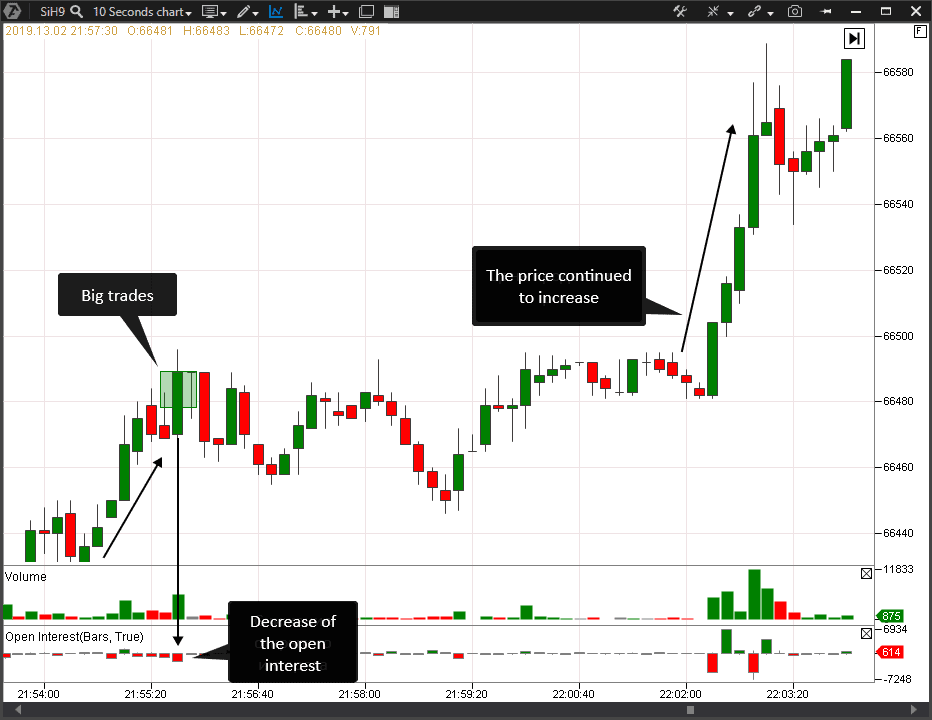
Example 3. An upward trend, a big buy trade covers the limit volume, the open interest decreases and the price moves further.
Example 4. A big sell trade covered several price levels, the price moved away from the level when the seller’s level was tested, the seller holds his positions.
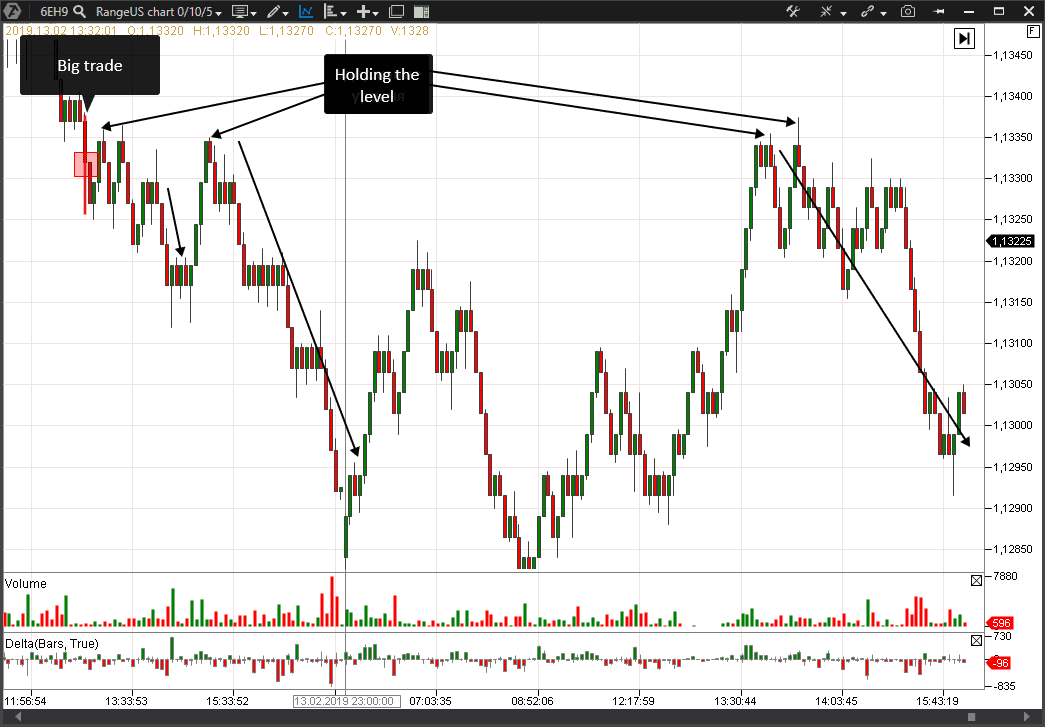
Conclusions: a major seller expects continuation of the price decrease and trades towards the big trade should be opened when testing the seller’s level.
Summary
We presented you several possible situations in the market and showed how interpretations of major players’ intentions could be formed with the use of the Big Trades Indicator. There are much more situations in real life. We recommend you to use the Big Trades Indicator together with such indicators of the volume analysis as Delta, Volume, Open Interest, Market Profiles and others, and also to assess capabilities of the RangeUS chart, which would remove the unnecessary market noise and would allow, in combination with the Big Trades Indicator, concentrating on important areas only.
Do not miss the next article on our blog. Subscribe to our YouTube channel, follow us on Facebook, Instagram, Telegram or X, where we publish the latest ATAS news. Share life hacks and seek advice from other traders in the Telegram group @ATAS_Discussions.
Information in this article cannot be perceived as a call for investing or buying/selling of any asset on the exchange. All situations, discussed in the article, are provided with the purpose of getting acquainted with the functionality and advantages of the ATAS platform.

