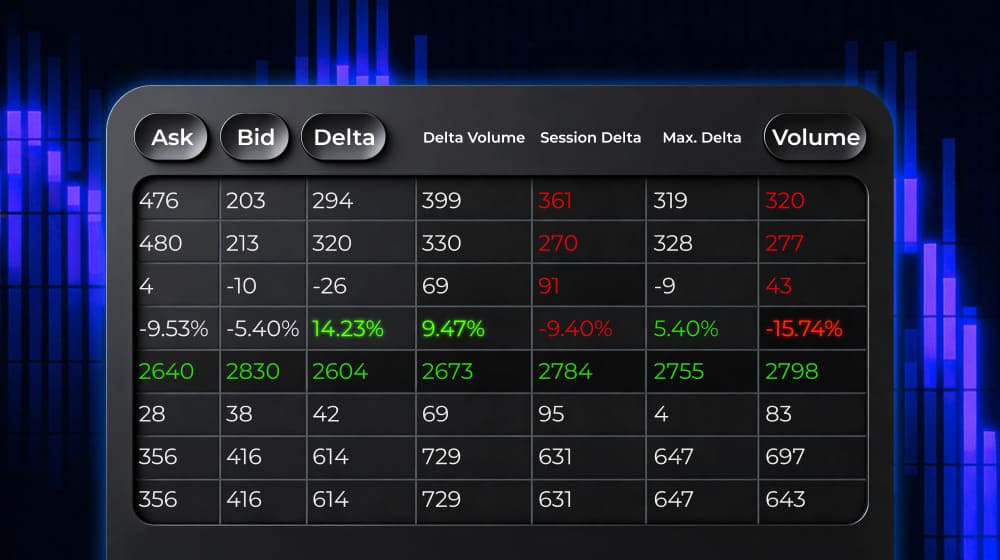
In Part 1, you set up Cluster Statistic to keep footprint data readable and consistent on the chart. Now we move from configuration to application. Below are 7 practical methods based on the indicators Delta, Delta/Volume, Session Delta, Maximum and Minimum Delta, Volume, and Trades Count. They will help you quickly spot standout bars, understand where activity concentrates, and track how pressure and participation shift — without digging into every cluster level by level.
Disclaimer: The examples illustrate possible analysis scenarios and do not guarantee outcomes. Market conditions can change quickly, so always evaluate context and use risk management.
Method 1: Identifying Volume Accumulation Zones (Volume)
This method focuses on using the Volume row in the Cluster Statistic tool to identify areas where significant volume accumulation has occurred, which can serve as support or resistance levels.
Method Description: Clusters with high volume often indicate areas where market activity occurred. These zones can represent levels at which buyers and sellers engage in a struggle or where large positions are accumulated by major market participants.
Step-by-Step Strategy:
- Use Cluster Statistic to identify candles with unusually high volumes.
- Place a Market Profile & TPO tool over the candle with the abnormal cluster volume and identify the Point of Control (POC). If the price struggles to break through a high-volume level, it could indicate a resistance or support zone.
Start now!
Try ATAS free with no time limit
Bullish scenario example
Suppose you notice a candle with abnormally high Volume in the Cluster Statistic. The price has moved up and retested this level multiple times without breaking through. If the volume continues to grow at this level and delta confirms strong buyers, this may support a bullish scenario.
- Cluster Statistic showing abnormally high volume.
- Placing Market Profile & TPO over the candle with abnormally high volume and identifying the POC (Maximum Level).
- Price is holding above the POC (Maximum Level) and rejecting it.
- Potential bullish scenario.
- Stop Loss may be placed below the candle with abnormally high volume, and Cluster Statistic can show you when it is time to Take Profit. Read about determining Take Profit here.
Bearish scenario example
In a downtrend, if you see a candle with unusually high volume and the price moves below it, this pattern is a key zone to watch. A retest of the zone can help you evaluate whether selling pressure is still present — and decide how (or whether) it fits your plan.
- Cluster Statistic showing abnormally high volume.
- Placing Market Profile & TPO over the candle with abnormally high volume and identifying the POC (Maximum Level).
- Price is holding below the POC (Maximum Level) and rejecting it.
- Potential entry for the bearish trade.
Stop Loss may be placed above the candle with abnormally high volume, and Cluster Statistic can show you when it is time to Take Profit. Read about determining Take Profit here.
Method 2: Determining Market Sentiment Using Delta
In this method, we focus on the Delta row in the Cluster Statistic to identify dominant market participants and inform trade direction decisions.
Method Description: Delta shows how buy and sell orders are distributed. Analyzing positive and negative deltas across price levels helps identify areas of imbalance where one side clearly dominates.
Step-by-Step Strategy:
- Find levels with abnormally high positive or negative delta, indicating clear buyer or seller dominance.
- Use delta color and value to confirm the trade direction.
Bullish scenario example
Suppose the price on the chart reaches a support level, and when the price starts reversing to the upside, Cluster Statistic starts showing you a high positive delta. This may suggest buyers are willing to defend this level — especially if activity at the level is also increasing.
The same applies to situations where the price is trending up: positive deltas in the uptrend usually serve as support levels and confirm upward momentum.
- The price found support and reversed.
- Simultaneously, Delta shifts to strong bullish, indicating a significant amount of Ask orders entering the market.
- Volume increases as Delta rises, confirming the strong bullish activity.
- If the price holds above the candle with a high positive delta and strong volume, it may support a bullish read. Use that area as a reference point and evaluate it within your plan and risk rules.
- A stop-loss may be placed below the candle with a highly positive delta and high volume, or below the recent lows. Cluster Statistic can also let you know when it is time to take profit. Read about it here.
Bearish scenario example
Suppose the price reached the resistance and, simultaneously, Cluster Statistic starts showing a high negative delta and bounces down each time. This may suggest sellers are gaining control at this level.
Similarly, if the price is trending down and you observe a negative delta in Cluster Statistic, this is strong confirmation of trend continuation and bearish momentum.
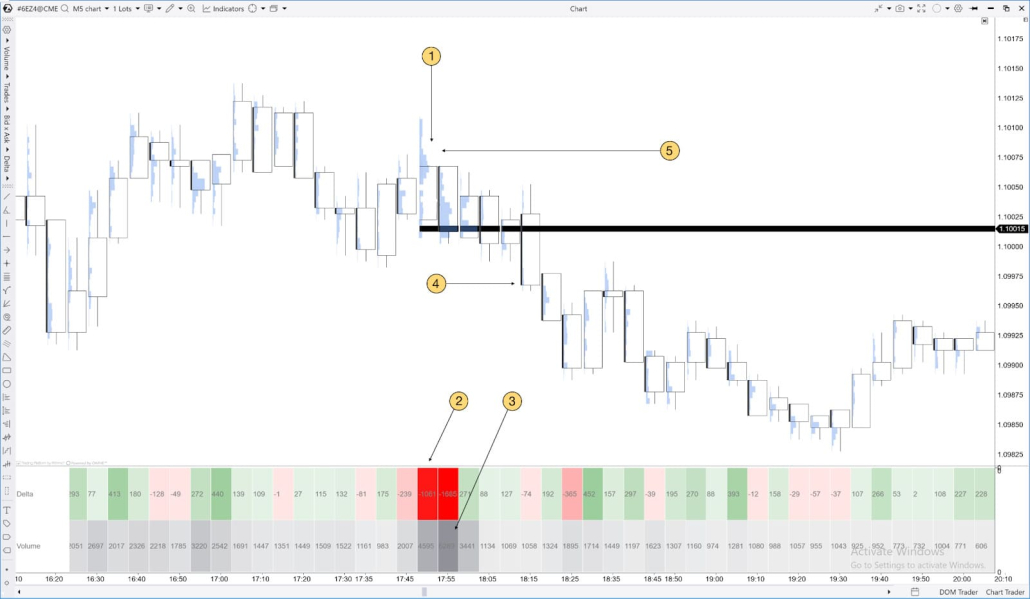
- Price found resistance at the 1.10100 level and reversed.
- Simultaneously, Delta shifts to strong bearish, indicating a significant amount of Bids hitting the market.
- Volume increases as Delta declines, confirming strong selling activity.
- You may consider entering a short trade once the price breaks below the candles with an abnormally negative delta and high volume.
- A stop-loss may be placed above the candles when the delta is abnormally negative and the volume is high. Cluster Statistic can also let you know when it is time to take profit. Read about it here.
Keep in mind: even when Cluster Statistic supports your read, the market can still produce false moves or reverse unexpectedly. Always consider the market context and use additional factors in your decision-making.
Method 3: Analysis with Session Delta
This method helps assess the overall market sentiment and trends using cumulative delta from the start of the trading session.
Method Description: Session Delta displays the cumulative delta from the beginning of the session. It helps determine who controls the market — buyers or sellers — and uses this information to make informed decisions.
Step-by-Step Strategy:
- If Session Delta shows steady growth, it may reflect buyer dominance and support a bullish read in the current context.
- If Session Delta declines, it may reflect stronger selling pressure and support a bearish read — especially when confirmed by volume and nearby levels.
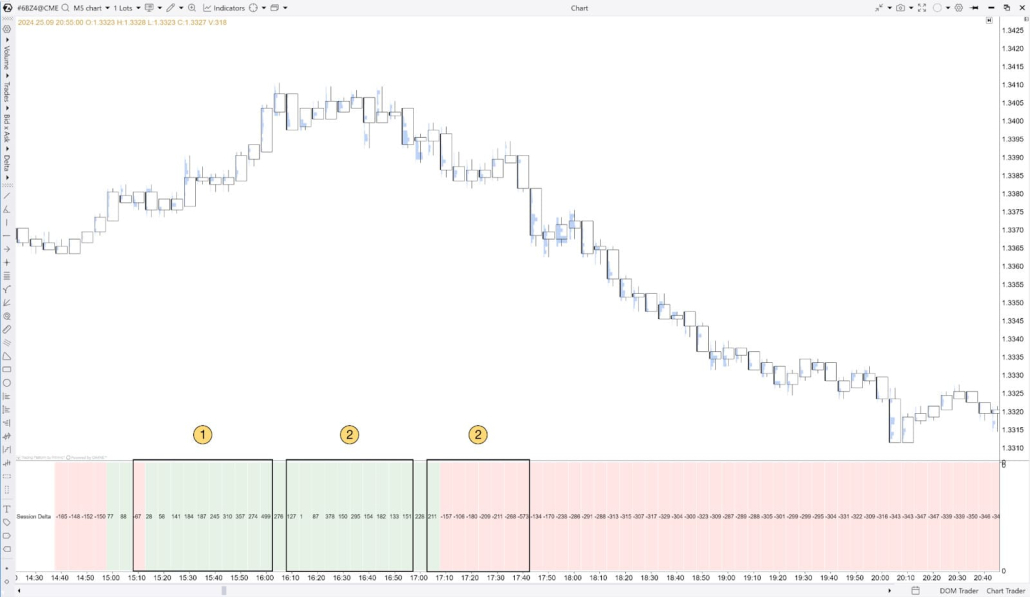
How to confirm the bullish trend using Session Delta
If Session Delta shows consistent growth from the start of the session and, most importantly, price charts also indicate upward movement, it can confirm the strength of buyers. When the price pulls back to a key support level confirmed by rising Session Delta, traders may consider opening long positions.
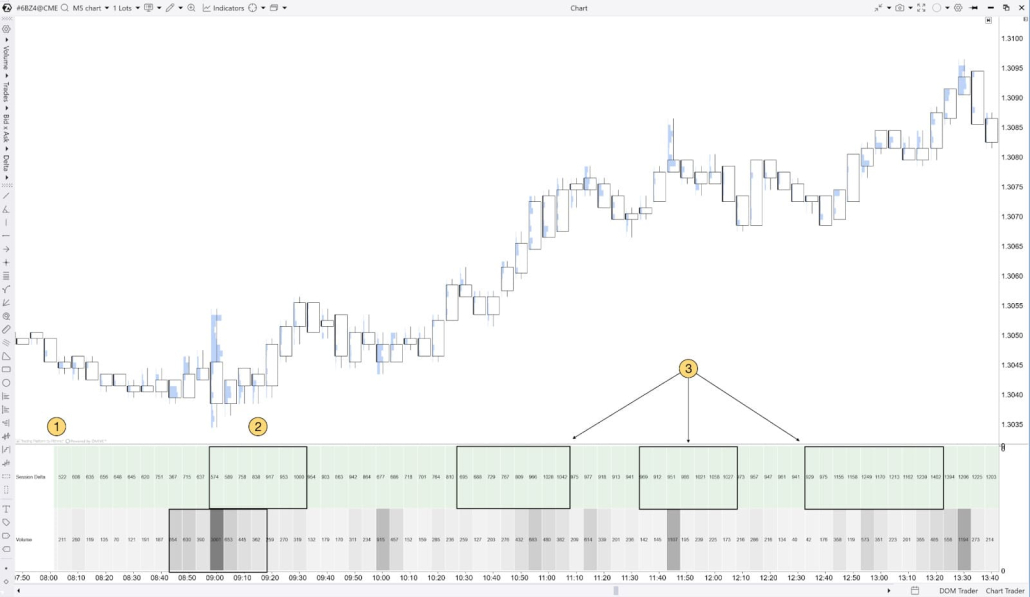
- European session opens at 8:00 am CET.
- Around 9:00 am, Session Delta starts increasing alongside higher volume.
- If Session Delta rises steadily from the start of the session and price keeps moving higher, it may indicate sustained buying pressure — a context where it makes sense to look for bullish continuation on your chart.
How to confirm the Bearish trend using Session Delta
If Session Delta declines steadily from the start of the session while price continues to move lower, it may indicate sustained selling pressure and confirm bearish momentum in the current context.
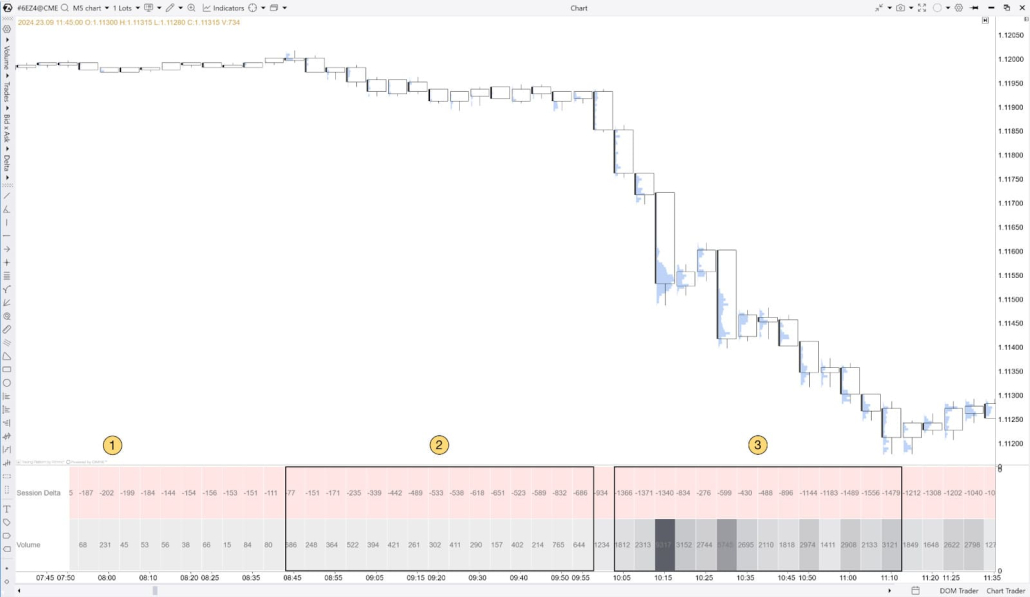
- European session opens at 8:00 am CET.
- Around 9:00 am, Session Delta starts dropping alongside increasing volume. These conditions confirm a strong bearish trend and open the door to shorting.
- As the price continues its downtrend during the day, Session Delta keeps decreasing, confirming the need to continue holding or scale up running short positions.
What about divergence?
Session Delta in Cluster Statistic can also help you spot potential traps. For example, if Session Delta keeps rising while price stays in a tight consolidation (unlike the two cases above), it may suggest aggressive buying that isn’t translating into upward progress. In many cases, this kind of divergence is worth treating as a warning sign and watching for a possible downside continuation — especially if other context factors confirm it.
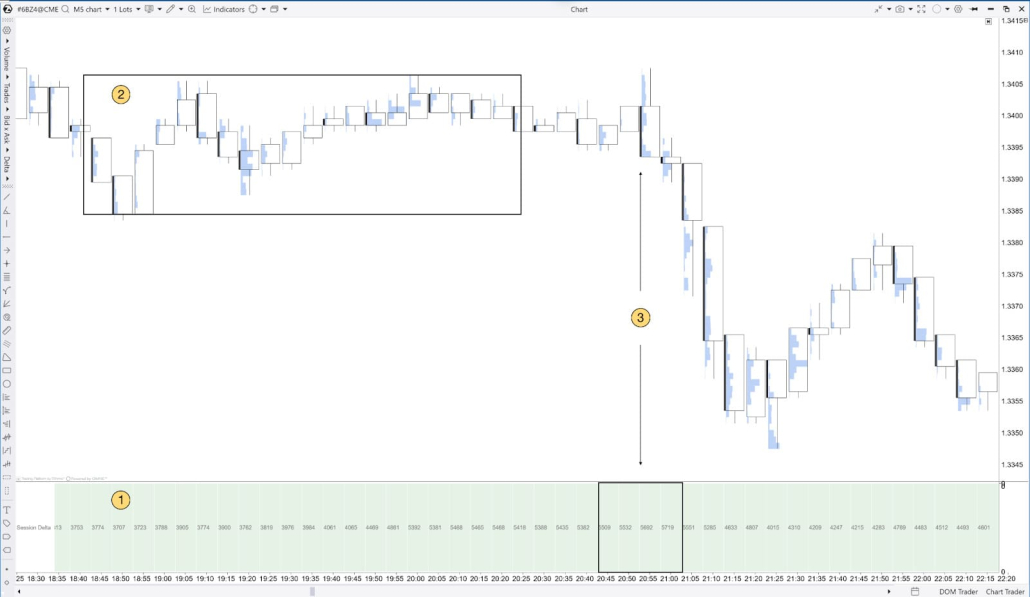
- Session Delta steadily increases.
- The price is consolidating despite the rising Session Delta.
- Session Delta peaks at the same time as the price forms the last top. Session Delta starts decreasing as price drops, indicating the beginning of the downwards move.
The opposite also applies: if Session Delta is dropping, but the price consolidates, it indicates that big market participants do not necessarily want the price to decline, and often acts as a bullish sign for the price.
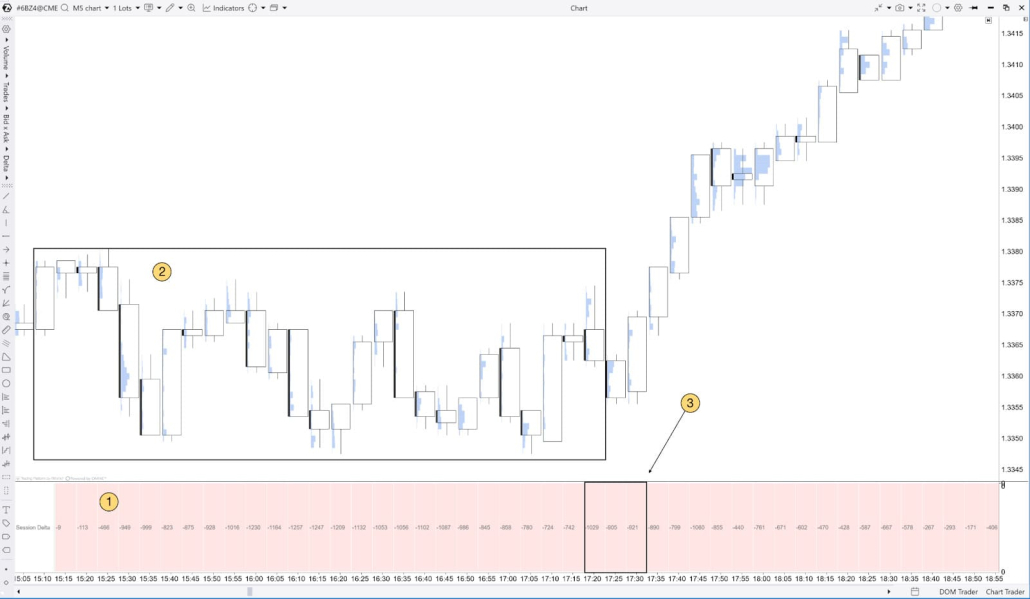
- Session Delta steadily decreases.
- The price is consolidating despite the decreasing Session Delta.
- Session Delta reaches its lowest value at the same time as the price forms the last low. Session Delta starts increasing as the price spikes up, indicating the beginning of the upward trend.
All these insights are accessible in just a few clicks within ATAS. Get started with a free download and try these methods on your own charts.
Method 4: Using “Maximum Delta” to Spot Reversal Points
Method Description: The Maximum Delta metric indicates the highest positive delta within a bar. It helps identify when buyers reach their peak in a specific time frame. This method is suitable for finding potential reversal points when buyers or sellers start to weaken.
Step-by-Step Strategy:
- Identify candles with maximum delta, especially near key support or resistance levels.
- Analyze the price reaction at these levels. If the price cannot break through a level with maximum delta, it could be a reversal sign.
How to spot the upwards reversal using Maximum Delta
If the price is testing a level with maximum delta and holds above it multiple times, this could indicate that sellers have exhausted their efforts, and the price may continue to rise.
- Price finds its low and reverses to the upside.
- On the pullback, near the recently formed key support, the candle with the maximum delta appears.
- Price holds steady above the candle with Maximum Delta, indicating the buyers’ strength and serving as a potential entry point.
- If price continues higher and holds above a candle with strong positive delta (especially with solid volume), many analysts treat it as a supportive bullish context. You can use that area as a reference point and decide whether it fits your plan and risk rules.
- A Stop Loss order can be placed below the candle with the Maximum Delta; it is now serving as support. The Take Profit time can be determined using the Cluster Statistic. Read about it here.
How to spot the bearish reversal using Maximum Delta
If, at the peak of an uptrend, you see a candle with a high maximum delta, but subsequent price movement slows down, this could indicate that buyers are losing control, and a downward reversal is possible.
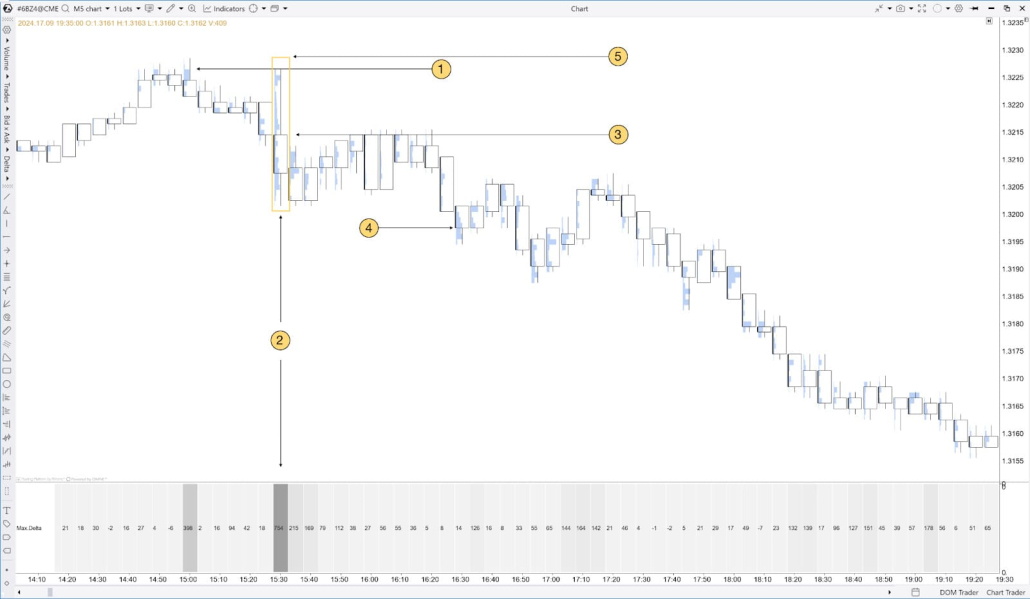
- The price finds its high and reverses to the downside.
- On the pullback to the recently formed key resistance, the candle with the maximum delta appears.
- The price holds steady below the candle with Maximum Delta, indicating the buyers have lost strength, and serving as a potential entry point for short trades.
- If the price moves below the candle with Maximum Delta, it may suggest seller pressure is taking over. Use that candle as a reference level and evaluate follow-through in the next bars.
A stop-loss order can be placed above the candle with the Maximum Delta; it is now serving as support. The time to Take Profit can be determined using the Cluster Statistic. Read about it here.
Method 5: Finding Support and Resistance Levels Using “Minimum Delta”
Method Description: The Minimum Delta metric shows the highest negative delta within a bar. It helps traders identify levels where sellers showed the most activity and where support levels might form. Using Minimum Delta enables traders to find zones where the market has reached its “bottom,” suggesting an upward reversal might follow.
Step-by-Step Strategy:
- Identify candles with minimum delta, especially near key support levels.
- If the price tests a level with a minimum delta multiple times without breaking it, this may indicate support formation.
Bullish scenario example
Suppose the price is dropping towards a level with a minimum delta, and you observe rising volumes at this level. This could indicate the start of buying by large players and a potential upward reversal.
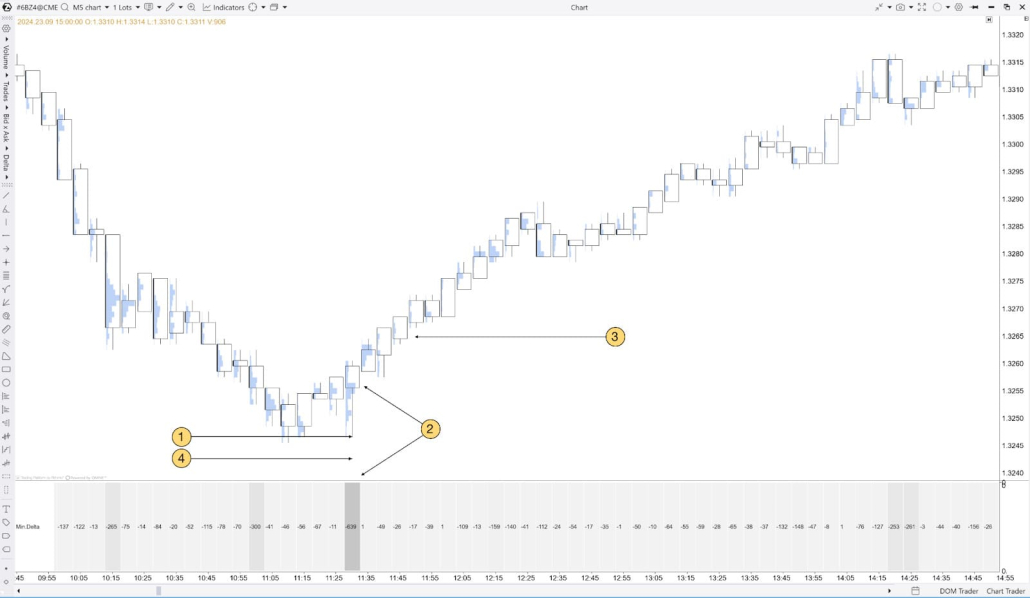
The price found support at the 1.3247 level and bounced up.
- On the pullback to the support, the Minimal Delta is formed, indicating the exhaustion of sellers and possible upward reversal.
- The price holding above the Minimal Delta candle serves as a potential entry point.
- Stop loss may be placed below the candle with the Minimal Delta, and the time to Take Profit may be determined based on the shift within the Cluster Statistic. Read more on Taking Profit using Cluster Statistic here.
Bearish scenario example
If the price approaches a resistance level and the previous test of that level showed a minimum delta, this may indicate that sellers are ready to defend the level.
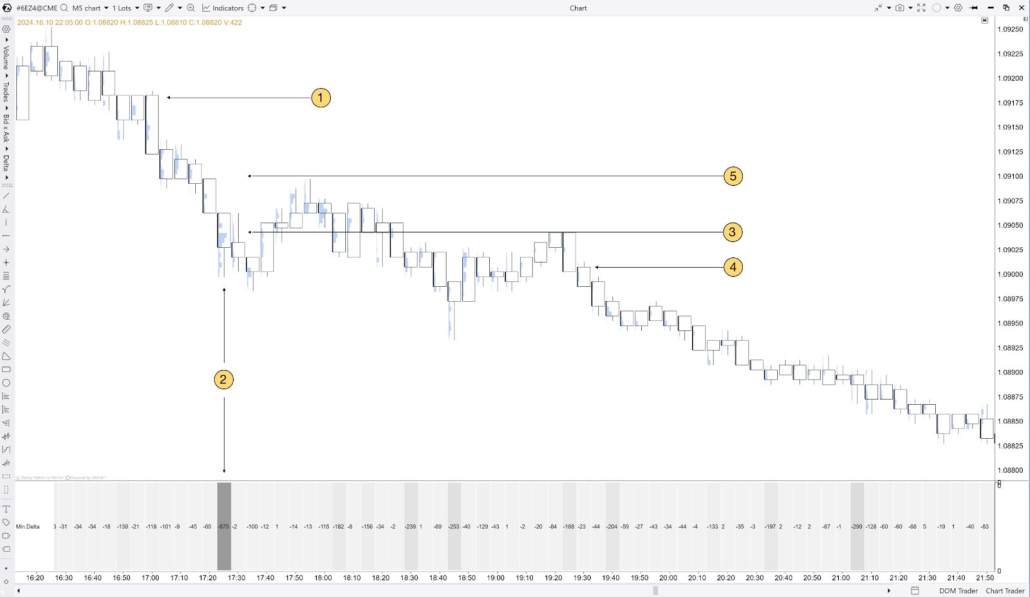
- The price is in a downtrend.
- In the middle of the downward move, the candle with Minimal Delta is formed.
- As the price drops below the Minimal Delta level, it indicates strong selling pressure and a high probability that the downtrend will continue.
- Potential short entry after the price rejected the level of the candle with the Minimal Delta.
- Stop loss may be placed above the candle with the Minimal Delta, and the time to Take Profit may be determined based on the shift within the Cluster Statistic. Read more on Taking Profit using Cluster Statistic here.
Method 6: Assessing Market Sentiment with Delta/Volume
Method Description: The Delta/Volume (%) metric shows the percentage of delta relative to the bar’s total volume. It helps assess how actively buyers or sellers dominate at a given price level relative to the overall volume. A high Delta/Volume percentage indicates a clear advantage of one side and can serve as an indicator of the current movement’s strength.
Step-by-Step Strategy:
- Analyze bars with a high Delta/Volume percentage, especially at key support and resistance levels.
- If the Delta/Volume percentage shows consistent growth at a specific level, this could indicate buyer or seller strength.
Example of a Long Formation:
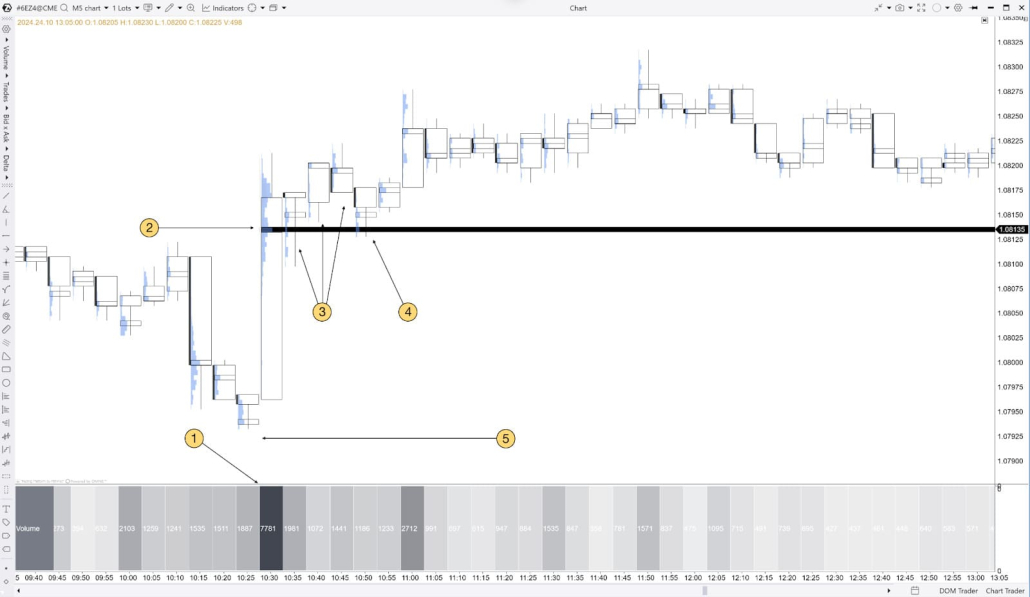
If, at a key support level, the Delta/Volume percentage rises alongside increasing volume, this could indicate that buyers are actively defending the level and that further upward movement is likely.
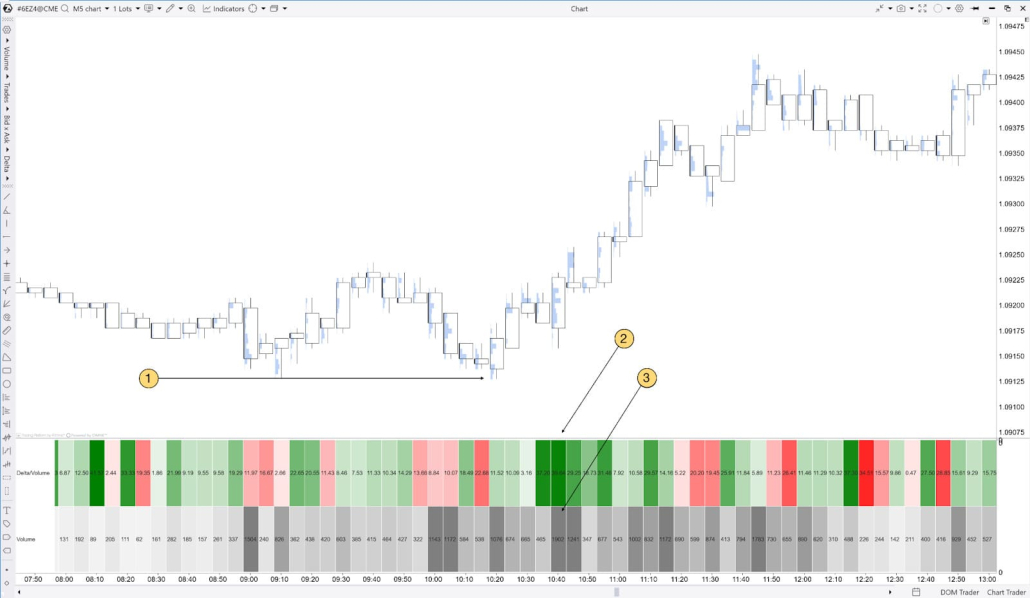
- Key support level.
- As the price reacts to the key support level (1), the Delta/Volume percentage rises along with (3) Increasing Volume.
Example of a Short Formation:
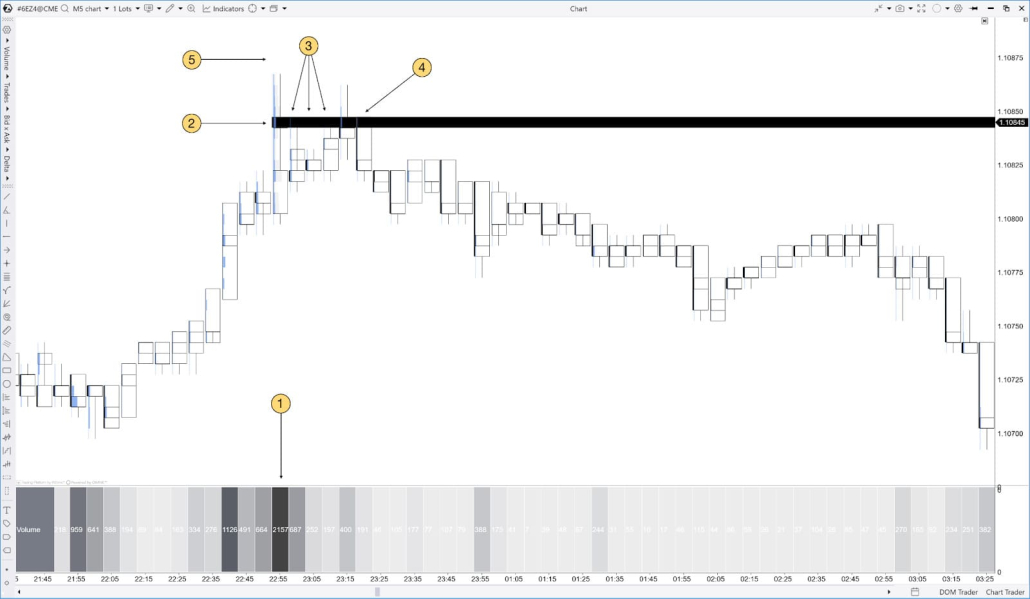
If the Delta/Volume percentage drops sharply at a resistance level, it may indicate that buyers are running out of steam, and a price reversal downward is possible.
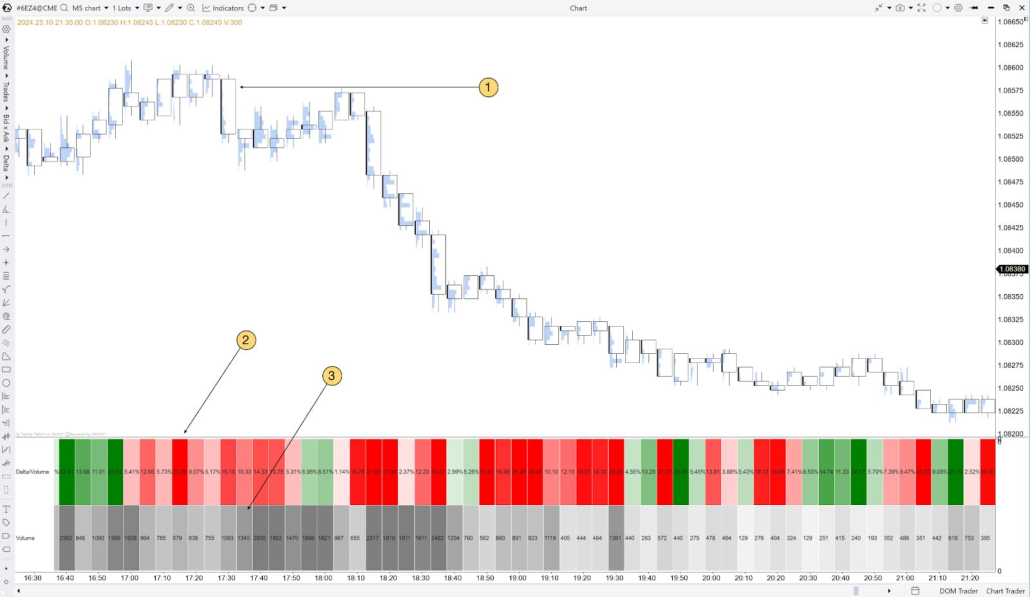
- Key resistance level.
- As the price reacts to the key resistance level (1), Delta/Volume percentage drops along with (3) Increasing Volume.
Method 7: Using “Trades Count” to Assess Market Activity
Method Description: The Trades Count metric shows the total number of trades made in each bar. It helps assess overall market activity and identify spikes in interest among market participants. Combined with Delta and Volume indicators, this method helps identify periods of high volatility and make informed decisions based on activity levels.
Step-by-Step Strategy:
- Monitor increases in the number of trades, rising volume, and changes in delta.
- Use activity spikes to confirm the strength of the current trend — or to flag a potential reversal.
Example of spotting price reversals using “Trades Count”:
If, after a prolonged rise, the number of trades begins to drop sharply, it may indicate a weakening trend and a possible reversal to the downside.
The opposite also applies: when you observe a sharp increase in the number of trades along with positive delta and rising volume, this could indicate an upwards reversal.
How to Use Cluster Search to Find Exit Zones When Market Narratives Change
When the market narrative changes, it is crucial to have an exit plan to protect profits or minimize losses. For this, you can use Cluster Search combined with Delta and Session Delta metrics.
Using Delta to Take Profit
If Delta begins to drop sharply or turns negative in a zone previously supported by buyers, this could be a sign to take profits or close the trade.
- Let’s assume you are in a buy trade.
- At this point, the price slows down.
- And, simultaneously, Delta on Cluster Statistic drops sharply. This is a potential sign that big, aggressive sellers stepped into the market and the price might reverse against your initial buy trade.
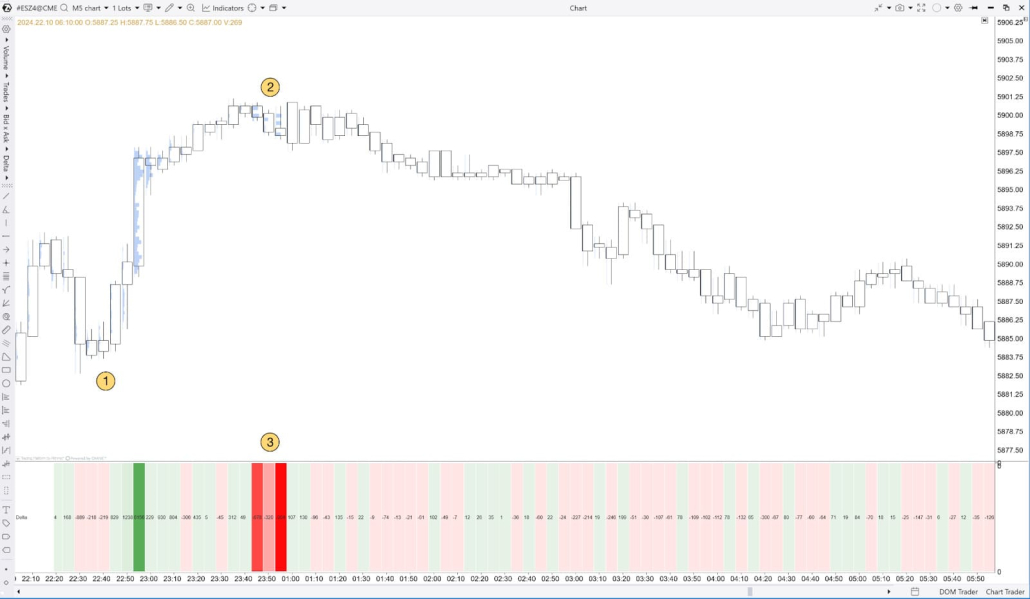
Using Session Delta to Exit on Trend Changes
If Session Delta starts to show signs of reversal or slowing growth amid a continuing uptrend, this could be a sign of buyer weakness and a warning of a potential change in direction.
- Session Delta increases along with upward price movement.
- Session Delta starts showing signs of reversal – it started to consolidate as the price slowed down.
- Session Delta drops, indicating a change in market direction.
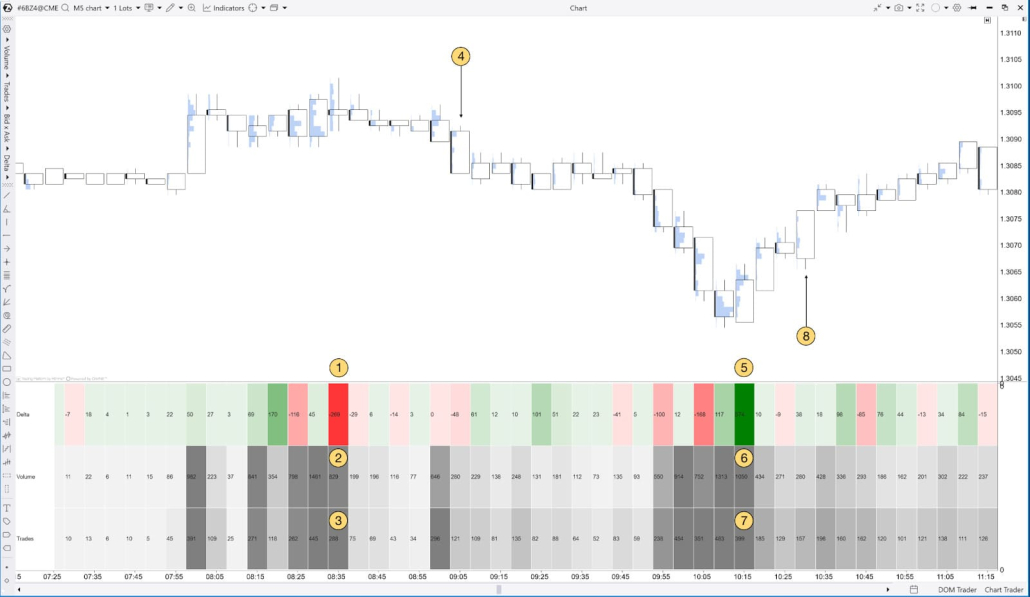
Using Trades Count to Take Profit When Buyer/Seller Strength Weakens
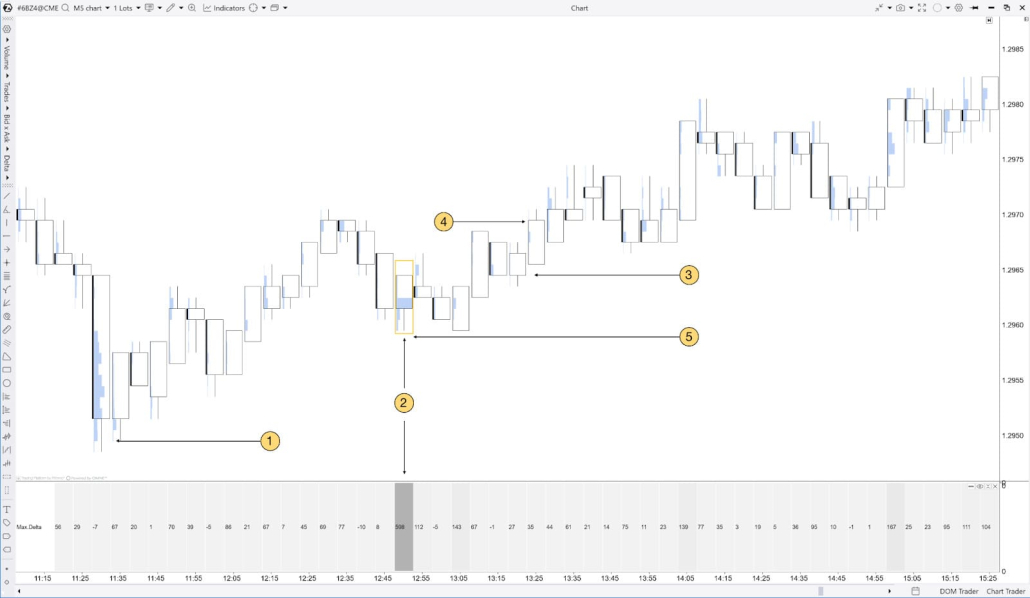
If you observe a drop in Trades Count after a prolonged price movement (up or down), this could indicate a weakening trend. In this situation, it is recommended to take profits and exit the trade. For example, in an uptrend, if the number of trades steadily decreases over several bars, it may suggest participation is fading, and the move is losing momentum — which can increase the likelihood of a pullback.
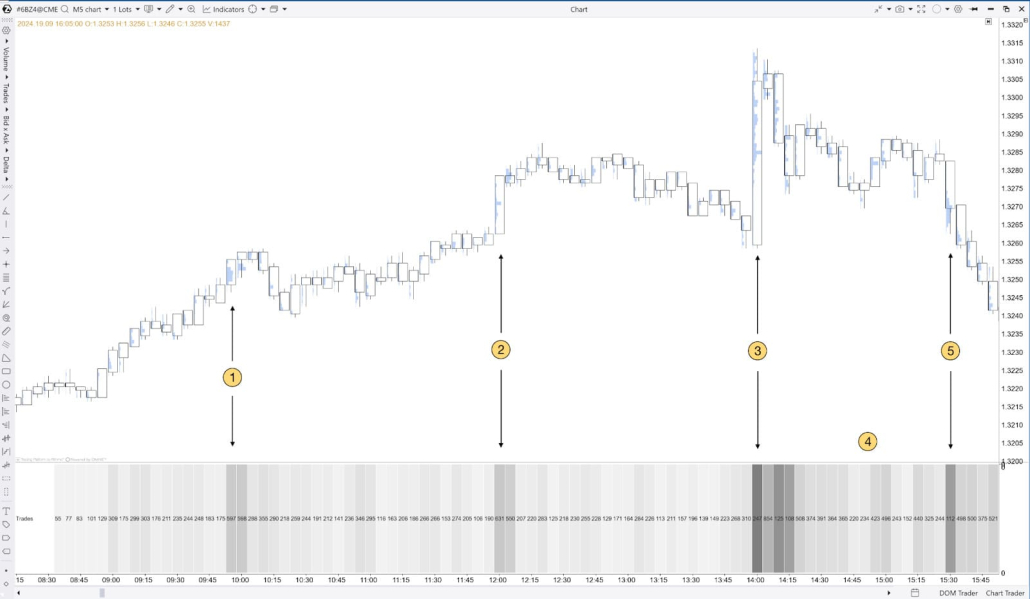
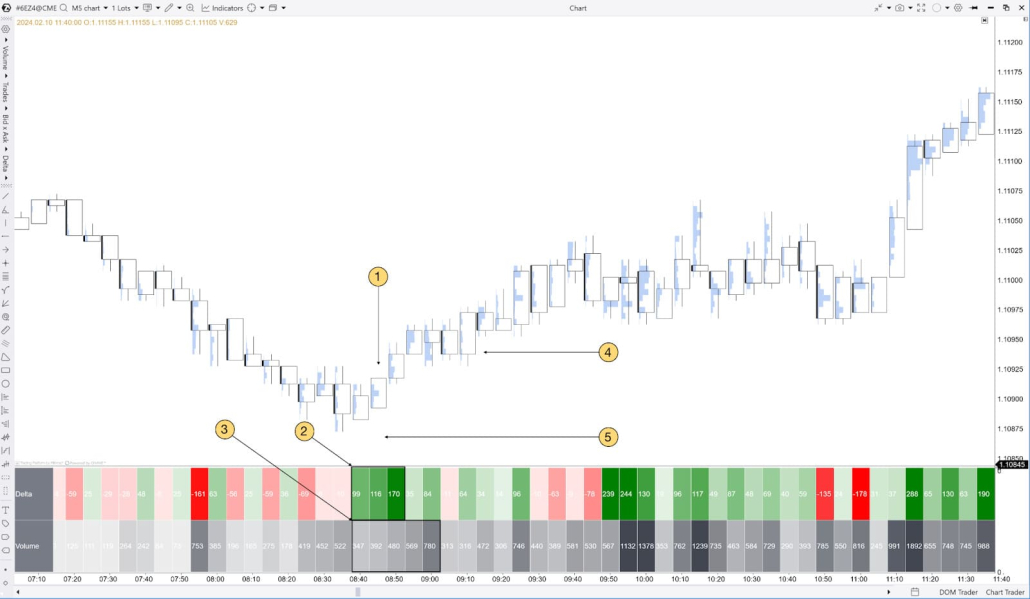
(1) and (2) – The price is uptrending, and buyers are supporting the move, as we see a high amount of Trades on Cluster Statistic only in bullish candles. This indicates the strength of buyers.
(3) The price makes a final push up, as an abnormally high amount of trades is reflected in Cluster Statistics.
(4) After the last push, the price slightly declines, and, simultaneously, the Trade Count drops.
(5) Traders start entering the market again – when the price reverses. At this moment, the increased Trade Count indicates that traders are supporting the bearish momentum – and, accordingly, the bullish trend is over.
Conclusion
The seven methods in this guide give you a simple routine: scan the table, spot the bars that stand out, and only then dive deeper into the clusters where it really matters. That’s the point of Cluster Statistic — less noise, faster reading, and more consistent interpretation of footprint context.
To finish, Cluster Search helps you move even quicker: it finds bars that match your conditions and highlights areas that may work as exit zones — so you can review and validate your scenarios directly on the chart. Download ATAS to apply these methods in real time and test them on your own data.
Subscribe
Get the latest ATAS news delivered conveniently