
What does a bounce mean in trading?
To put it simply, it is a pattern that includes in sequence: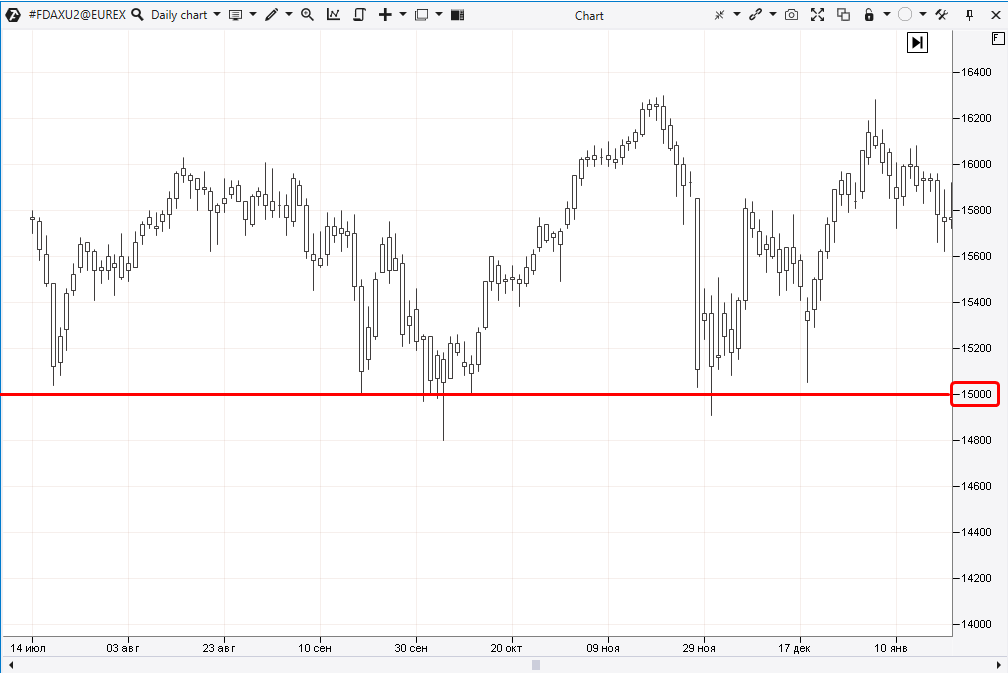
Types of bounces
Based on the type of the support line:- bounces off the support line built from the previous low;
- bounces off the trend line;
- bounces off the round level (what are round psychological levels);
- bounces off the 50% Fibonacci level (what are Fibonacci levels);
- bounces off other types of support lines.
- a precise touch;
- “undershooting”;
- a false breakout.
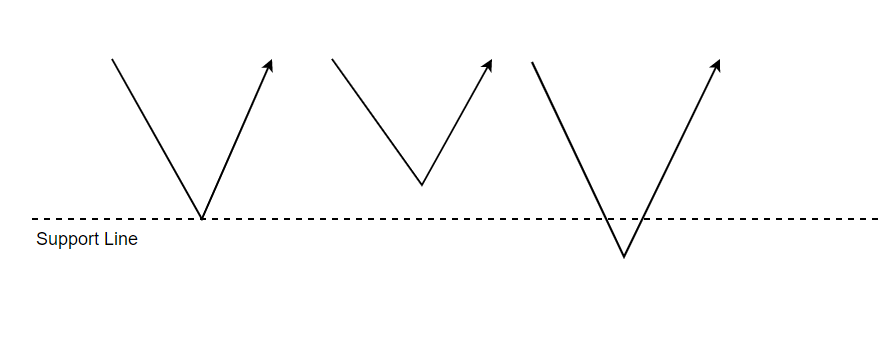
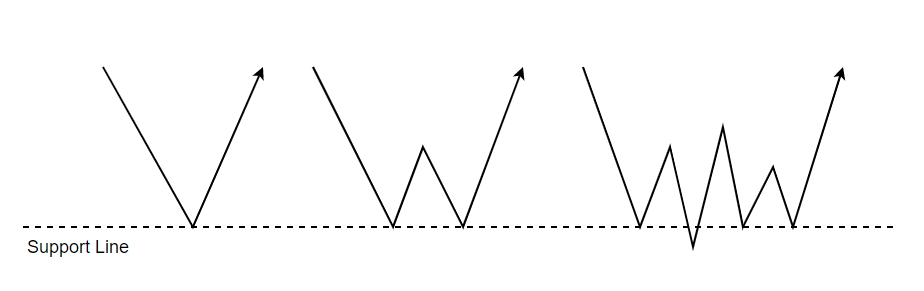
- a simple V-shaped bounce;
- a W-shaped bounce (also known as a double bottom pattern);
- a bounce with the formation of a consolidation zone (more complex formations where you can see a reverse head and shoulders pattern and others).
- a successful bounce (when the price rises significantly after the bounce);
- a failed bounce (when the price rises slightly after the bounce, and it is followed by a bearish breakout of the support).
Advantages and disadvantages of bounces in trading
Advantages:
- Minimize risks. Since bounce trading is directly related to support levels, it allows you to plan risks when choosing levels for setting a stop-loss.
- Versatility. They are applicable to all financial markets: forex, stocks, cryptocurrencies and others. Bounces occur on different time frames.
- They allow you to find a local entry point in the global market context, for example, to join a trend on a long-term time frame.
Disadvantages:
- The drawing of support lines is subjective.
- There is no guarantee that the support level will hold and the price will make a significant bounce off it.
How to trade bounces
There are two main approaches to buy a bounce: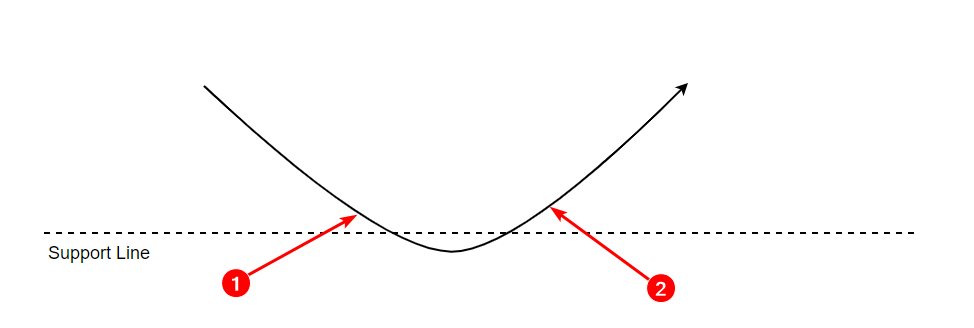
Since the bottom point of the bounce is rarely obvious, it is too irrational to consider perfect entries between 1 and 2, let’s be realistic. Let us briefly analyze two main approaches.
The first approach
This approach is associated with forestalling when the price has approached the support level, and the trader assumes that a bounce is about to happen. Relatively speaking, it is the following situation: “Sales have exhausted, but there are no buyers yet.” In this case, the trader takes the risks of buying against the downward momentum. The risks are associated with the fact that the price will continue to decline immediately or after a short-term consolidation near the support level.The second approach
The trader’s actions are considered more conservative here. A long position is opened when confirmations are received. They must be enough to make sure that buyers have become more active and a bounce has occurred. In this case, the price has already risen significantly from the support level and the trader takes the risk that if the stop-loss is set below the bounce low, it will be a “wide stop”.Which approach is better?
There is no ultimate solution. It all depends on the trader’s personal qualities, their vision of the market and risk tolerance. Try both strategies on an ATAS demo account to see which bounce trading strategy is best for you.What is a dead cat bounce
To put it simply, a dead cat bounce is a pattern where a bounce off the support line does occur, but it is weak. The upward reversal does not attract new buyers who are able to provide stable demand and thus support the price growth. As a result, the price may make several bounces, one weaker than the other, but then it goes down and makes a bearish breakout of the support.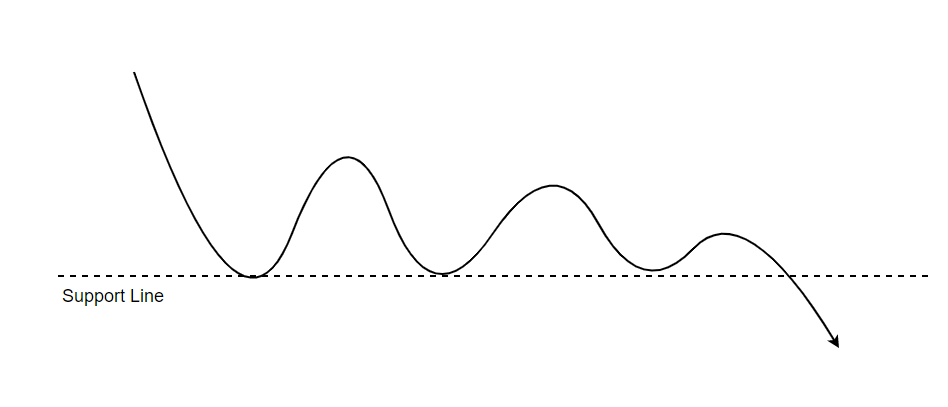
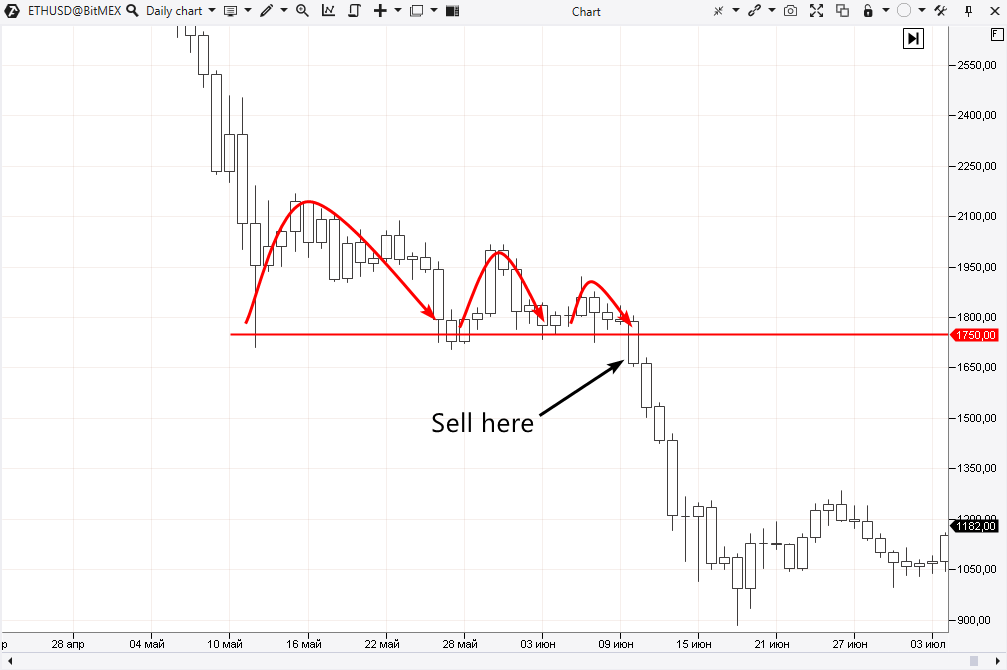
How to make bounce trading more efficient
Use the advanced instruments of the ATAS platform (download the platform for free) to improve your trading performance. By the way, this applies not only to buy bounces. Let’s have a closer look at the chart above. How was it possible to enter a short position on June 10, 2022 on a bearish breakout of the 1750 level after a series of dead cat bounces? Let’s select a 3-minute chart and add the Delta and Stacked Imbalance indicators.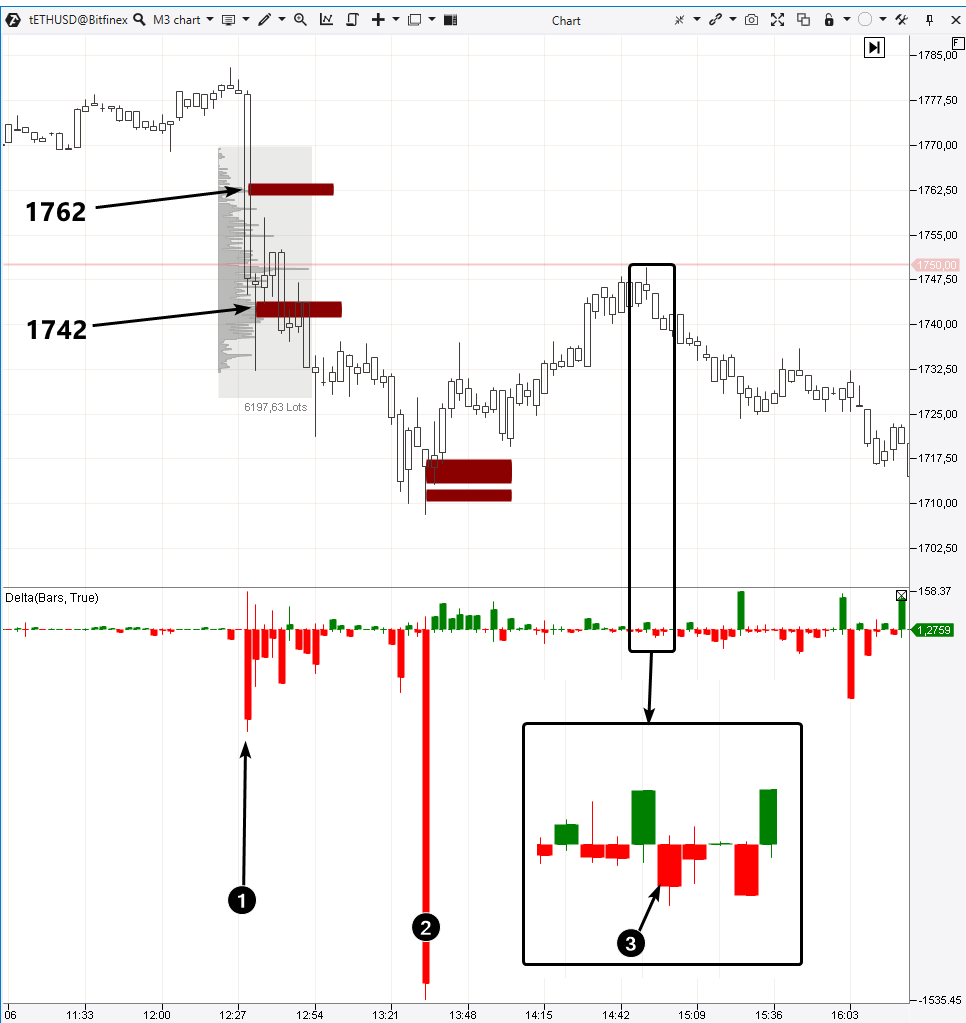
- If you act according to the first approach (forestalling), you open a position seeing how the price rises in an unstable way to the resistance level, but you still do not have facts indicating that a bounce has occurred.
- If you act according to the second approach, you need confirmation. The very first appears on the delta indicator (we zoomed it so that you can see this moment better). The indicator shows a sharp change from positive to negative delta (3). The price acts accordingly and declines from the open to the close. This small increase of sellers’ activity was the beginning of a new wave that lowered the price of ETH to 1660 on the same day.
An example from the futures market for stock indices
Trading of the S&P-500 stock index futures on a 15-minute chart is illustrated below. Analyzing the situation within the day, we see that the market has found support indicated by local lows 1 and 2.
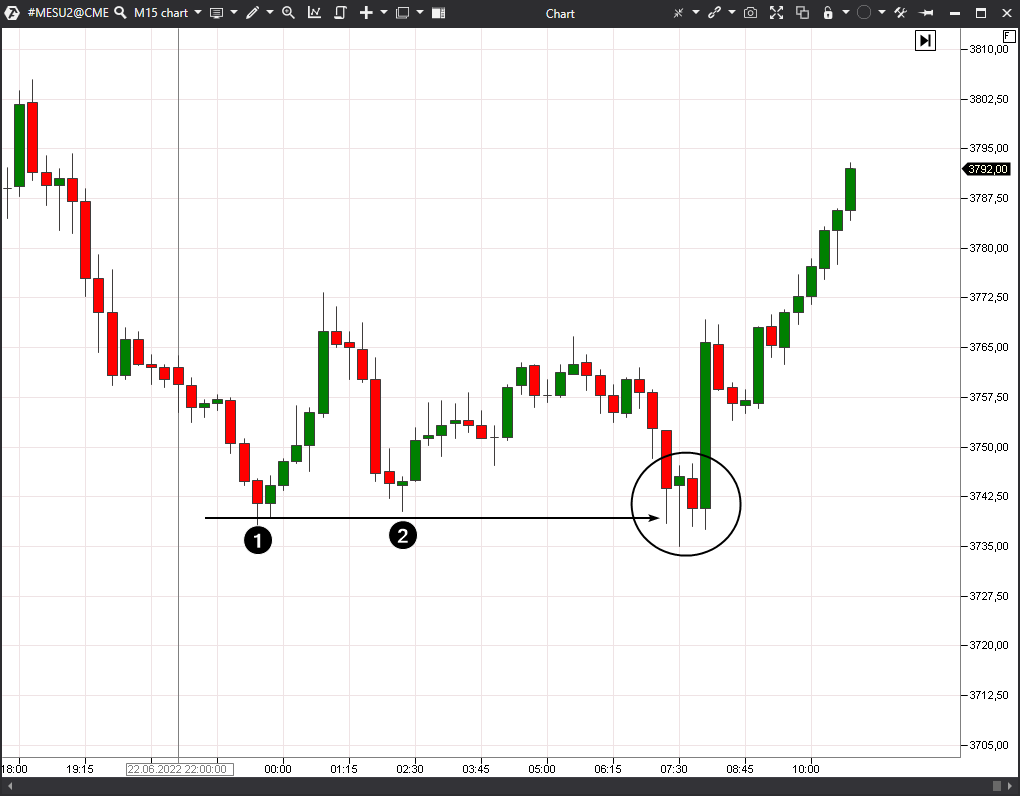
When the price drops back to this support, we switch to the fast 1-minute time frame to find confirmation to go long on the bounce. Let’s add the Delta and the Dynamic Levels indicator.
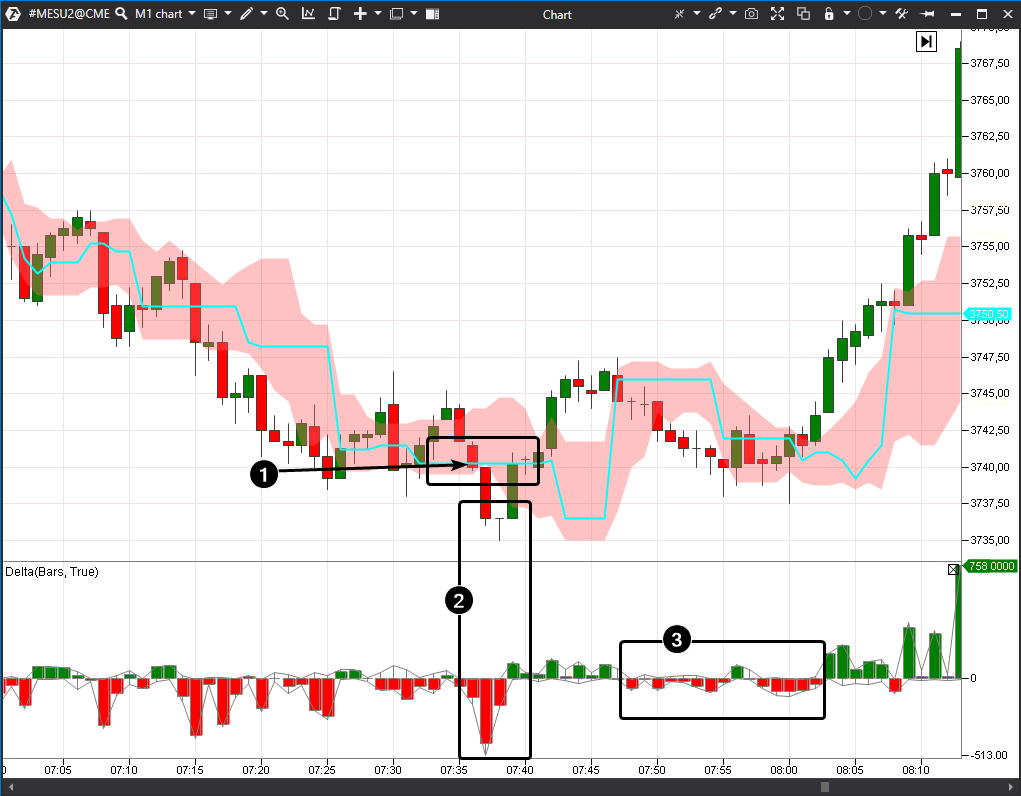
Number 1 indicates that the maximum volume level becomes horizontal (7:25-7:40), it suggests that the market finds a balance of supply and demand after falling to the support level. It is a positive sign.
Number 2 indicates an attempt to resume the bearish trend, but it failed. The sellers took the initiative (demonstrated by a spike in the negative delta) by pushing the price down, but very quickly the buyers offset the results of this effort. It is another positive sign. Another decline follows after that. But the pressure of sellers has noticeably decreased, since the columns of the negative delta are not large (3) compared to what they were before. This is another positive sign. Having these three facts, you as a trader have a rationale for opening a long position. The trigger for opening a position can be an increase in price and the closing of a candle above the channel’s border of the Dynamic Levels indicator (08:02). A stop-loss can be set below the lower border of the dynamic channel and then gradually raised to protect the increasing profit.An example of bounce trading in the oil market
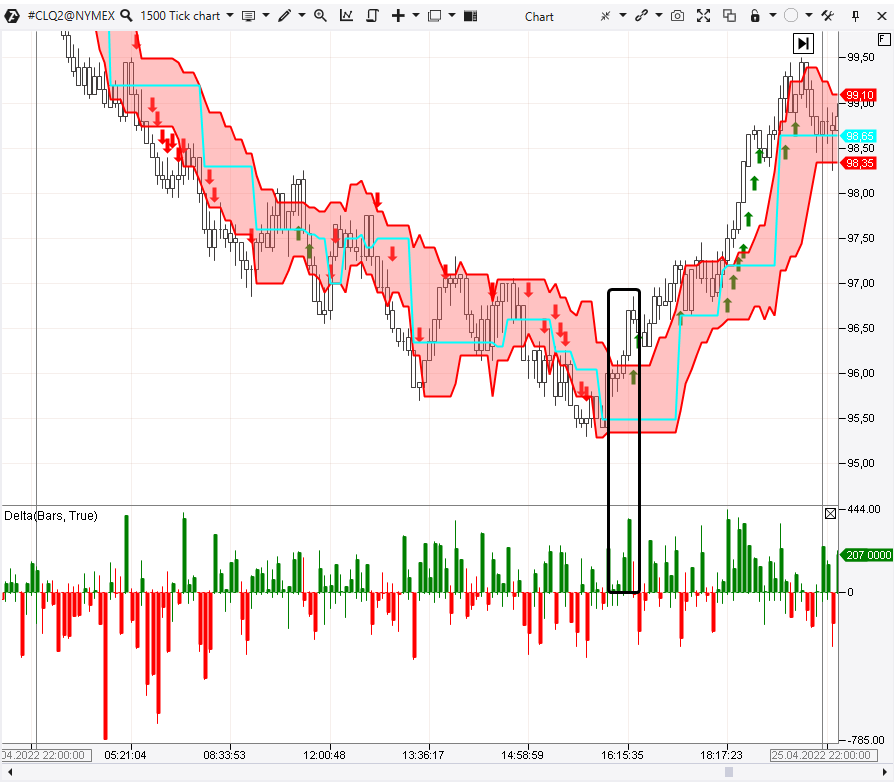
The chart below shows the dynamics of oil futures trading on the daily time frame. This is the scale at which stronger supports can be found to trade bounces and hold positions longer than a few hours. The trend line (1), which supports the growth of oil, can be built on the lows of February-April. When the price declines again towards this line, the conditions are set to switch to the intraday time frame and explore the possibility of entering a bounce off the trend line around the level of $97 per contract.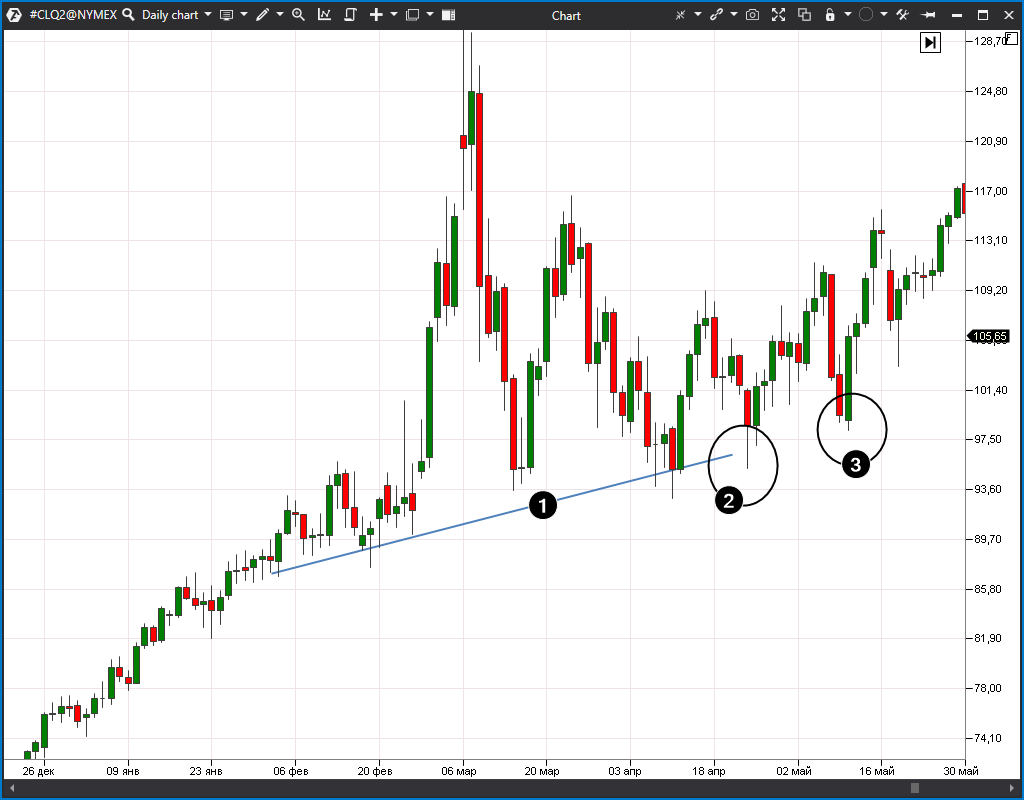
How to start trading bounces on the exchange
Combine time frames to find support and potential bounces on long-term time frames and to get confirmation signals on short-term time frames. Keep in mind that bounces occur very quickly in strong markets, which provides a small opportunity to enter a position at a good price. If the price has fallen into the zone of a potential bounce but does not show any signs of an upside reversal, it reduces the likelihood of a significant bounce. To gain an advantage in confirming a bounce, use volume analysis tools. They will help confirm the entry into the short position. Download the ATAS program for free right now – try a powerful cluster chart analysis tool for stock, futures and crypto markets.Conclusions
Bounces are a technical analysis pattern based on an upward price reversal from an existing support level. Can we call them a test? Perhaps yes. How to trade bounces on the exchange? There are no easy tasks in trading, otherwise everyone would be millionaires. But professional indicators for volume analysis help to solve such problems. Download ATAS. There are four good reasons for that:- It is free and you can continue using the program even after the 14-day trial period.
- You will be able to identify bounces in the stock, futures and crypto markets.
- There is a demo account built into the ATAS platform, so you can practice trading without risking your real capital.
- The platform offers many benefits for traders who want to trade with easy-to-use cluster charts and useful indicators. Read our blog and subscribe to our YouTube channel.
Information in this article cannot be perceived as a call for investing or buying/selling of any asset on the exchange. All situations, discussed in the article, are provided with the purpose of getting acquainted with the functionality and advantages of the ATAS platform.


