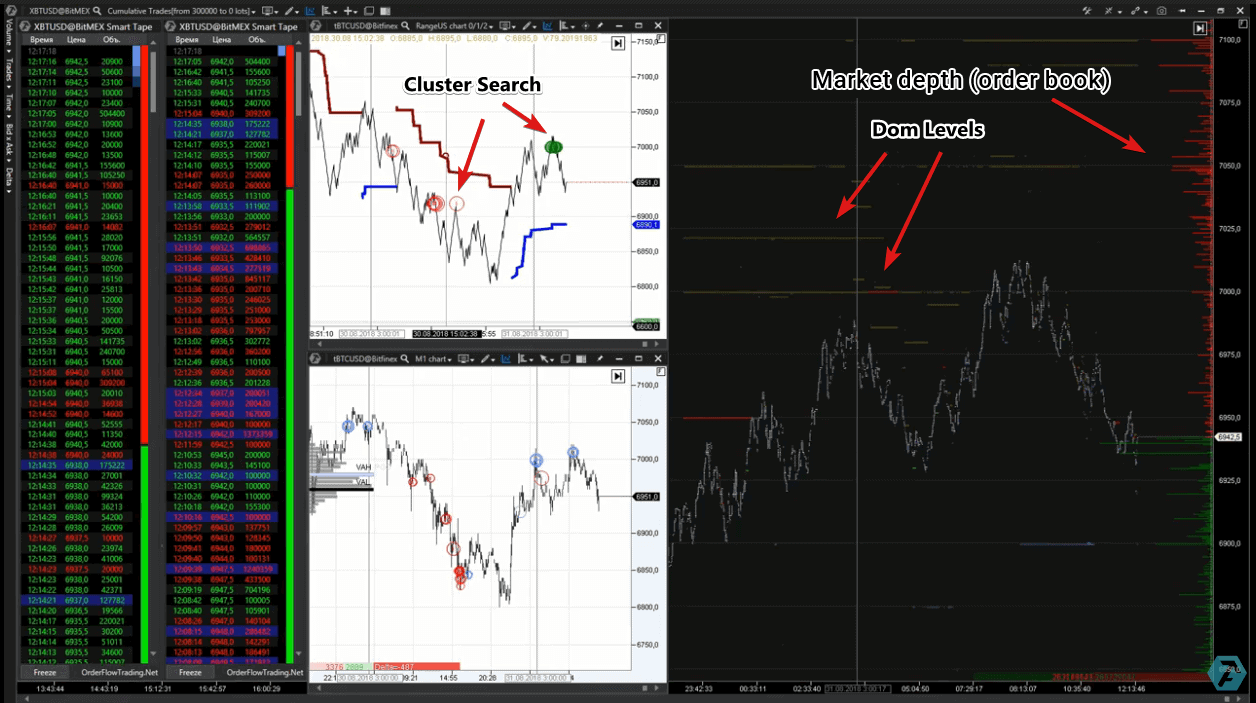
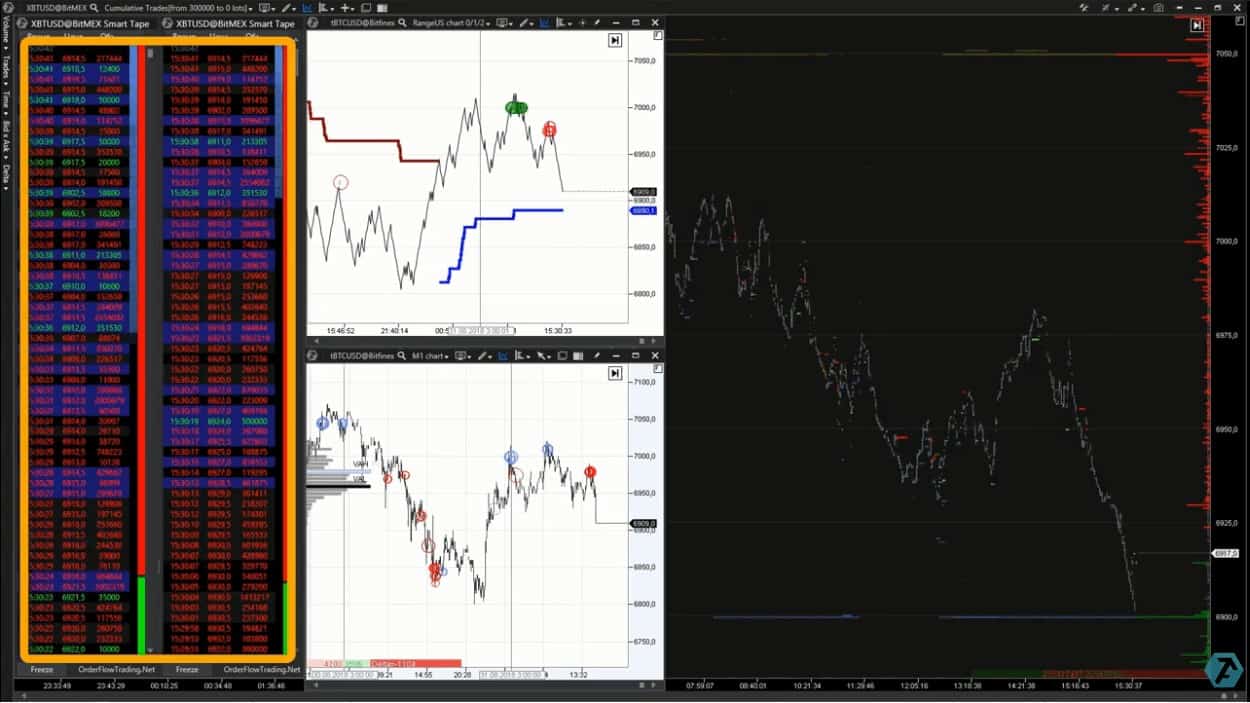
Let us consider the bitcoin futures market on the BitMEX and Bitfinex cryptocurrency exchanges (how to make money on cryptocurrencies). We will set the following charts and indicators:
- Smart Tape of Time and Sales Tape. We will use two tapes and place them in the left part of our working space. Why two? One is required to track big volumes only and filter out “the noise”. The tape is required to understand whether the current movement is supported.
- The Cluster Search Indicator. The indicator is set in order to search for aggressive trades of major traders and to show directions of these trades – buying and selling – in color. We will set the search for trades on the Bitfinex exchange in two charts with white background in the central part of our working space. The lower one works on 1 minute timeframe and the upper one is a RangeUS range chart (how to analyze a range chart).
- A chart with the Market Depth Indicator (red and green horizontal bar chart in the right part) and Dom Levels Indicator (it reflects levels with large volume orders) is shown in the right part. We will use values of these indicators to identify important levels in the order book and assess market positions of passive buyers and sellers.
Analysis of the current situation
Please, note. We will analyse the market “at the moment” without consideration of older timeframes. In real trading, please, take into consideration the current situation in the context of a bigger scale.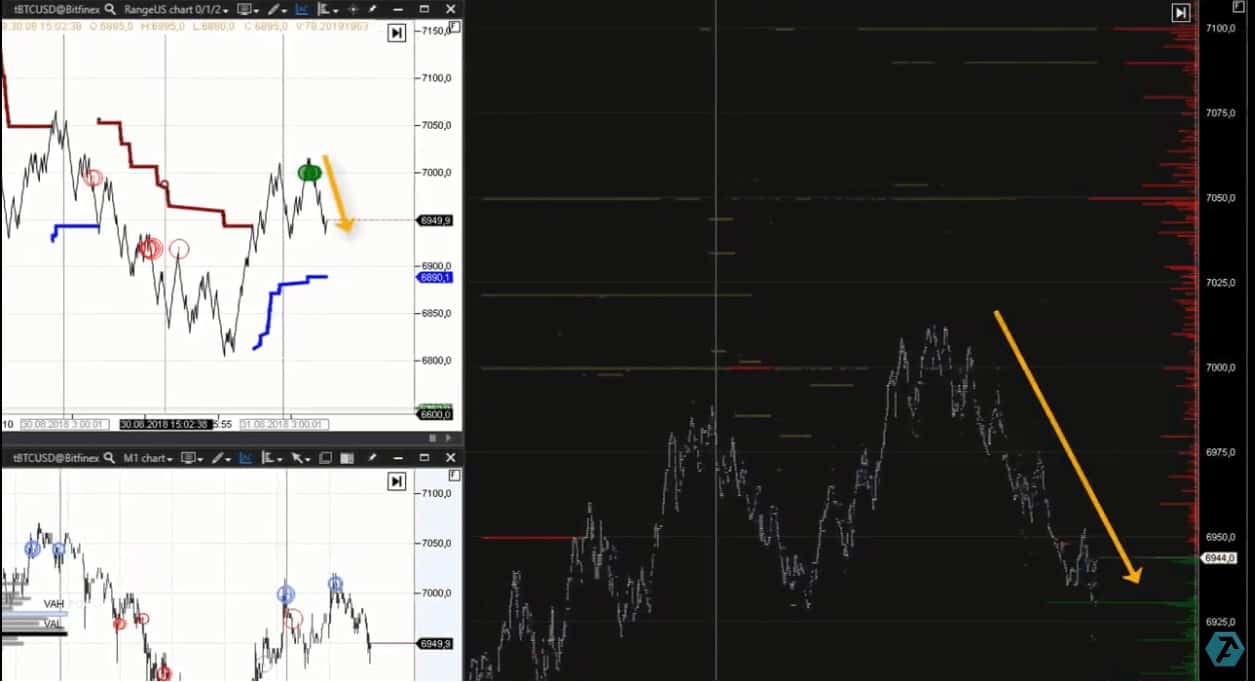
A seller appeared in the market, while the price went down, who wanted to hold the price below the level of his limit order, which can be seen from the Dom Level Indicator values in the following chart.
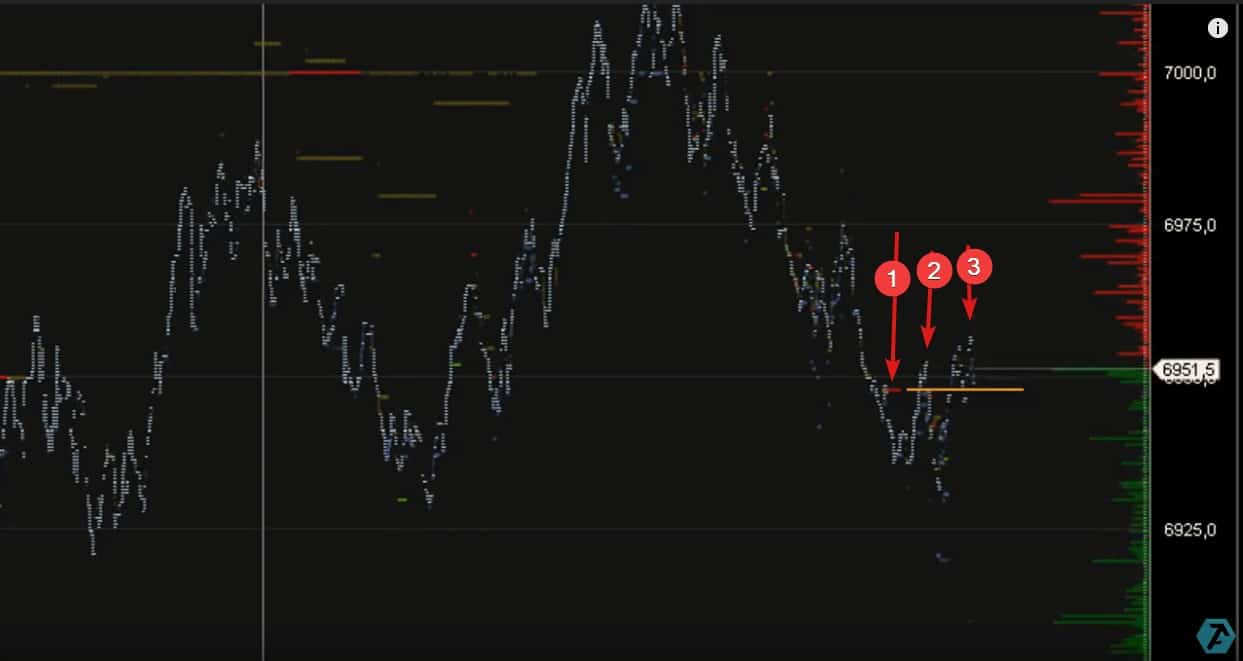
- The red line of the indicator says that a major trader posted a limit order for selling and we built the resistance level from it (yellow line)
- For the first time, this resistance level kept the price from growing
- But then the level was broken
We do not assert, we just dissert. Perhaps, a hypothetical major trader had a short position and wanted to boost the panic of “the crowd” of retail traders with this sell-limit and to fix, partially, the profit from short covering after a downward movement from the previous peak. Having achieved that, he lost his temporary interest in holding the price under resistance. As a result, the market moved up.
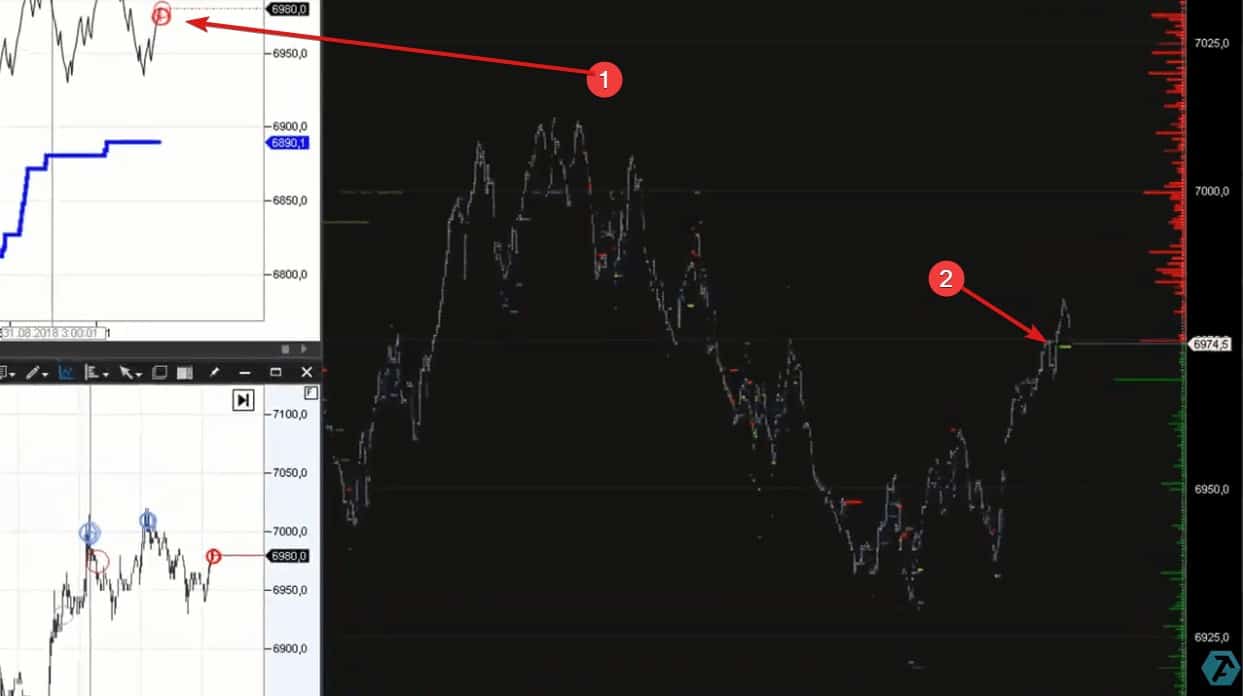
- While the price is growing, the Cluster Search Indicator fixes emergence of the aggressive selling activity (the red circle), and …
- …the Dom Level Indicator marks the level of a major buy limit order.
If this support level testifies to the bullish mode of the market, it should keep the price from falling and confirm the buyer’s strength. However, the price breaks the support level from top downward after some time.
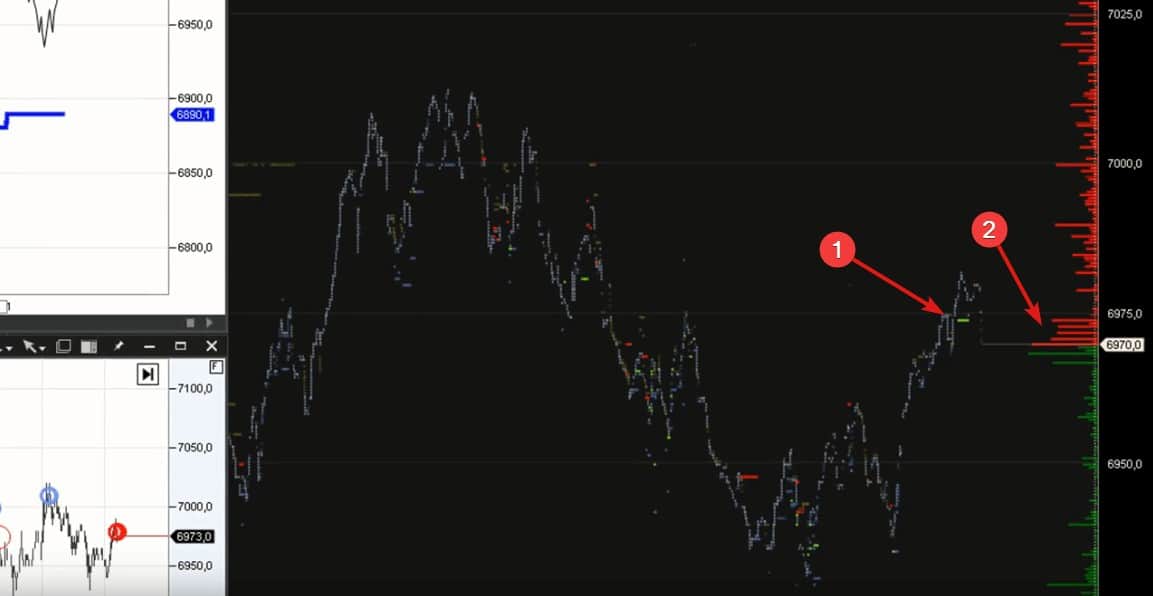
- The support level from a major buy limit order in the order book – broken from top downward
- The buy order grid accelerates reduction of quotes
Why the support level did not hold? Perhaps, there was a manipulation. The major trader showed a buy limit order and motivated a big number of minor traders to bull the market. However, alas and alack, they again experienced negative emotions and losses.
Summary
In this short but practically valuable article we discussed an interaction of clusters, Time and Sales Tape and order book.We hope that it was useful for you since you learnt about techniques used by major traders. These techniques are used in all markets and you can check it by yourself after analyzing a course of trading with the use of the functions of the trading and analytical ATAS platform.