
The Shooting Star pattern in candlestick analysis is a candle with a small body and a long upper shadow. Traditionally, a well-formed Shooting Star appears after a strong uptrend. The pattern should be seen as a signal that the trend may be reversing from bullish to bearish. It indicates a weakening of buying pressure and a rise in selling activity.
In practice, an oversimplified understanding of this pattern can lead to losses and frustration. Opening a short position immediately after spotting a Shooting Star without considering the context and additional confirmations is risky.
In this article, we will explore how to make better-informed decisions when trading the Shooting Star pattern by considering trading volume, overall market conditions, and additional insights from footprint charts.
What Does the Shooting Star Candlestick Mean?
The Shooting Star is a reversal pattern that signals a potential shift from a bullish trend to a bearish one. The candle’s shape resembles a falling star — with a long upper shadow and a small body near the bottom of the candle.
Below is an example of a Shooting Star observed on May 15, 2024, on the daily chart of Dow Jones futures:
- on the left is a classic candlestick chart, which only hints at a possible trend reversal;
- on the right is a footprint chart, providing detailed evidence of how the bullish trend shifted to bearish, at which levels, and with what dynamics.
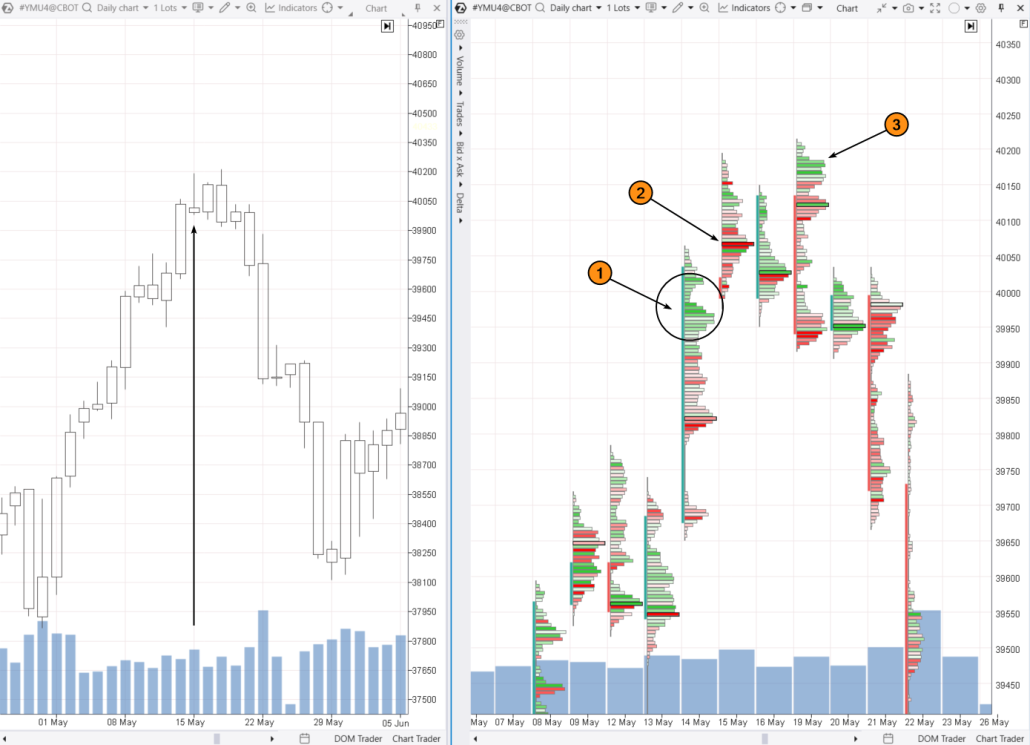
The footprint chart helps to model the situation in detail.
On May 14, buyers became more active, likely driven by bullish news. The bright green clusters indicate a surge in demand (1). The price broke above the psychological level of 40,000 points, igniting bullish enthusiasm among buyers.
The next day, the situation changed. The footprint chart clearly shows the point of control (2), where sellers took over, and the price closed below this level.
But did the buyers give up? No. After the weekend, the price moved up again — likely due to media coverage over the weekend, which highlighted the stock index’s promising outlook.
This move ended in a defeat for the bulls. We see significant market buys (3). On the one hand, those trading breakouts of the previous high went long. On the other hand, short positions were closed out by stop-loss orders placed above the Shooting Star.
However, the buyers found themselves trapped: the price initially dropped below the opening level and then fell below the low of the previous candle. The bright red clusters around the closing price indicate that intraday buyers were facing significant losses.
This example shows that the classic approach to trading the Shooting Star pattern — entering a short position with a stop above the pattern — can be risky. It also demonstrates that footprint charts provide a detailed view of the struggle between buyers and sellers. This way, you can lower your risk and find a more accurate entry point.
How to Spot a Shooting Star on a Chart
Below is a daily chart of oil futures.
Arrows mark three candles that have a long upper shadow and a small body near the bottom of the candle. Each of these candles has a bearish appearance.
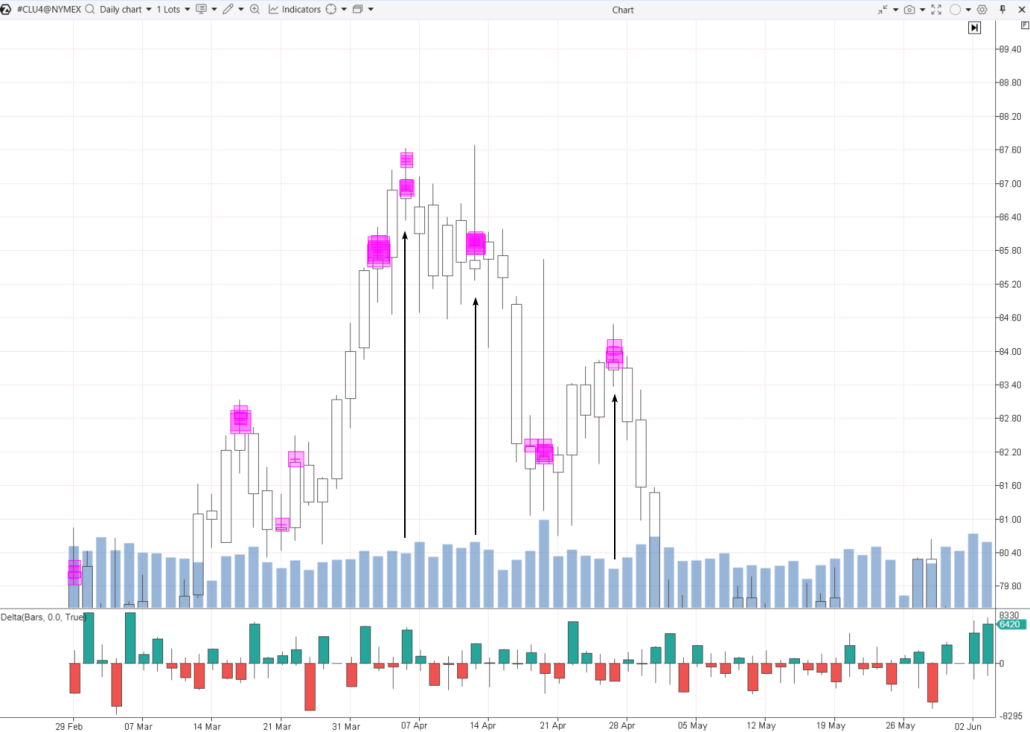
1. The candle from April 2, 2024, appears after a price increase. Among the three candles we are looking at, this one is closest to the ideal Shooting Star. It suggests a sharp change in sentiment, likely due to fundamental news from the Middle East.
2. This candle has a small body at the bottom and a long upper shadow. It appeared on April 11 after a period of trading within a range. Its purpose was to mislead remaining bulls and trap them before a price decline. Tom Williams, the creator of the VSA strategy, believed that smart money uses such patterns to weaken support levels (in this case, 84.60) before a bearish breakout. While the second candle visually meets the Shooting Star criteria, it appeared after a range and represents a different market situation.
3. This candle has the features of a Shooting Star. It appeared after several days of price increases and has the right shape, but there are a few nuances:
- The volume is low, likely indicating weak demand (VSA No Demand). Trading is slow due to a lack of buyers.
- Context. In this case, it is more accurate to view this as a test of the previously broken support at the 84.60 level, rather than a reversal from a bullish to a bearish trend.
What do the pink squares represent? These are generated by the Cluster Search indicator, which can be useful for identifying the Shooting Star pattern. Here, the pink squares appear if:
- clusters of buying with volumes above a certain threshold form within the candles;
- these clusters appear in the upper shadows of the candles.
You can adjust all these filters in the settings of the Cluster Search indicator.
Pros and Cons of the Shooting Star Candlestick Pattern
Pros:
✔ Easy to spot on a chart — this pattern consists of just one candle. Although experts like Morris, Bulkowski, and Nison also discuss a two-candle version of the Shooting Star, which we will explore in more detail below;
✔ Enables you to enter a short position relatively close to the market’s peak.
Cons:
✘ Subjectivity. Traders might question whether the shadow is truly long enough, if the body is small enough, or if the preceding price increase is significant enough.
✘ No guarantee of a downward reversal. The Shooting Star pattern could be a short-term pullback from a resistance level that the market hits while continuing its upward trend.
✘ Timeframe variability. On a 30-minute chart, you might see a bearish engulfing pattern, while on an hourly chart, it could be a Shooting Star. But can you identify a bearish reversal on a 15-minute or 45-minute chart? Or on a 4-hour chart? The interpretation can vary depending on where the price is when the candle closes on the chosen timeframe. The timing factor can lead to different readings of the same market.
✘ Risks. Suppose you decide to open a short position after spotting the pattern. But where should you place the stop-loss? Above the pattern’s high? The risk could be too great if the Shooting Star has a long shadow.
✘ Rarity. CandleScanner analyzed over 2 million candles on daily S&P 500 stock charts and found that the chance of a Shooting Star appearing is only 2.7%.
How to Mitigate the Drawbacks of the Shooting Star Pattern
- Wait for confirmation from the next candle — it should be bearish.
- Trade from resistance levels.
- Pay attention to volumes — higher volumes during the formation of a Shooting Star make it a more reliable reversal signal.
- Consider the broader fundamental context.
The most effective way to enhance your strategy when trading this pattern is to use a cluster chart (or footprint). We will dive into how to use it with examples later on.
Trading the Shooting Star Pattern Using Footprint Charts
Let’s explore some practical examples across different markets and timeframes, taking into account the context and insights provided by cluster charts and professional volume analysis indicators.
Classic Rules for Trading the Shooting Star
Step 1. Identify the pattern
A Shooting Star forms after an uptrend. The candle has a small body at the lower end, with an upper shadow that is typically at least twice the length of the body.
Step 2. Confirmation
The next candle should close below the body of the Shooting Star, confirming the trend reversal. Higher volume during the pattern’s formation strengthens the signal.
Step 3. Enter a short position
Enter a short (sell) position after the confirming bearish candle closes:
- Set a stop-loss above the high of the Shooting Star. The stop-loss should not reduce your capital by more than 2%.
- Take-profit can be set subjectively. This could be previous lows, levels identified using Fibonacci, or it could be calculated mathematically — such as being twice the distance to the stop-loss.
Position management. To lock in profits and reduce risks (trailing stop), you might consider partially exiting the position at intermediate support levels.
As shown in the first chart, trading by the classic rules can be disappointing. That is where footprint charts come to the rescue!
Example 1. Intraday Trading with the Shooting Star Pattern
Below is a candlestick chart of the S&P 500 futures with the Magnifier feature enabled.
To activate the Magnifier on the ATAS platform, press “M.” Then, hover your mouse over the candle you are interested in to view the trades inside it.
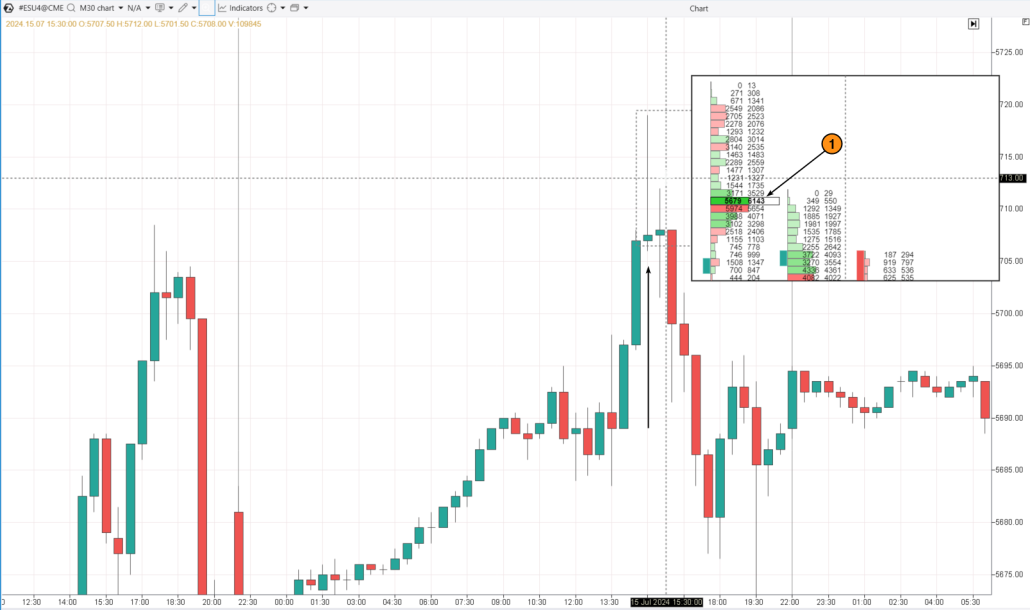
On July 15, 2024, the price was moving upward throughout the day. However, after surpassing the previous day’s high, the situation shifted. There was a sharp spike in buys (1), but the candle closed near its lows. It seems that buyers gave up at the breakout of the previous high, which led to the formation of a Shooting Star pattern.
In this case, the inverted hammer caused an intraday trend reversal from bullish to bearish. Using the footprint, a large green cluster can serve as a resistance level, enabling you to enter a short position on the next candle at that level. This approach is a much less risky way to trade the Shooting Star.
Example 2. Bullish Shooting Star Candlestick Pattern
The Shooting Star pattern is generally considered bearish, signaling a potential reversal from an uptrend to a downtrend. However, there are exceptions.
When the Shooting Star Turns Bullish
Thomas Bulkowski, a renowned expert in candlestick patterns, discovered that if a Shooting Star appears in an uptrend, following a large white candle, it indicates a continuation of the bullish trend in 61% of cases.

This perspective is also supported by other candlestick pattern researchers.
The confusion in interpreting the pattern often comes from the following:
- a single-candle pattern is bearish;
- a two-candle pattern often works as a bullish (for more information, refer to primary sources).
When a Shooting Star suggests a bearish reversal but that reversal does not materialize, it is reasonable to view the Shooting Star as a bullish pattern, as illustrated in the Litecoin chart below. The chart also includes the DOM Levels indicator, where red and green markers show large sell and buy orders from the order book.
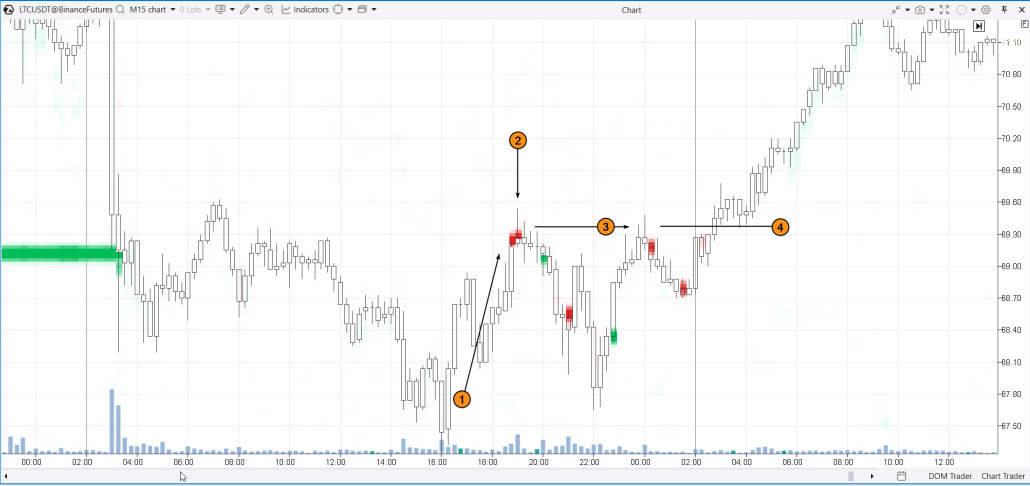
The chart shows the following:
After bouncing back from the day’s low (1), the price encountered a block of sell limit orders near the previous local highs (highlighted in red).
As buyers battled against this block, a Shooting Star candle formed on the chart (2), leading to an intraday decline towards the previous support level.
At midnight, another Shooting Star appeared at the same level (3).
However, the following downward move lacked strength, and buyers pushed through, breaking the 69.30 level, where two Shooting Stars had formed. Shortly after, the level was tested (4), and the price action indicated that it had now turned into support.
In other words, when the resistance from a Shooting Star is broken, it can become a support level for the bulls.
Example 3. Shooting Star Pattern in a Downtrend on Forex
We are looking at the euro currency futures from the CME exchange. Analyzing the futures market and the volume data provided by CME can give you a valuable edge in Forex trading.
In the screenshot below, the daily chart is on the left, and the 3-minute footprint chart is on the right.
The charts illustrate a downtrend (1) that lasted throughout the first 1.5 months of 2024.
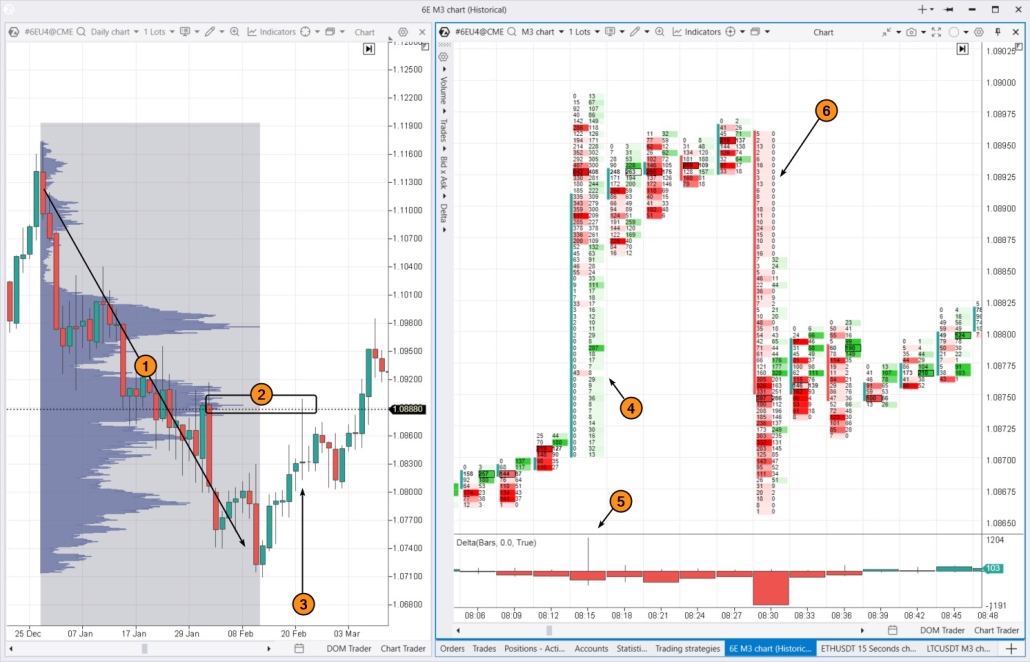
As the downtrend progressed, a significant volume level formed around the 1.089 price area (2). On February 21st, this level was tested, resulting in a daily candle (3) that matches the Shooting Star pattern.
A trader following the classic pattern might have considered opening a short position after several days of price increases.
However, a trader using volume analysis tools would have been ahead of the game :) as they were likely expecting (and waiting for) a test of the significant horizontal volume at the 1.089 level.
The 3-minute footprint chart offers more insight into how the test of the 1.089 level led to the formation of the Shooting Star on the daily chart:
4 — the price surged sharply due to the absence of sellers (zeros in the sell market orders column);
5 — the Delta candle closed in negative territory, indicating the presence of sellers near the candle’s high;
6 — a shift in sentiment occurred: buyers disappeared (zeros in the buy market orders column), causing the price to drop sharply.
These events unfolded amid two economic news releases in the Eurozone, just 15 minutes apart.
The example above highlights the importance of:
- analyzing key levels on the daily chart;
- keeping up with economic news. ATAS offers a built-in Economic Calendar — just click the button in the main menu to access it;
- reading footprint charts to better understand market sentiment shifts;
- not relying solely on traditional candlestick patterns — in the scenario discussed, the bearish pattern within a downtrend on the daily chart probably would not have been profitable for short selling.
Example 4. How to Confirm a Shooting Star Pattern
The chart below shows the BNB/USDT market, data from Binance Futures. In this case, the pattern we are interested in formed as the price attempted to break through the psychological level of $600 per 1 BNB.
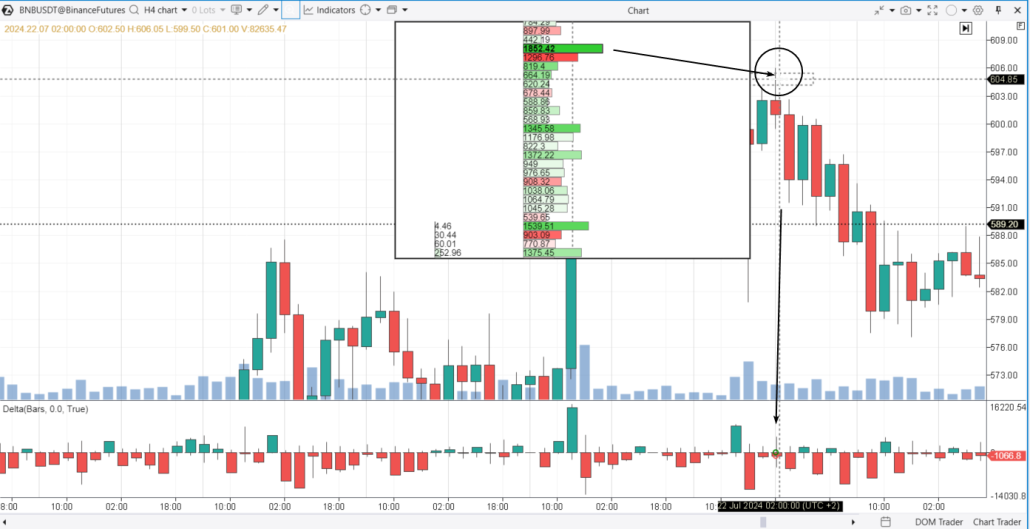
Arguments supporting a bearish reversal when this pattern appears are provided by:
✔ the Delta indicator (at the bottom), which initially shows a significant gap between market buys and sells, followed by a sharp drop;
✔ the footprint chart analysis, where bright green clusters highlight levels where impulsive buyers became trapped.
Comparison of the Shooting Star with Other Candlestick Patterns
Shooting Star vs. Inverted Hammer
The Inverted Hammer appears after a downtrend and signals a possible upward reversal. Like the Shooting Star, it has a long upper shadow and a small body, but it forms in a different market phase and indicates the opposite trend.
Shooting Star vs. Hanging Man
The Hanging Man forms at the end of an uptrend and also suggests a potential downward reversal. It has a long lower shadow and a small body. The main difference from the Shooting Star is in the placement and direction of the shadow.
Is the Shooting Star a Doji Candle?
The Shooting Star is not a Doji candle. While the Shooting Star has a small body and a long upper shadow, a Doji is defined by a very small or non-existent body, with the opening and closing prices being nearly identical, which reflects market indecision.
FAQ
Is the Shooting Star pattern bullish?
No, the Shooting Star pattern is not bullish. It forms after an uptrend and typically signals a potential reversal to the downside, indicating a possible price drop. The long upper shadow serves as a warning that higher prices are being rejected by market participants.
However, as discussed earlier in Example 2, there are exceptions where the Shooting Star might be interpreted as bullish.
Is a green Shooting Star bearish?
Yes, a green Shooting Star is still considered bearish. The key is the shape and position of the candle, not its color. The pattern suggests a potential downward reversal after an uptrend, whether the candle is green or red.
Which time frame is best for spotting a Shooting Star?
The daily time frame is considered to be the best. Candlestick patterns were originally designed for daily charts, as intraday charts can be noisy, making analysis more difficult and signals less reliable. However, traders can effectively use this pattern on other time frames (hourly, 4-hour, and even lower) by incorporating footprint charts, volume indicators, and additional factors and filters to improve accuracy.
How profitable is trading with the Shooting Star pattern?
According to research by candlestick pattern expert Thomas Bulkowski, the Shooting Star pattern has a 59% probability of leading to a bearish reversal.
Research conducted by CandleScanner, which analyzed daily charts of S&P 500 stocks from 1995 to 2015, found that:
- the Shooting Star pattern gives a false signal in 18.7% of cases;
- the probability of making a significant profit ranges from 27.4% to 36.4%.
How to Profitably Trade Candlestick Patterns
While the Shooting Star pattern is popular among traders for the potential to enter a short position near the market peak, it is important to be cautious if you are relying solely on this pattern for your strategy.
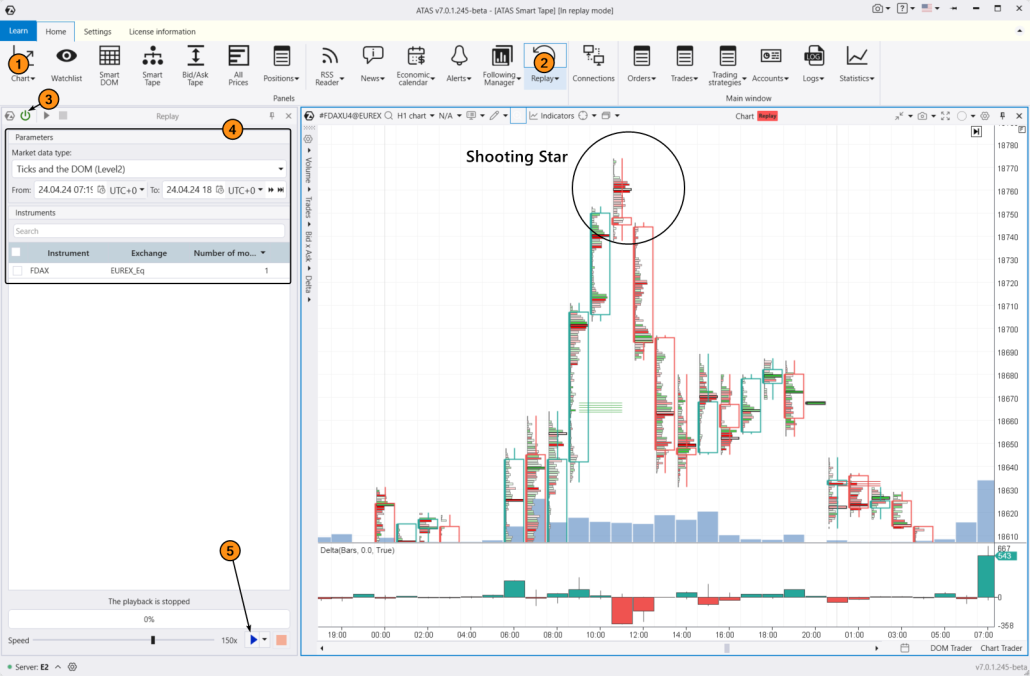
To assess how successful your trend reversal trading experience might be, use the ATAS Market Replay feature. This ATAS platform feature recreates real-time trading conditions using historical data.
Traders can sharpen their skills in real market conditions without any financial risk and practice using footprint charts to improve their trading effectiveness.
To try the simulator, download the ATAS platform for free, install, and launch it, and then:
- Open a chart of a financial instrument.
- Click on the Market Replay button in the main ATAS menu.
- Activate the Replay mode (the icon should turn green).
- Configure the settings (date, data type).
- Start playback and watch for the familiar candlestick patterns. Look for confirmation on the footprint chart or with indicators.
When practicing trading patterns in the Market Replay simulator, you can:
- adjust the playback speed, and pause;
- analyze footprint charts;
- use over 400 indicators (for instance, Cluster Search can help identify a Shooting Star);
- use Chart Trader and other features to trade on the built-in demo Replay account and then analyze your performance;
- use drawing objects, for example, mark support and resistance levels;
- use different chart types, though classic candlestick patterns are best suited for standard timeframes.
- use exit strategies;
- do much more to master identifying Shooting Stars.
ATAS enables you to load tick data history from cryptocurrency, stock, and futures markets, giving you a comprehensive base to find patterns in price-volume interactions and refine your own trading strategy.
Conclusions
The Shooting Star pattern is a popular candlestick model, but its trading comes with risks. As a reversal pattern, it suggests entering a position against an uptrend.
To gather enough evidence for opening a short position, we recommend complementing your candlestick analysis with professional volume analysis tools, such as cluster charts, the Delta indicator, market profiles, and others.
Download ATAS. Once you install the platform, you will automatically get the free START plan, which includes cryptocurrency trading and basic features. You can use this plan for as long as you like before deciding to upgrade to a more advanced plan for additional ATAS tools. You can also activate the Free Trial at any time, giving you 14 days of full access to all the platform’s features. This trial allows you to explore the benefits of higher-tier plans and make a well-informed decision about purchasing.
Do not miss the next article on our blog. Subscribe to our YouTube channel, follow us on Facebook, Instagram, Telegram or X, where we publish the latest ATAS news. Share life hacks and seek advice from other traders in the Telegram group @ATAS_Discussions.
Information in this article cannot be perceived as a call for investing or buying/selling of any asset on the exchange. All situations, discussed in the article, are provided with the purpose of getting acquainted with the functionality and advantages of the ATAS platform.


