
What level breakout trading is based on
Breakout trading is an approach in which a trader focuses on price movements through key support or resistance levels. The strategy is based on the assumption that if the price breaks through a support or resistance level, there is a possibility that the price will continue moving in the same direction. Level building can be quite subjective. Different guidelines are used for this:- previous extremum points;
- psychological meanings of prices;
- patterns of technical analysis;
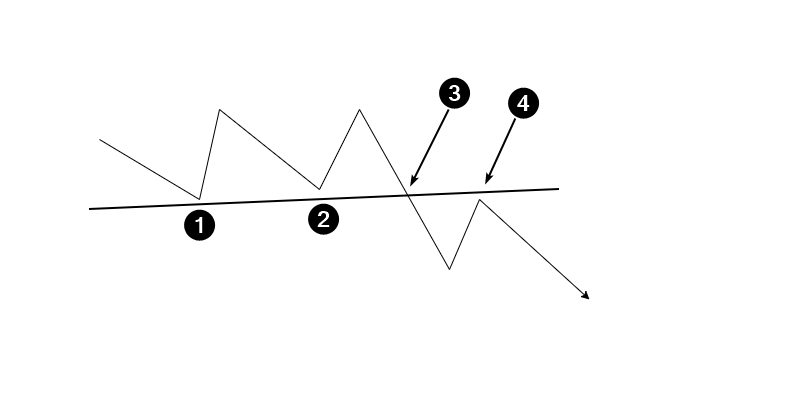
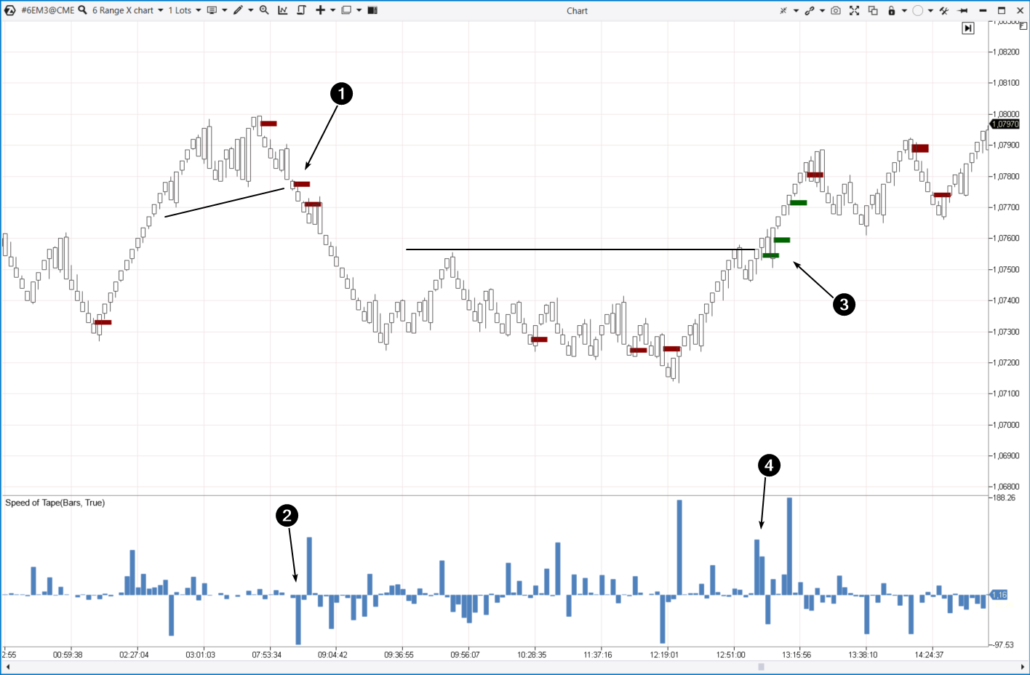
- 1 and 2 — local lows for building support;
- 3 — a bearish breakout of the support level;
- 4 — a breakout test (it is not always formed).
Idea of the pattern
The idea of a breakout is to disrupt the balance of supply and demand. Suppose that in the market, the forces of buyers and sellers were balancing each other out for a period of time. At the same time, the price was forming a trading range (was flat). The boundaries of a formed range (or a technical analysis pattern) usually define support and resistance levels. Let’s continue to develop the hypothesis. Under the influence of some negative factors, buyers weakened, sellers became more active, and the price began to fall. At the same time, there was a breakout of the support line — market participants reached a consensus that the price for the asset is too high, and the fair price is lower. At this moment, sellers become very active, which leads to a breakout.How to identify a breakout using volume indicators
Experienced traders may notice that:- when the price is about to break through a level, the trading volume usually increases as it approaches that level;
- before a true breakout occurs, there is usually a false breakout (a deceptive maneuver) in the opposite direction;
- breakouts occur rapidly, leaving little time for traders to analyze and enter a position at a bargain price. Moreover, opening a trade in the direction of a breakout, a trader may feel emotional discomfort due to the potential of buying at a high price or selling at a low one.
- Stacked Imbalances shows the dominance (imbalance) of one of the parties by analyzing several price values in a row. The imbalance usually occurs in the breakout area. This indicator can also be used for money management, as will be shown below.
- Speed of Tape in delta mode will give evidence of increasing pressure of one of the parties over time.
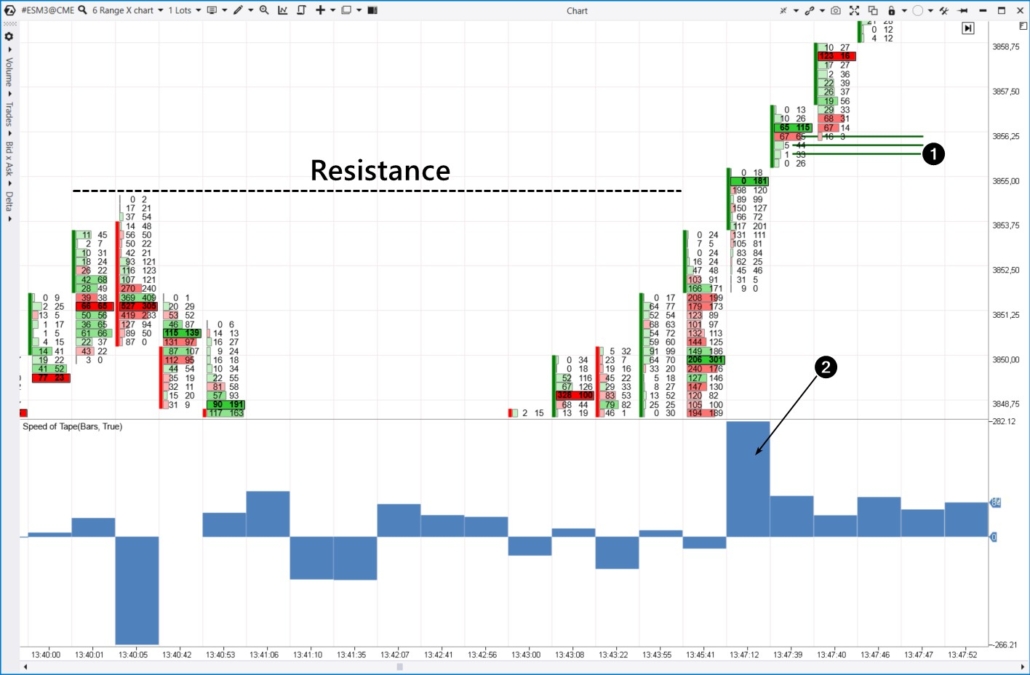
- Dominance of buyers over sellers (1), which is noticeable by the difference between bought (in the right column) and sold (in the left column) contracts at several price values. The green bars of the Stacked Imbalances indicator show this situation.
- Trade execution speed (2). The Speed of Tape indicator is a unique development of ATAS programmers. It does not follow a theoretical formula, but it can be a valuable instrument in practice.
S&P-500 Example 1. Futures on the S&P-500 index
The Stacked Imbalances indicator allows you to look for imbalances between buyers and sellers without looking inside the candles. This allows you to control the bigger picture, evaluate the interaction of price and indicator signals.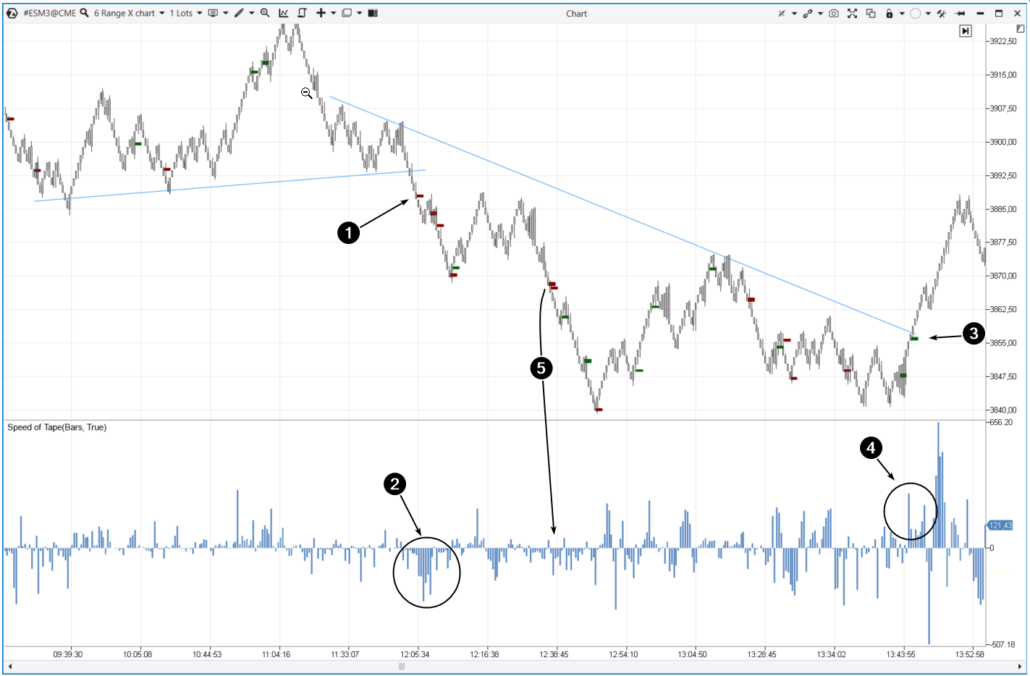
Example 2. Euro futures
Example 3. Cryptocurrency market. Litecoins
The range chart below from the Binance Futures exchange shows how the market stabilized after rising above $85 per coin. This is indicated by the bell-shaped profile, which suggests that supply and demand are balanced. You can build a resistance level near the upper border of the bell and a support level near the lower border. Later, the price was influenced by negative factors and began to decrease. The signal of the Imbalances indicator (1) appeared on the chart, and the Speed of Tape indicated an acceleration of the selling pressure. There was a bearish breakout.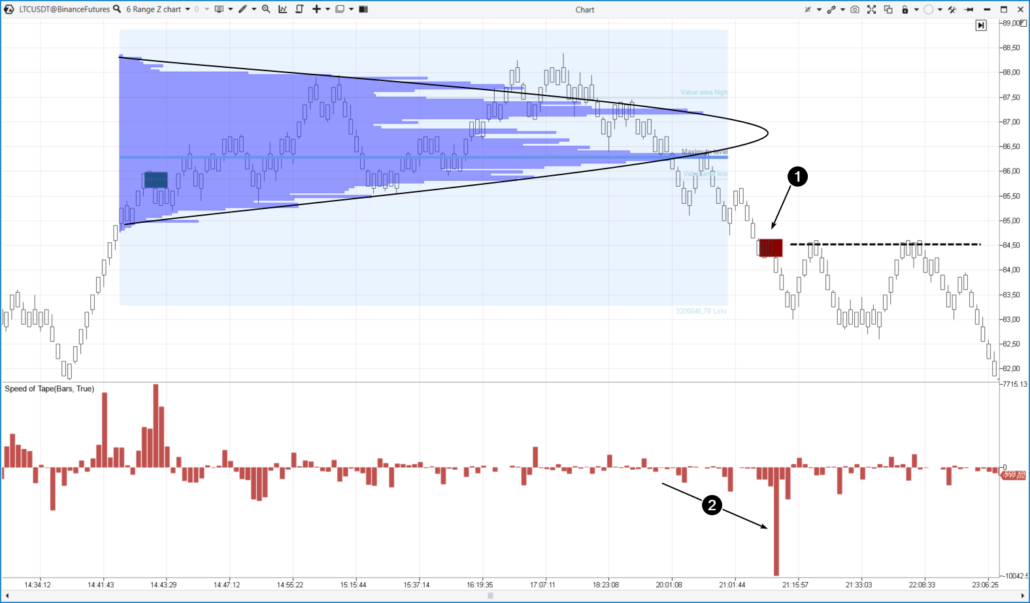
How to trade breakouts, strategy development
It is important to understand that Stacked Imbalances, Speed of Tape or any other indicator cannot give accurate signals that guarantee profit. Each trader is personally responsible for choosing the appropriate indicators and configuring their settings.
However, there are some general steps that can help you build a strategy for trading level breakouts, regardless of which indicators and settings are chosen: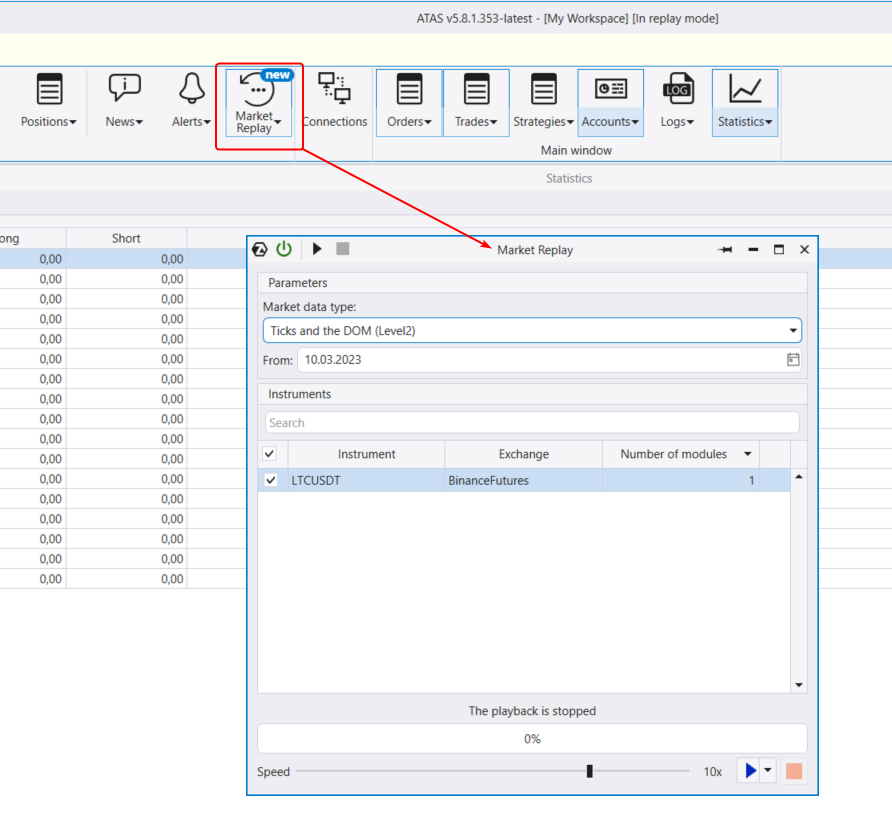
Useful links
You can find more useful information on the topic at:- Four ideas for trading on breakouts
- Strategy of trading false breakout with market profile
- Video. What are buyers and sellers doing during the level breakout?
- Market Replay, how to use
Conclusions
Breakout trading has its advantages and disadvantages. The main advantage is that by successfully entering a breakout trade, you can significantly increase your capital if an important trend follows after the breakout. The disadvantages are:- most breakouts are false;
- opening a position involves an emotional burden.
- indicators like Stacked Imbalances, Speed of Tape (and / or other indicators) will help you confirm the breakout;
- non-standard types of charts and footprints to create unique charts that best suit your strategy;
- Market Replay — practice breakout trading without risking your capital.
- allows you to download tick history from the futures, stocks and cryptocurrencies markets;
- offers many benefits for traders who want to combine breakout trading with easy-to-use cluster charts and useful indicators.
Information in this article cannot be perceived as a call for investing or buying/selling of any asset on the exchange. All situations, discussed in the article, are provided with the purpose of getting acquainted with the functionality and advantages of the ATAS platform.


