Popular time-frames: 1 minute (M1), 5 minutes (M5), 1 hour (H1), 1 day (D) and so on.
Besides, signals for executing trading activity are usually identified after closing the next bar or time period. For example:
- If the hourly bar is closed above the level, a trader will buy.
- If the hourly bar is closed below the level, a trader will sell.
The problem of this approach is that it doesn’t take into account an important market feature – volatility.
Disadvantages of classical time-frames
The market volatility is the price ability to change. Depending on these changes, the difference between the candlestick high and low may differ by several times.Volatility could be low for several days, then the signal candles will be narrow. Signal candles expand when volatility grows.
Entry points could be close to the levels when volatility is low and will be farther from the levels when volatility is high.
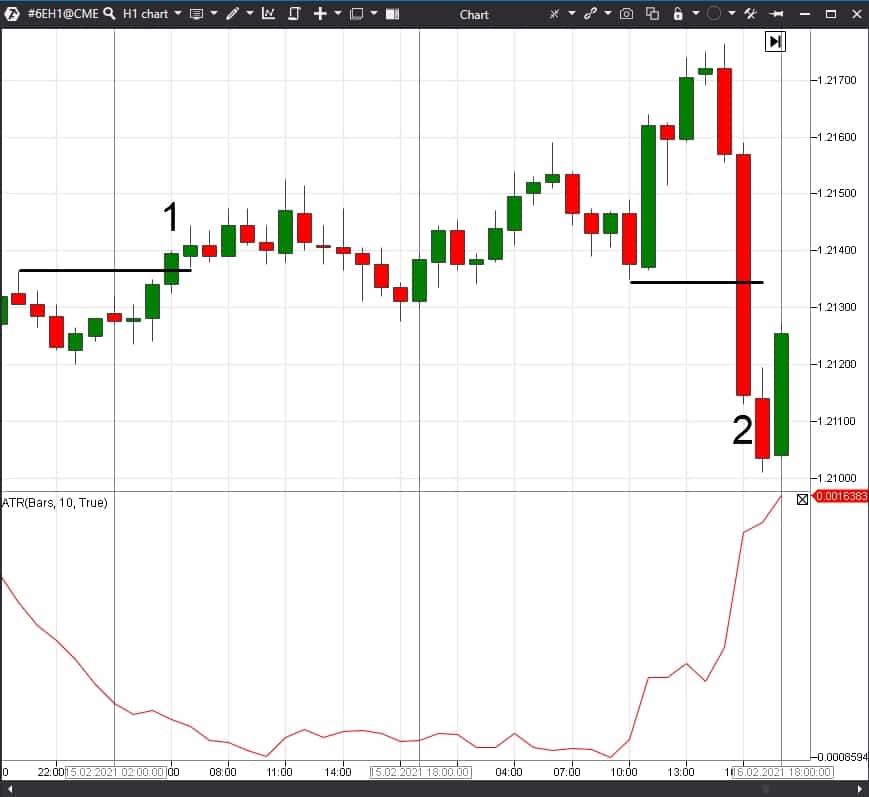
The same is true about stop loss sizes. If the trading strategy envisages stop loss posting after the breakout candle, the candlestick size exerts influence on how far it is posted. In the event of wide stop losses under conditions of high volatility, a trader may need even to reduce the trade volume or to refuse from the trade with a far stop loss.
How to solve this problem?
As a variant, to use charts with non-standard periods in trading.
For example, Range.
Finding a market entry point using the Range chart
Building candles in the Range charts is not connected with time. A new candle appears in the chart when the price passes a certain distance in ticks.This method of chart building allows filtering out the market noise. If the price doesn’t move in a certain direction, new candles will not be formed in the Range chart, while a standard chart may form several small candles and even send some trading signals.
The Range chart allows filtering out false trading signals. This chart is especially useful for intraday trading.
Let’s analyse an example of finding optimum entry points with the help of the Range chart.
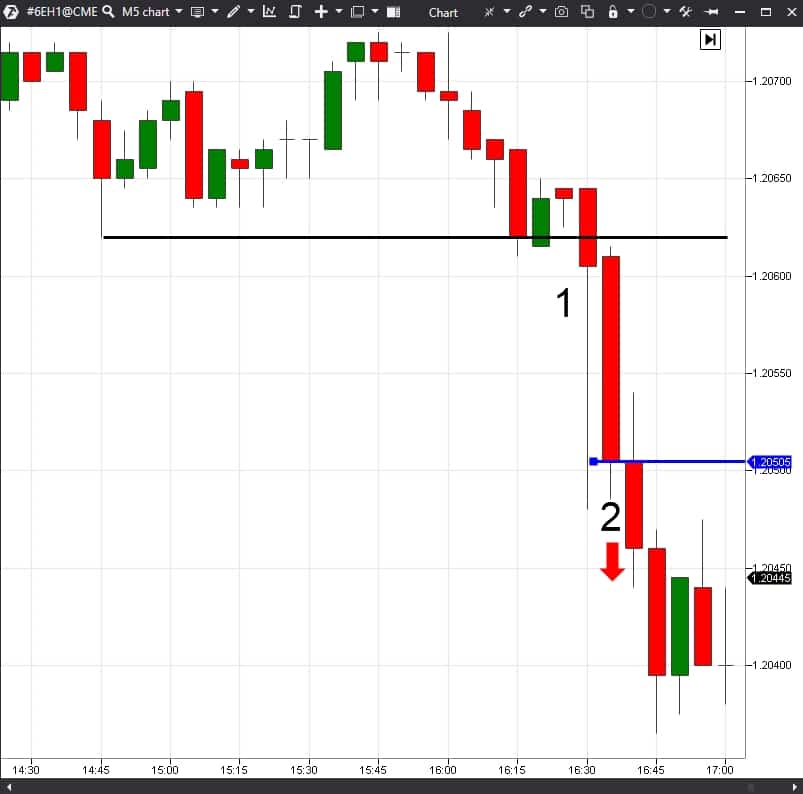
First, let’s have a look at the entry point in 5-minute time-frame by the classical breakout trading strategy.
Let’s consider the same market section but using the 8 Range chart:
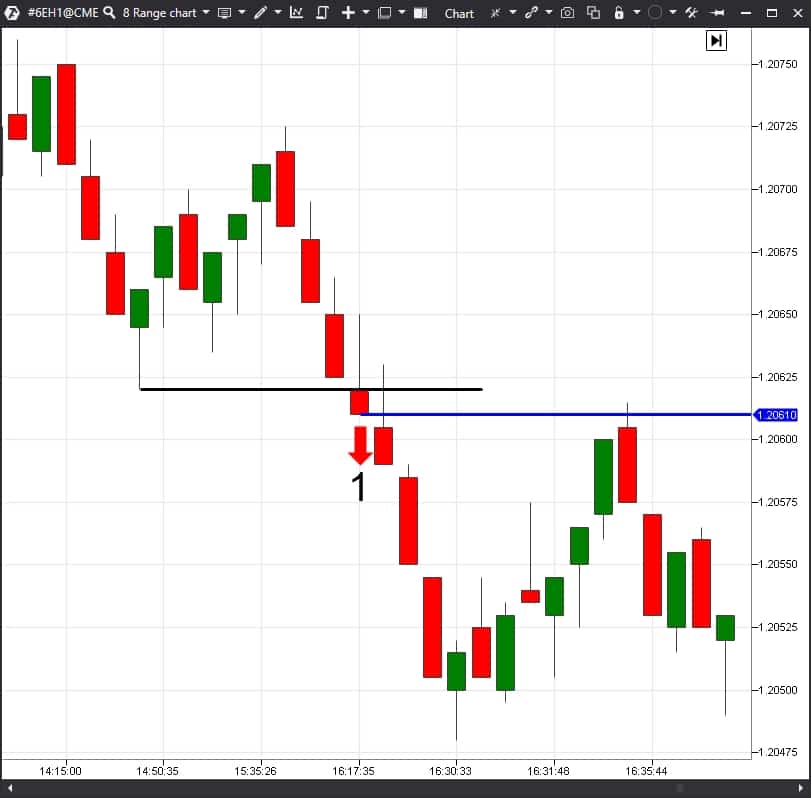
Of course, such a big difference in entry points doesn’t always take place. But very often the Range chart allows entering at a better price than the classical time-frame chart. Especially big difference takes place when volatility increases in the market.
Posting a stop loss with the help of the Range chart
Finding the right place for posting a stop loss is very important for profitable trading. A too close stop loss will be often activated by the market. A too far stop loss increases the risk and also makes the reward to risk ratio worse. How to solve the problem?The Range chart will help you. A trader can use it for finding the most optimum place for a stop loss:
- relatively close to the entry point;
- so that the market doesn’t activate it too often.
Let’s consider an example.
The stop loss location in the 5-minute chart:

Let’s consider the same market section in the 8 Range chart.
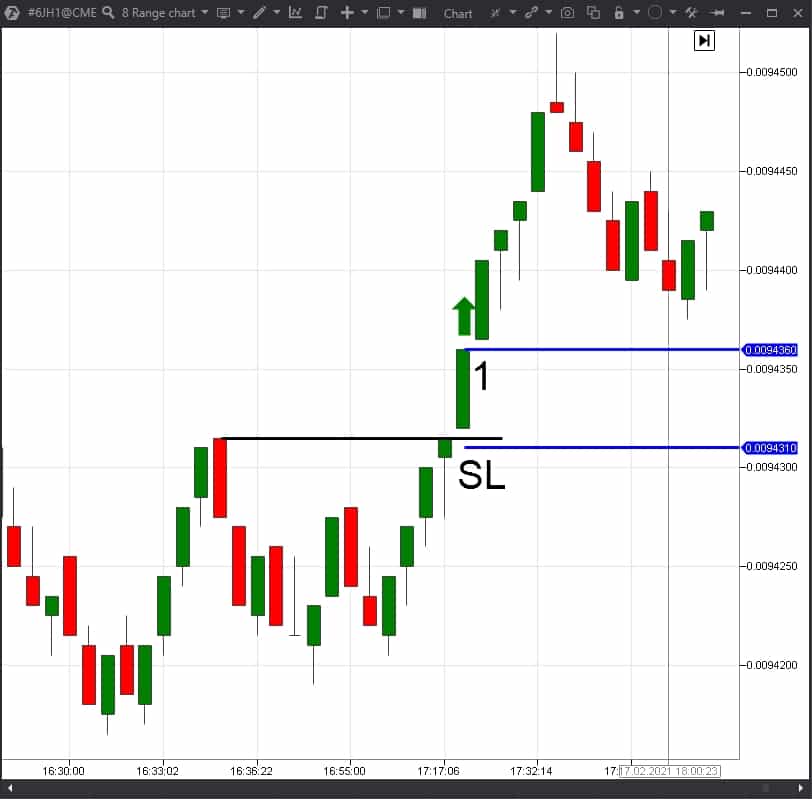
Thus, the Range chart allows finding more optimum places for posting stop losses. The difference is especially big when the market volatility increases.
You can select individual Range chart parameters, which would allow more efficient trading, for every instrument. The more volatile the instrument, the bigger the Range chart parameter should be.
Conclusions. What to do in practice?
So, it is important to understand that:- The charts built on time periods do not take into account the changing market volatility.
- The Range charts from the trading ATAS platform could be used to take into account volatility.
- The Range chart allows finding a more accurate entry point when the market volatility increases.
- The Range chart allows decreasing the distance of stop loss posting.
- Simultaneous use of classical charts together with Range charts can increase trading efficiency.
Look at the market from different angles and it will help you to stay on the positive side!
You can find more useful information in the following articles:
- Examples of reading the Footprint in the Range chart.
- Advantages of the Range XV chart.
- Who activates your stop losses. Why and how?
- Looking for the entry point.
Information in this article cannot be perceived as a call for investing or buying/selling of any asset on the exchange. All situations, discussed in the article, are provided with the purpose of getting acquainted with the functionality and advantages of the ATAS platform.