

The S&P 500 index is a calculated value that reflects the stock prices of approximately 500 large companies traded on U.S. stock exchanges. This index is calculated by S&P Dow Jones Indices, a subsidiary of S&P Global, and serves as an important tool for both analysts and traders. For analysts, the S&P 500 is a key indicator of economic conditions, while for traders, it provides an opportunity to profit from the price fluctuations of the stocks included in the index.
What is the S&P 500 Index?
The S&P 500 (sometimes written as SNP 500) is a stock market index that includes the stocks of 500 of the largest U.S. companies based on market capitalization. It’s important to note that, in practice, the number of companies may vary between 500 and 505, depending on market conditions. In addition to the S&P 500, S&P Dow Jones Indices calculates several other indexes:
- S&P 100 — includes the 100 largest U.S. companies.
- S&P MidCap 400 — an index of 400 medium-sized companies.
- S&P SmallCap 600 — includes 600 smaller companies.
- S&P Composite 1500 — combines the S&P 500, S&P MidCap 400, and S&P SmallCap 600.
The Role of the S&P 500
The S&P 500 index serves as a benchmark for evaluating the performance of the U.S. stock market, as it covers more than 80% of the total market capitalization. By including companies from a wide range of industries, it provides a balanced view of the economic landscape. In contrast to the Dow Jones Industrial Average, which includes only 30 companies and no longer fully reflects the U.S. economy’s dynamics, the S&P 500 offers a more accurate and current representation.
Why is the S&P 500 important?
The index helps investors and analysts understand the overall behavior of the U.S. stock market, as it encompasses the largest companies across various sectors, including technology, healthcare, finance, and consumer goods.
Compared to other indexes like the Nasdaq 100, which primarily focuses on the tech sector and excludes financial companies, the S&P 500 provides a more balanced view of the economy.
Historical Chart of the S&P 500 Index
Officially, the S&P 500 index was launched on March 4, 1957, with an initial value of 44.06 points.
However, historical data for the index is available from earlier periods, dating back to January 1928. This is because the Standard Statistics Company first calculated an index consisting of 233 companies in 1923. In 1926, the company began publishing weekly values for an index made up of 90 stocks—this index is considered the predecessor to the S&P 500, which was formed when the number of stocks was expanded from 90 to 500.
The historical chart with a logarithmic price scale (shown below) illustrates that the S&P 500 index has been in a steady upward trend for nearly 100 years. This is highlighted by an ascending trend channel, with the base of the channel located during the price decline of 1921-1932 (the Great Depression). After the index value broke through the resistance level (which had been relevant until the early 1980s) around 120 points, it has not dropped back to the lower boundary of the channel.
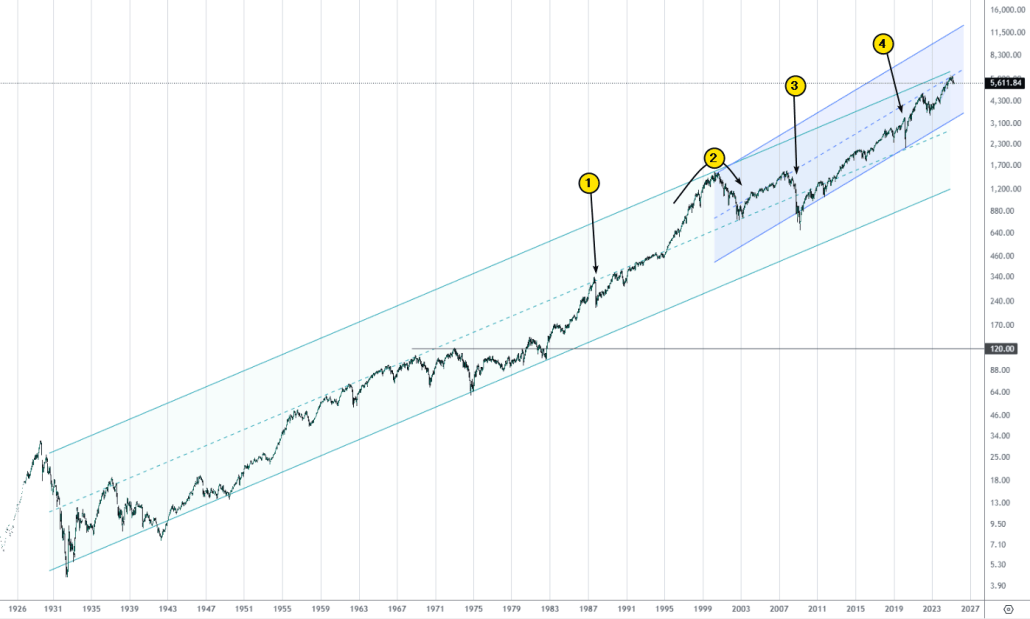
However, the historical rally has not been smooth:
- Black Monday, October 19, 1987: The most significant drop in history, with the S&P 500 losing 20.5% of its value in just one day.
- Dot-com Bubble: In the late 1990s, the S&P 500 experienced significant growth, driven by investments in technology stocks. However, when the bubble burst in 2000, the index suffered a sharp decline, dropping to the median of the trend channel.
- 2007–2009 Financial Crisis: The index’s decline began with the collapse of the U.S. housing market, followed by a banking crisis that led to a severe global recession. As seen on the historical chart, the S&P 500 fell by about 57% from October 2007 to March 2009.
- COVID-19 Pandemic: The long-term bull market (2009-2020), one of the longest and most stable in history, was interrupted in March 2020 due to the COVID-19 pandemic. At that time, the S&P 500 sharply declined, losing more than 30% of its value in a few weeks. However, the stimulus measures introduced by central banks and governments helped fuel the recovery.
Looking specifically at the 21st century, it’s worth noting a new channel (shown in blue) with a steeper growth angle. On one hand, this indicates the steady growth of the U.S. economy; on the other, it suggests increasing risks of crisis events.
How the S&P 500 Index Works
The S&P 500 index is composed entirely of stocks from U.S. companies that are traded on American stock exchanges, such as the NYSE and NASDAQ. The exact number of tickers can exceed 500.
The S&P 500 is calculated and updated in real-time throughout the trading day, allowing investors to see the current market condition. Additionally, S&P 500 futures (discussed in more detail below) enable investors to gauge market sentiment 24/5 (with brief interruptions), even during periods when the main trading sessions on the NYSE and NASDAQ are closed.
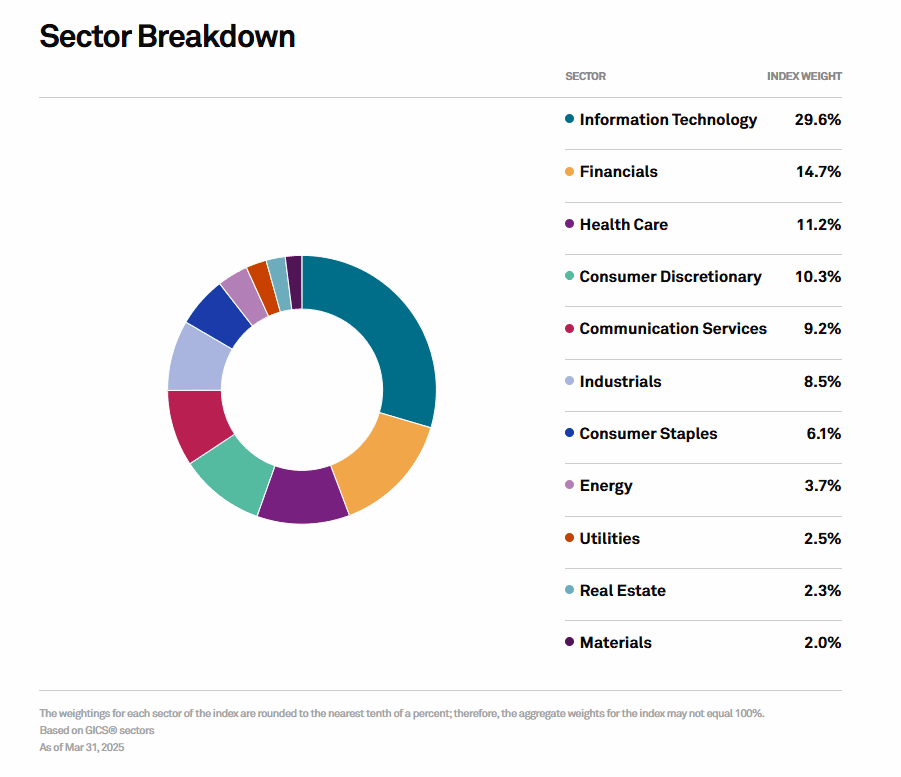
The S&P 500 includes companies that are divided into 11 sectors. Typically, the Information Technology sector holds leadership positions, with its weight in the index often rising to 30% or more.
When the index shows growth, it is a positive indicator of the overall development of the U.S. economy. Investors can make comparisons to assess which sectors are leading the growth and which are lagging behind.
Sector Overview of the S&P 500 Index
Energy. The Energy sector is sensitive to fluctuations in oil prices. It tends to perform well when oil prices rise.
Examples of companies: Exxon Mobil (XOM), Chevron (CVX).
Materials. This sector is highly dependent on the economic cycle, thriving during periods of economic growth when there is an increased demand for construction and manufacturing.
Examples of companies: Dow (DOW), DuPont (DD).
Industrials. A capital-intensive sector that also depends on the economic cycle. It tends to grow during times of economic expansion.
Examples of companies: Boeing (BA), Caterpillar (CAT).
Consumer Discretionary. One of the most volatile sectors. It generally grows quickly during periods of economic prosperity when consumers are willing to spend more on non-essential goods.
Examples of companies: Amazon (AMZN), Nike (NKE).
Consumer Staples. This sector is relatively resilient to economic downturns, as products like food, beverages, and household goods are always in demand.
Examples of companies: Procter & Gamble (PG), Coca-Cola (KO).
Health Care. Less affected by economic cycles, as healthcare services and medications are in demand regardless of economic conditions.
Examples of companies: Johnson & Johnson (JNJ), Pfizer (PFE).
Financials. Highly sensitive to interest rates and overall economic conditions. While financial sector stocks can rise quickly during a bull market, they also face significant risks during financial crises.
Examples of companies: JPMorgan Chase (JPM), Goldman Sachs (GS).
Information Technology. One of the most dynamic and fast-growing sectors, consistently holding a large share within the S&P 500 index.
Examples of companies: Apple (AAPL), Microsoft (MSFT).
Communication Services. This sector reflects changes in communication methods and content consumption, heavily influenced by technological innovations.
Examples of companies: Google (Alphabet) (GOOGL), Facebook (Meta Platforms) (META).
Utilities. A stable sector, less susceptible to volatility, as utility services are essential and cannot be easily discarded.
Examples of companies: Duke Energy (DUK), Southern Company (SO).
Real Estate. Sensitive to interest rate changes, the real estate sector can provide stable income through rental payments but is also at risk during recessions.
Examples of companies: Simon Property Group (SPG), Welltower (WELL).
Composition of the S&P 500 Index
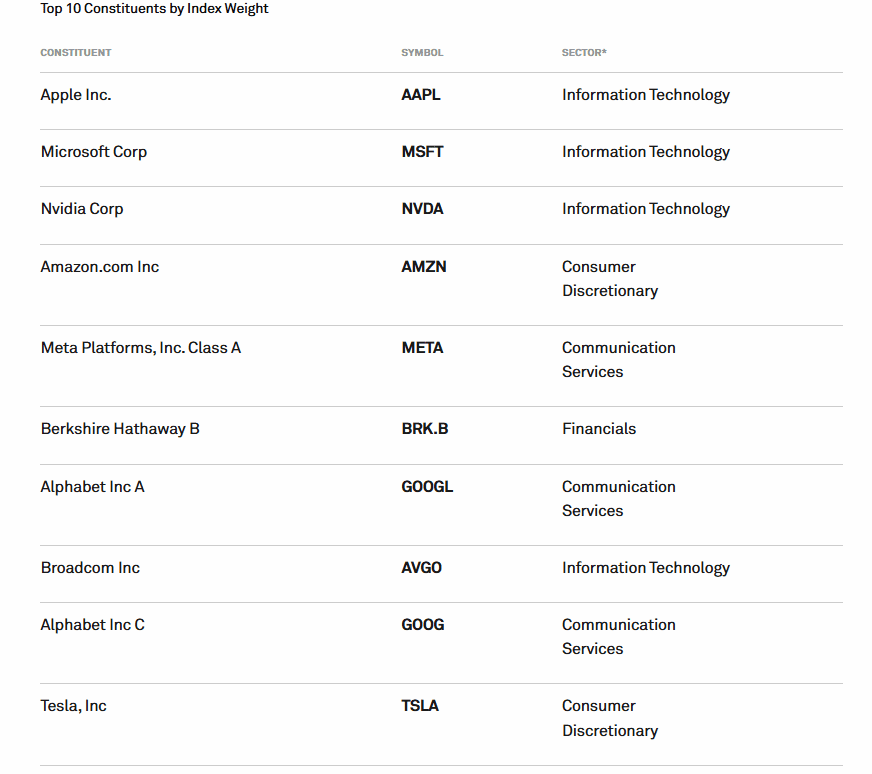
The weight of the number 1 company can reach around 7% of the overall index, while the combined weight of the top 10 companies can exceed 30%.
Management of the S&P 500 Index
The management of the S&P 500 index is overseen by the Index Committee at S&P Dow Jones Indices. The committee’s responsibilities include:
- Reviewing the composition of the index to ensure that the S&P 500 accurately reflects the current state of the stock market.
- Rebalancing the index to account for corporate events such as mergers, acquisitions, stock splits, and other changes.
- Analyzing inclusion criteria: The committee defines and maintains the criteria for adding companies to the index, such as market capitalization, stock liquidity, and geographic location.
- Ensuring transparency and fairness.
An important task of the committee is to replace underperforming companies in the S&P 500 with newer, more successful companies that meet the established criteria. Companies are selected based on factors such as market capitalization, liquidity, free float of shares, and other considerations.
Typically, the index composition is reviewed by the committee quarterly, although changes can be made on an emergency basis. This “manual” selection process differentiates the S&P 500 from indexes like the Russell, where stocks are included based on a formula. It is often believed that when a company is added to the index, its stock price tends to rise, as funds tracking the S&P 500 will purchase shares of the newly added company.
Calculation Formula
The S&P 500 index is a market-capitalization-weighted index. This means that the higher the market capitalization of a company, the greater its contribution to the value of the S&P 500. Consequently, companies with higher market values have a more significant influence on the index’s movement.
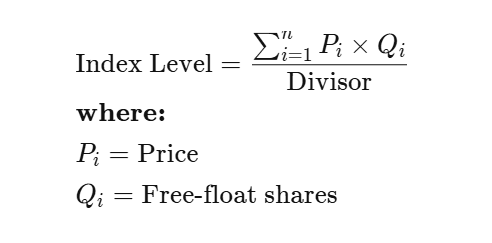
The formula for calculating the S&P 500 index is as follows:
- P – the current market price of a stock;
- Q – the number of outstanding shares.
The product of P * Q gives the market capitalization of each company.
Divisor – a special adjustment factor used to accurately account for corporate events (such as stock splits, issuance of new shares, mergers, and acquisitions), ensuring the continuity of the index and the comparability of its values over time. The divisor is adjusted as needed.
How to Invest in the S&P 500 Index
Given that the value of the S&P 500 index tends to grow over the long term, investing in a basket of stocks that make up the index can be an attractive option. However, buying all 500 stocks that are part of the index is a labor-intensive and capital-intensive process that requires significant time and effort.
A simpler solution is to invest through an ETF (Exchange-Traded Fund). For example, the SPDR S&P 500 ETF Trust (SPY) is an ETF that tracks the composition of the S&P 500 index. By purchasing a share in this or a similar ETF, investors can benefit from the growth of the S&P 500, as well as dividends paid by the companies included in the index.
Other options include mutual funds and index funds. These investment vehicles offer a more hands-off approach to gaining exposure to the S&P 500 index.
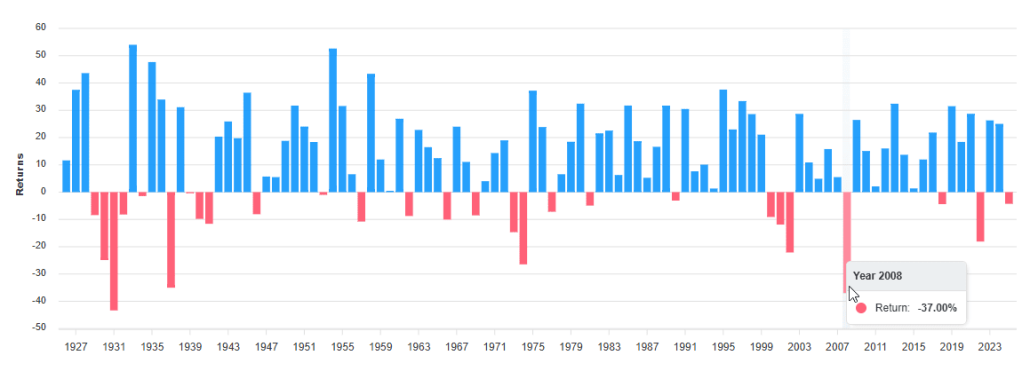
Historical Performance of the S&P 500 Index
On average, the S&P 500 index grows by about 10% per year. However, history shows that investors should be prepared for significant declines as well—such as the 37% drop in 2008, which was caused by the global financial crisis.
It is widely believed that only highly skilled investors (like Warren Buffett) are capable of consistently outperforming the S&P 500 over the long term. Buffett himself has repeatedly recommended that investors avoid trying to outsmart the market and instead make steady investments in instruments that track the S&P 500.
Risks and Benefits of Investing in the S&P 500
| Benefits | Risks and Drawbacks |
| Diversification: By investing in the S&P 500, you are indirectly investing in 500 different companies, which helps reduce the risk associated with investing in individual stocks. | Market Fluctuations: The value of investments can change significantly in a short period due to market volatility. |
| Accessibility: Tools like ETFs make it easy for even beginners to invest in the index, providing a simple and straightforward way to gain exposure to a broad range of companies. | Management Fees: ETFs and mutual funds charge management fees, which can reduce overall returns. |
| Historical Growth and Predictability: The historical performance of the S&P 500 has shown consistent growth, offering a degree of predictability for future returns, based on past trends. | Lack of Control Over Stock Selection: Investors have no control over the choice of stocks in the index, as the composition is determined by the committee. |
| Liquidity: Stocks and funds that track the S&P 500 are highly liquid, meaning they can be easily bought or sold in the market. | Acceptability of Returns: Not all investors may find the demonstrated returns acceptable, especially during periods of lower-than-expected performance. |
| Passive Income: Investing in the S&P 500 can be a “buy and forget” strategy, allowing investors to generate passive income over the long term without needing to actively manage their investments. | Exposure to Systematic Risk: Since the S&P 500 represents a large portion of the U.S. stock market, it is subject to broader market risks, including economic downturns, interest rate changes, or geopolitical instability, which can affect all stocks within the index. |
| Professional Management: S&P Global Ratings ensures that the companies included in the index remain relevant and up to date, maintaining the index’s overall integrity. | Concentration in Large Companies: The index is weighted by market capitalization, meaning larger companies have a greater influence on its performance. This can lead to a lack of diversification in terms of company size, with larger firms having a disproportionate impact on returns compared to smaller firms. |
If investing in products related to the S&P 500 index doesn’t help you achieve your financial goals for any reason, consider trading as an active way to earn profits from fluctuations in the value of S&P 500 futures contracts.
Trading S&P 500 futures allows investors to capitalize on short-term price movements, offering the potential for quicker returns. However, this approach requires more involvement and a higher level of risk management compared to passive investing, as market volatility can lead to both significant gains and losses.
How to Make Money with the S&P 500 Index
In relation to the S&P 500 index, futures trading involves buying and selling contracts with the ticker ES on the CME Group (Chicago Mercantile Exchange), a popular E-mini contract based on the S&P 500 value.
This provides the opportunity to profit from both the rise and fall of the S&P 500 index in a “nearly 24/5” mode (with brief pauses around midnight).
How Much Can You Earn Trading S&P 500 Futures?
Let’s perform some basic calculations. First, download the ATAS platform, which allows you to open an S&P 500 futures chart and provides powerful professional tools for traders.
Once you have the platform up and running, click on Chart (as shown by the red arrow below), and select ES – this will open a chart with the latest quote.
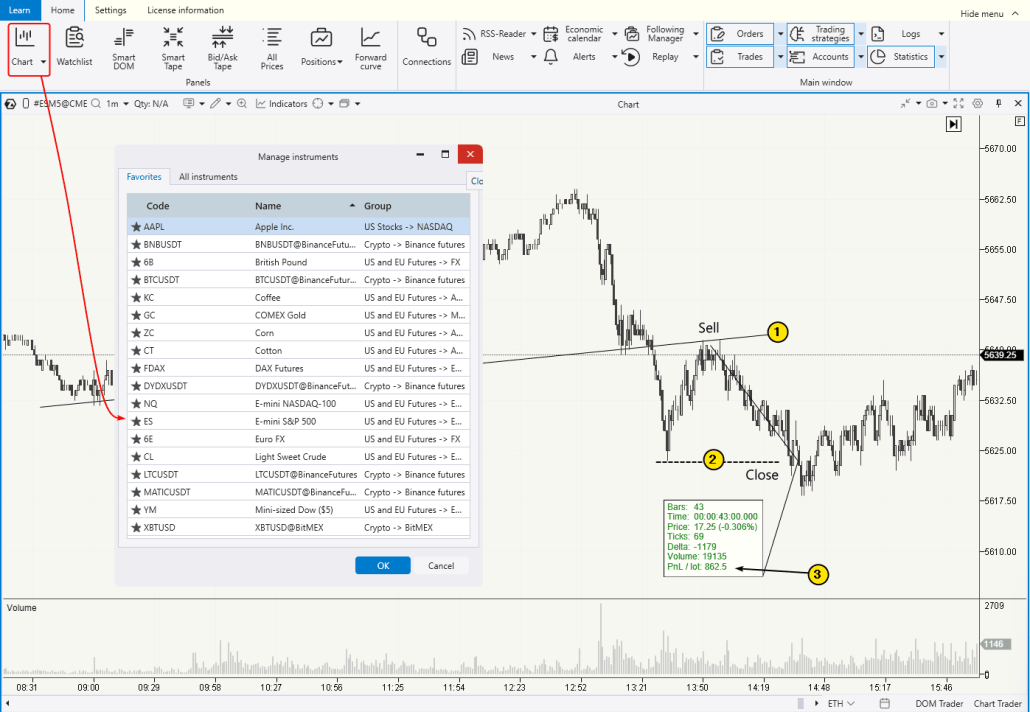
Suppose you notice that the price has broken a local support level (1) and then returned to perform a “breakout test” — this is a simple argument for opening a short position (selling the contract). If you hold the position until a new minimum is reached (2), you could potentially earn about $800.
How Much Do You Need to Start Trading? The minimum deposit required to trade intraday (without holding positions past midnight) for 1 contract can vary depending on the broker. However, in general, it is affordable. As a guideline:
- For the E-mini (ES) S&P 500 futures contract, around $400 is needed.
- For the Micro E-mini (MES) S&P 500 futures contract, around $40 is required.
Thus, with $500, you can potentially earn $800 in less than an hour. And if you make multiple trades throughout the day, this figure could be higher. This is significantly different from the expected 10% annual return from investing in the S&P 500.
The profit potential from trading futures is indeed attractive — but, of course, the risks are equally significant. Therefore, it is crucial to ensure that you have a trading edge and the skills to identify favorable entry points by analyzing the chart.
How to Analyze the S&P 500 Futures Chart
For E-mini S&P 500 futures traders, footprints are one of the most informative chart formats. Footprints provide detailed insights into market activity at specific price levels, distinguishing between the direction of the trade — whether it’s a market buy or market sell.
By analyzing footprints, you can assess real-time changes in the supply and demand balance, helping you identify well-founded trade setups.
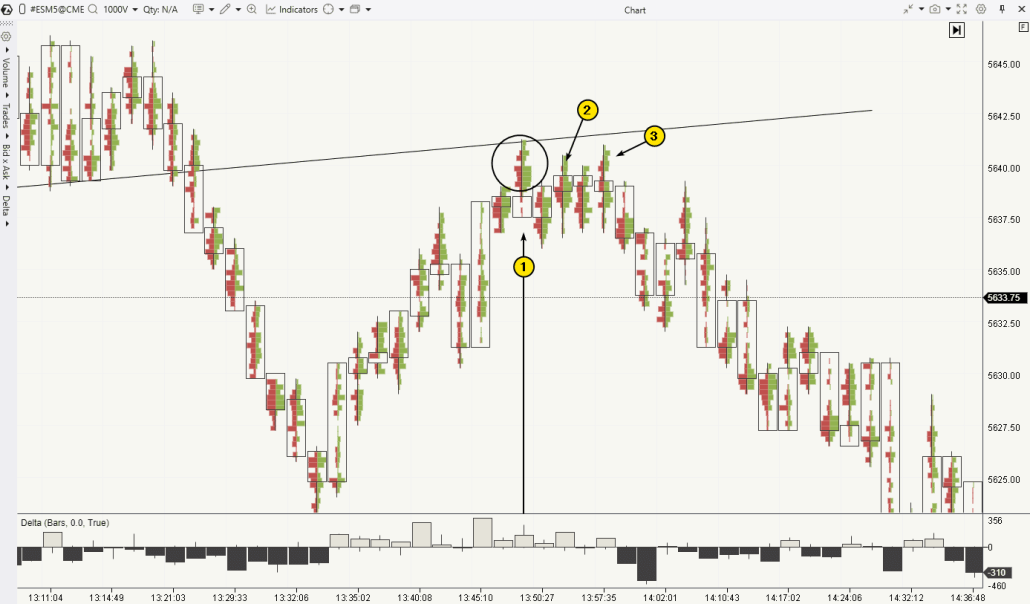
Example. Let’s take the same chart but switch the frame to Volume-1000 and change the candles to footprints (in ATAS, press Shift+K to switch to footprints).
Footprints reveal that as the price rises to a level that had previously acted as support, buyer activity does not have the expected effect. Specifically:
- The buying activity (green clusters) at the top of the candle (1) led to a price drop, not an increase (as the price closed below the green clusters).
- The same pattern can be observed at the tops of candles 2 and 3.
The inefficiency of buyers indicates that the level will not be broken upwards. Therefore, it’s reasonable to expect a bearish reversal, and you can consider entering a short position (with appropriate stop-loss protection and a realistic target).
How to Trade S&P 500 Futures
To trade S&P 500 futures effectively, you need to develop your own trading strategy. This strategy should incorporate your unique way of reading charts, along with essential rules for risk control and capital management.
A great tool for this is the ATAS Market Replay feature, which acts as a training simulator. It allows you to enhance your trading skills without the risk of losing real money.
Advantages of Market Replay in ATAS:
- Built-in Demo Account: The demo account allows you to replay historical S&P 500 futures data, creating the feel of a “live” market. This provides an excellent opportunity to practice trading and test strategies without risking real capital.
- Database Access: ATAS offers detailed tick history, including Level II market depth data for stocks, futures, and cryptocurrencies, enabling in-depth analysis.
- Advanced Tools: Utilize ATAS’s advanced tools, including footprint analysis and volume analysis indicators, to gain a real trading advantage and interpret market conditions more accurately.
How to Launch Market Replay in ATAS:
- Download, Install, and Launch ATAS: Start by downloading ATAS for free, installing it, and running the platform.
- Open an E-mini ES Futures Chart: Select the chart for the E-mini futures (ES) contract.
- Click Market Replay: In the main ATAS menu, click the Market Replay button.
- Activate Replay Mode: In the window that opens, turn on the Replay mode (the icon should turn green).
- Set Up Your Parameters: Choose the date and data type you want to replay.
- Start Playback: Hit the play button to begin the replay, and begin analyzing the profiles.
- See a Setup?: If you spot a trading setup, go ahead and execute trades using the built-in demo account for Market Replay.
This process allows you to practice trading in real-time conditions and refine your strategy with zero risk.
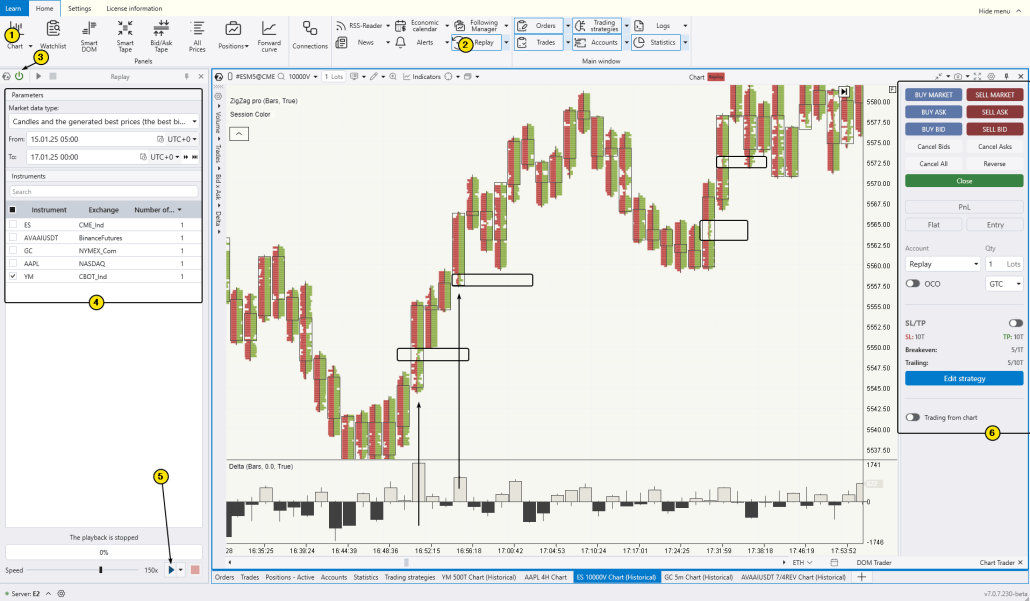
Notice how you can trade intraday, identifying multiple setups throughout the day. If the price rises actively during a surge in positive delta, the “gaps” on such candles (a sign of buyer superiority or imbalance in favor of demand) can be used as support for price action in subsequent candles (highlighted by rectangles).
These setups present opportunities to enter trades based on observed price behavior and market imbalances. Try using this approach for free — test whether you can achieve consistent profit growth by trading such setups. The Market Replay feature in ATAS will allow you to practice this strategy in a risk-free environment and refine your skills for real trading.
FAQ
What is the S&P 500 index in simple terms?
The S&P 500 index is a calculated value based on the stock prices of the 500 largest companies in the United States. Analysts use the S&P 500 to assess the overall state of the economy and specific sectors. Investors use it to preserve and grow capital, while traders engage in active speculation based on the price fluctuations of leading U.S. companies’ stocks.
What is the return of the S&P 500?
The average annual return of the S&P 500 since its inception in 1957 through the end of 2023 is approximately 10.26%. This figure includes both stock price growth and reinvested dividends. However, when adjusted for inflation, the real return decreases to around 6-7%.
What time does the S&P 500 open?
Since the S&P 500 is based on stocks listed on U.S. exchanges such as the NYSE and NASDAQ, it is fair to say that the S&P 500 opens at the start of trading on these exchanges — specifically, at 9:30 AM Eastern Standard Time (EST) in New York. Trading typically closes at 4:00 PM EST on regular trading days. However, tools like the E-mini S&P 500 futures allow for near 24-hour trading on weekdays, though the futures market experiences lower volatility when the exchanges are closed.
Conclusion
The S&P 500 is not just another stock market index. It is a widely used tool for investors and analysts to gauge the overall condition of the U.S. stock markets. It reflects not only stock price movements but also the state of the economy (and its individual sectors), technological innovations, and political events that influence market sentiment.
Fluctuations in the S&P 500 futures price present opportunities for profit through intraday speculation, supported by modern trading tools for traders, such as footprint charts and volume analysis indicators.
Do not miss the next article on our blog. Subscribe to our YouTube channel, follow us on Facebook, Instagram, Telegram or X, where we publish the latest ATAS news. Share life hacks and seek advice from other traders in the Telegram group @ATAS_Discussions or on Discord.
Information in this article cannot be perceived as a call for investing or buying/selling of any asset on the exchange. All situations, discussed in the article, are provided with the purpose of getting acquainted with the functionality and advantages of the ATAS platform.


