

Analyzing bids and asks can be very useful in identifying price reversals. However, before delving into these concepts, let’s revisit the fundamental principles:
Supply is a quantity of goods a seller wants to sell.
Demand is a quantity of goods a buyer wants to buy.
The supply and demand law: “all other conditions being equal, the lower the price, the higher the effective demand is and the lower the supply is”.
How supply and demand interact
Let us assume that somewhere in Africa a miner found a diamond of a large size. An interested buyer learned about it and offered the miner USD 1 million for it. The miner asked for two days to scratch his head. However, information about this diamond leaked into the press, which resulted in other interested persons. The miner received an offer of USD 1.1 and rejected the previous USD 1 million offer. Two more potential buyers offered him USD 1.2 and 1.3 million respectively. So, the demand increases. The demand price is the bid price, or the price, at which buyers are ready to buy a commodity. Bid means an offered price.
Next day, miners in Asia found 10 diamonds of the same size, as was the African one. Immediately after this information became public, the price and demand on the African diamond fell down due to availability of a big quantity of similar diamonds.

Start using ATAS for free with no time limits! Or activate the advanced tariff right now to access the full range of functionality.
What Are Bid and Ask on the Stock Exchange?
The bid price is the demand price or the price, at which a buyer agrees to buy a commodity. A buyer does not want to buy at a high price. This is the logic of the law of supply and demand.
The ask price is the supply price or the lowest price, at which a seller agrees to sell a commodity. A seller does not want to sell at a low price.
A seller increases the ask price when new factors appear, which increase the market value of a commodity. A buyer realizes that he has small chances to buy this commodity at a previous price and has to increase the bid price. And the situation is opposite when the market price goes down. A trade is executed only when there is a buyer who is ready to pay immediately the whole amount requested by a seller. Or a seller agrees to take that amount of money, which a buyer is ready to pay.
On the stock exchange, futures exchange, or cryptocurrency market, bid and ask refer to the demand and supply.
In practice, these terms have two interpretations:
- Bid and ask in the order book. The bid in the order book represents a placed buy order. While the ask in the order book represents a placed sell order. Here, both the volume of orders and the price are considered.
- Bid and ask on the tape or on the chart refer to completed trades. Trades at bid prices indicate market sells (shown in red), while trades at ask prices indicate market buys (shown in green).
Therefore, when answering the question of what bids and asks are, we always consider the context: whether we are talking about orders in the order book or trades based on bids and asks.
The trading ATAS platform has the Bid Ask indicator, which shows how many trades were traded at the ask price and how many – at the bid price during a certain period of time.
You can use this link to find reference information on the Bid Ask indicator.
How to use the Bid/Ask indicator data

The picture above shows a 5-minute chart of the oil futures trading on the Moscow Exchange. The Bid/Ask indicator is shown in the lower part of the chart in a form of a bar chart. Pay attention to the indicator behavior on the price upward turnaround from under the 80 level. Assess 17:20 indicator data. Predomination of the green color says that the market registered more purchases at the ask price (namely, 20,918 lots were bought). For comparison, there were significantly less sales at the bid price (the red column is much smaller, namely, 6,184 lots were sold). As a result, an intraday rally to 80.80 level was started.
Accumulation of purchases at the bid price is one of the attributes of availability of initiative major traders. Download and install ATAS, monitor the beginning of the upward trends with the help of the Ask/Bid indicator and you will see the similar behavior practically on each bottom. The price levels, at which such a pattern is formed, play the role of the support levels in future.
One more way of visual detection of the market buying and selling imbalance is the use of the Bid/Ask Imbalance when adjusting the cluster (you can find more details about the Bid/Ask Imbalance cluster type in the respective section of the ATAS knowledge base).
Here is the same chart in the form of the Bid/Ask Imbalance clusters:

Look, the number of sales exceeds the number of purchases practically at each price level. This testifies to undervaluation of the Brent oil futures contract at the level of about USD 80 a barrel.
To have a completely clear picture, it is necessary to understand what main types of trading orders exist:
- Market orders are orders at the current price. These are orders of those traders who are in a hurry to buy/sell immediately at the best price, which is available in the market, that is at the bid or ask price. Such orders will be executed very fast.
- Limit orders are orders at a previously specified price. If you do not hurry to buy and are prepared to wait for a better price, your choice is the buy limit order. For example, the plan is to buy at the level of the yesterday’s low and sell at the level of the yesterday’s high. You will get profit if both limit orders are executed. But they might not be executed if the requested price does not find the willing ones. Then the trading result will be zero. But it is better than a price fall loss after execution of the buy limit order.
By the way, the ATAS platform users have a possibility to buy/sell at bid/ask prices with one mouse click directly from the screen or through a special menu, which significantly accelerates the process of trade execution. You can get acquainted with the Chart Trader functions in this article
Start now!
Try ATAS free with no time limit
What is a spread?
Spread is a difference between the ask and bid prices
Sometimes, when analyzing a chart, the spread term means a difference between the high and low of a bar/candle. Spread is a range, expansion and amplitude.
Even a novice can easily see the spread in the trading and analytical ATAS platform with the help of the Depth of Market indicator.

It is a convenient graphical presentation of limit orders at each price level. By default, the bids are green and asks are red.
Let us consider one example. One of your neighbors, William Johnson, wants to buy 10 kilos of potatoes at $1 – this is the bid price. Another neighbor of yours, John Williamson, wants to sell 15 kilos of potatoes at $2 – this is the ask price. The spread between these prices is $1. If William Johnson and John Williamson both would have made a trade-off, they could have executed the trade immediately. But they both use limit orders, they are not in a hurry and do not want to make a trade-off.
The more sellers are there in the market, the more selling orders would be posted by them at a higher level than the market price (the price of the most recent registered buy/sell trade). A competition will grow among sellers and, while trying to sell their goods, they would have to decrease the price of their offers. Thus, the bid prices move closer to the current market price.
And, respectively, the more buyers, the bigger is the number of buying orders in the market and the ask price moves closer to the current market price.
If there are more prices, the liquidity is higher and the spread is narrower. If there are less prices, the liquidity is lower and the spread is wider. Liquidity is a possibility to sell fast with a minimum spread between the bid and ask prices.

A spread is always a bit of a disappointment for a minor trader, since it increases expenditures in trading.
It is like a currency exchange shop – the selling price of any world currency is always higher than the buying price. It is absolutely unprofitable for currency buyers, but very profitable for a currency exchange shop.
Let us assume that the Guinean Franc (GNF) is traded at USD 9.95-10. The bid price is USD 9.95 and the ask price is USD 10. The spread in this case is 5 cents or 0.5% (0.05/10). The buyer who will buy GNF for USD 10 through a market order (at the ask price), would lose 0.5% on this trade due to the spread. Buying GNF 100 would bring USD 5 of losses and GNF 10,000 – USD 500 of losses. Similarly, the seller will have losses when executing a market order at the bid price. It is obvious that a trader should consider the spread influence on the final result in the long run.
Spreads and prices become very ‘active’ during:
- publications of important economic news and statistical data;
- when the market is opened and closed;
- when officials make speeches.
Such events are accompanied with the increase of liquidity. A number of traders is big (for different reasons): the buyers consume the closest asks and the sellers – closets bids. It is believed that trading directly at these moments has a higher risk.
How to reduce expenditures connected with the spread:
- to use limit orders;
- to calculate the size of your order with consideration of the available offsetting orders;
- to trade around narrow spreads, that is in the liquid markets.
How to Conduct Bid and Ask Analysis
Analyzing bids (buy orders) and asks (sell orders) is an important part of trading on any exchange. These terms relate to prices and volumes – that is, the forces of demand (bid) or supply (ask) at a specific moment in time, in a particular exchange market.
Next, let’s delve into the fundamental principles of bid and ask analysis.
The More Orders There Are, the More Interesting the Level Becomes to Market Participants
And it is more likely that the price will react to this level:
- a level with a large cumulative bid volume can be an important support level;
- a level with a large cumulative ask volume can be an important resistance level;
- if these levels get broken, a trader can monitor the pattern of testing the breakout of these levels as a marker for a potential entry into a trade.
Professional Indicators Are Your Assistants
The most popular indicator for assessing bid and ask is the Depth Of Market (DOM) indicator. To use it, you need to connect to an exchange that broadcasts Level II data.
The Bid Ask indicator is also useful. It is available on the ATAS platform and is displayed below the price area. This indicator shows the volumes of market buys (trades at the ask) and market sells (trades at the bid) for each candle. For example, see the screenshot below.
The Order Flow indicator shows real-time trades executed at bid and ask prices. Trades with large volumes are highlighted with red and green circles (see example in the screenshot below).
Next, let’s discuss more advanced tools for professional bid and ask analysis.
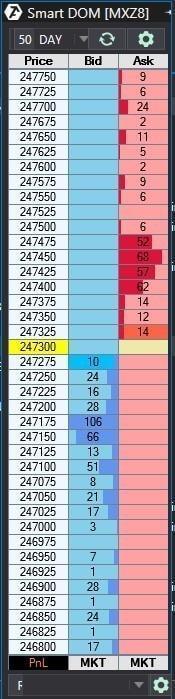
ATAS Smart DOM is a separate module for analyzing bid and ask in the order book. It has a variety of features:
- integration with market profile;
- trading functionality;
- personalization and other settings.
ATAS DOM Levels is a useful indicator that shows on the price chart how bid and ask order volumes have changed over time in the order book.

The brighter the level, the more bid or ask orders there are. For example, in the screenshot above, you can see that (indicated by numbers) large ask volumes:
- stopped the rise around 307.7;
- marked the appearance of a seller, which triggered…
- …a price decline.
DOM Trader is a special feature that integrates DOM Levels, the order book, and the Order Flow indicator to conduct intraday trading.

Practice and Experience Are Key Factors
Analyzing bid and ask is not simple, and making profits in the market is not either. Do you want to enhance your skills in analyzing supply and demand (including bid and ask prices in the order book)? The ATAS platform has some useful features that will help you with this.
- Try Market Replay, a built-in simulator for traders. It will assist in analyzing bid and ask more accurately without risking capital, interpreting volumes and indicators in history, and simulating the trading process in real-time.
- Educational Materials. The ATAS blog, the Learn section within the platform, the YouTube channel, and the Knowledge Base – these sources will enhance your skills. They provide examples of bid and ask volume analysis, strategy-building ideas, indicator usage schemes, and other valuable information. Additionally, platform users can count on ATAS’ responsive support.
- Additional tools. Combine bid and ask analysis in the order book with footprint charts (cluster charts), the Smart Tape, the Cluster Search, Big Trades, Speed of Tape, Stacked Imbalances indicators, and others.
Conclusions
Bid and ask are fundamental terms in trading, they have two interpretations:
- The primary definition of bid and ask revolves around the order book, specifically referring to buy orders (bid) and sell orders (ask).
- Another common usage of bid and ask relates to executed trades, specifically denoting market buys (trades at ask prices or simply asks) and market sells (trades at bid prices or simply bids).
We hope this article has clarified the key points related to the concepts of bid and ask and once again showcased the powerful capabilities of the ATAS platform for trading.
Subscribe
Get the latest ATAS news delivered conveniently


