“All trades leave indelible tracks on price and volume charts” – Alexander Elder
Understanding of the market and search for profitable trades is the goal of any trader. Analysis of interconnections of movement of the price and vertical volumes increases chances of its achievement.
In this article:
WHAT THE VERTICAL VOLUME IS
Vertical volume is a general number of shares or contracts, which were traded during a certain period of time in volume or monetary terms. The vertical volume is usually reflected in the form of a column bar chart under the price chart.
Volume is activity. A trader builds his expectations for further development of events through analyzing activity of traders at different price changes.
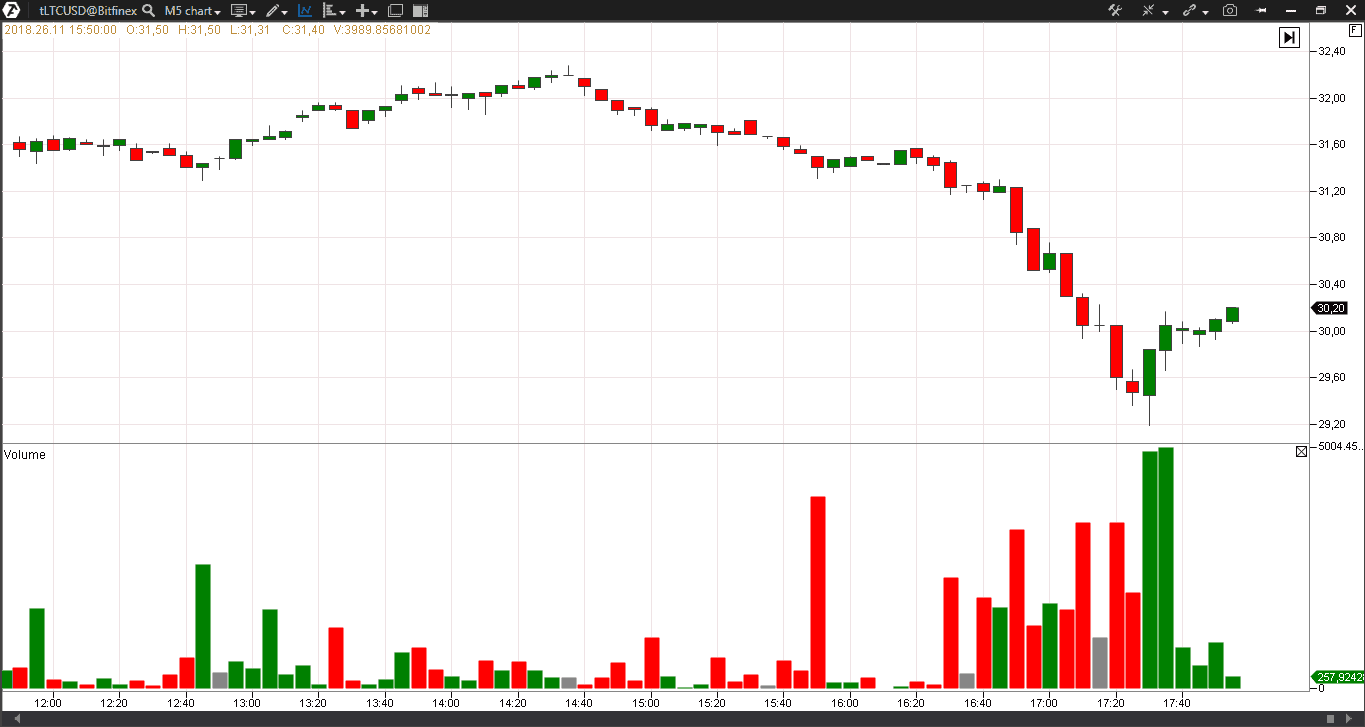
Vertical volume is a basic indicator. Picture 6 is a screenshot from the standard Quick terminal, which shows a MICEX index futures (MXZ8) with the volume indicator.
RULES OF THE PRICE AND VOLUME INTERACTION
The vertical volume does not carry information, sufficient for making trading decisions, by itself. The vertical volume is analyzed only in interaction with the price behavior.
Rule 1
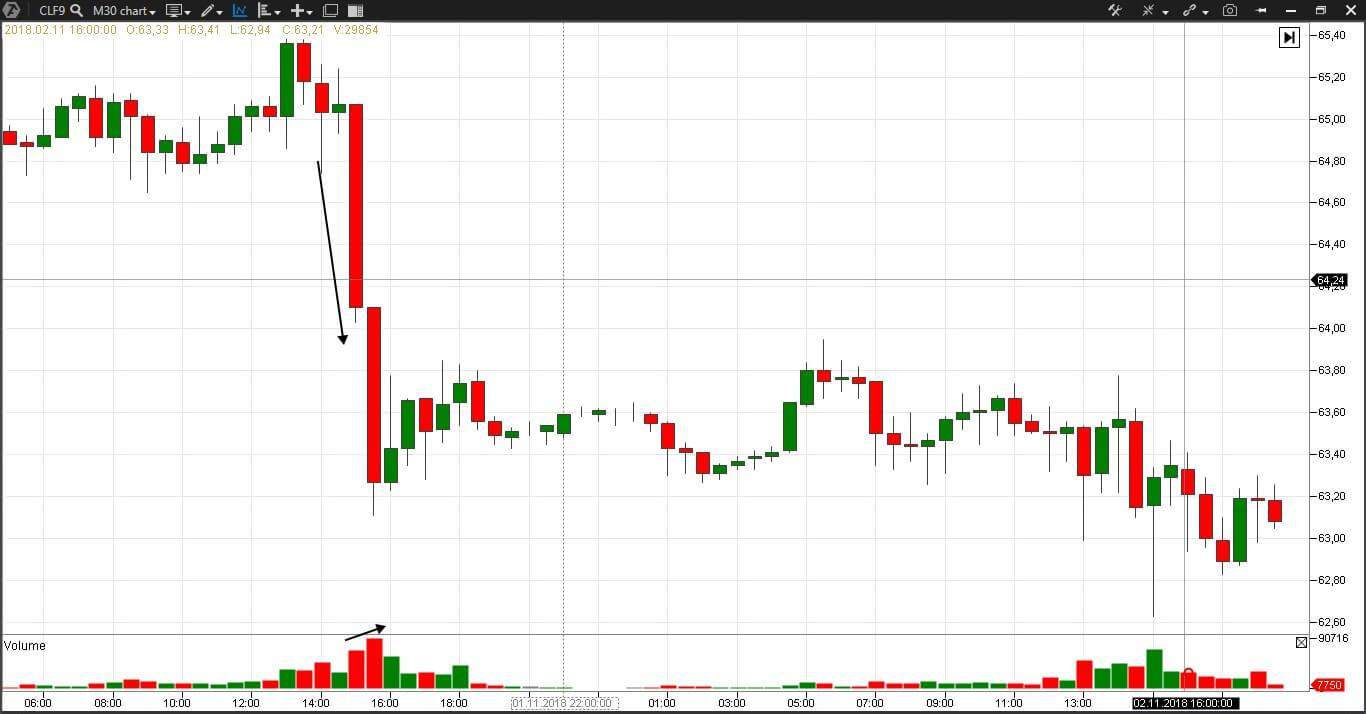
Growth of volume, when the price grows, forecasts even higher prices. Consequently, the volume growth during price reduction forecasts even lower prices.Example. Have a look at the 30-minute WTI oil futures (CLF9) chart.
Rule 2
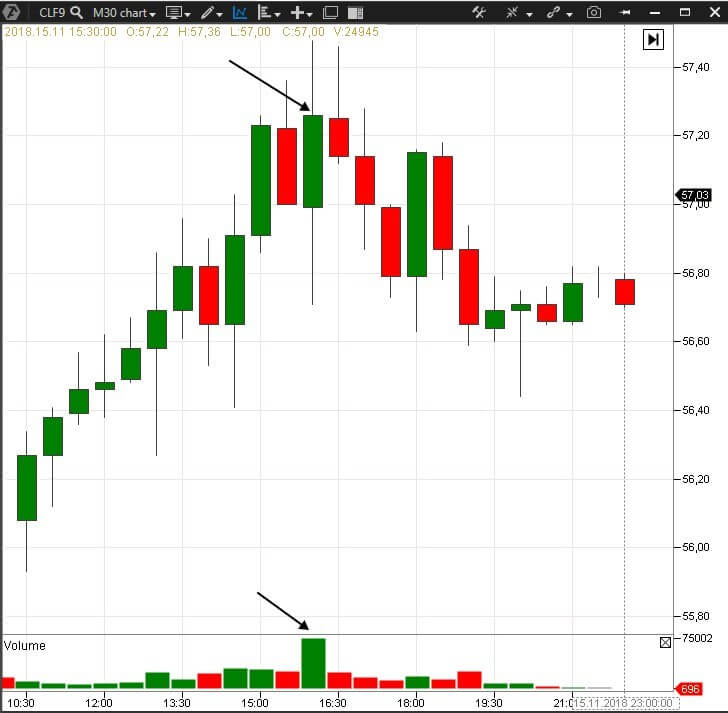
A huge volume, which is more than two times bigger than the usual one, warns about a possible trend change.Example. Picture 8 shows a chart from the oil market. The volume of traded contracts was 75,002 at 16:00 on November 14, which is 2.5 times more than during the previous periods. Namely this candle formed the day’s peak.
Rule 3
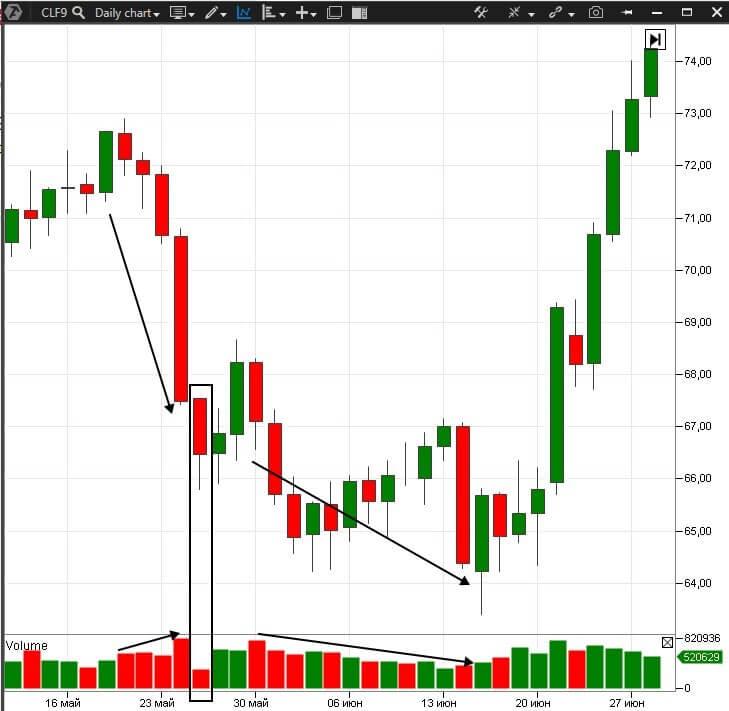
The growing price, when the volume is lower than on the previous peak, forecasts completion of the current growth. Consequently, the falling price, when the volume is lower than on the previous valley, forecasts completion of the current fall.The price falls from May 21 until May 24 and volume increases in the day WTI oil futures (CLF9) chart. The low of 65.80 on May 27 was accompanied with the volume of 307,619 contracts, which is 2 times less than the average daily volume. This was the cause of a short-term upward bounce. The price renewed the downward trend from May 30 until June 14, but the trading volumes reduced. That price and volume behavior was an early forerunner of growth at the end of June.
WHAT RICHARD WYCKOFF IS FAMOUS FOR
Richard Wyckoff is is a pioneer of volume and price analysis. He started his distinguished career as early as in 1888. He started his career as an office boy and made a fortune during 40 years, bought 9.5 acres of land in the Long Island and built a mansion there. That way he became a neighbour of the President of General Motors.

Wyckoff also founded the Magazine of Wall Street and the Stock Market Institute where he teached his trading method, known as the Wyckoff method.
Wyckoff was interested in price movement and major players’ influence. Traders still study his books, published at the beginning of the 20th century, as trading textbooks:
- The Day Trader’s Bible;
- The Richard D. Wyckoff Method of Trading and Investing in Stocks.
WHAT THE WYCKOFF METHOD IS
Analysis of the trading price and volume on the tape is the basis of the Wyckoff method. Richard Wyckoff didn’t apply clear rules and technical indicators. He analyzed charts, reading their demand and supply dynamics.
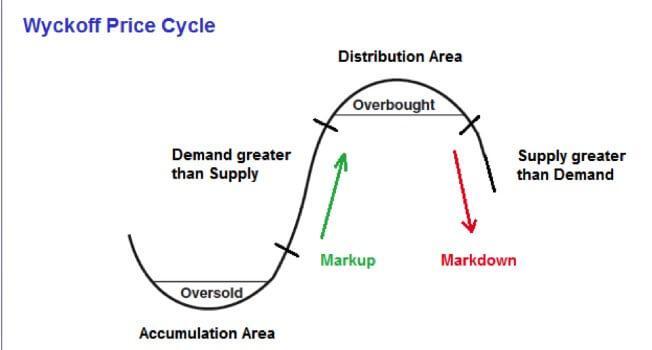
The Richard Wyckoff method uncovers intentions of major players on the exchange. Wyckoff called them the Composite Operator. Traders, who apply the Wyckoff method, monitor how the Composite Operator accumulates a big position at the bottom of the market and sells it out at the top.
The market cycle by the method of Wyckoff is shown in Picture.
One of the Wyckoff method experts is David Weis. He wrote the Trades About to Happen: A Modern Adaptation of the Wyckoff Method book.
Let us consider a picture where Weis analyzes various combinations of two day bars even without the use of vertical volumes.
Can you foresee development on the third day by the bar width and price closing position? We do not have additional indicators here. Use logical thinking as Richard Wyckoff did.
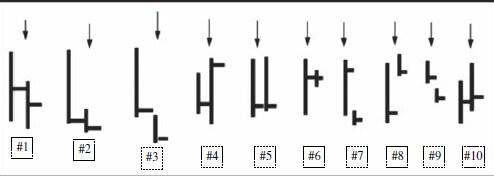
- The first bar is wide and the price moves easy. Closing in the middle of the bar tells us that buyers appeared. The range of the second bar is narrower and the price down movement is difficult. Closing of the second bar is a bit lower than of the first one, but higher than the low and again is about in the middle of the bar, which means that the buyers are present here too. The strength of sellers reduces.
- The wide first bar and closing at the very low warns traders about dominance of sellers. A narrow range of the second day causes doubts in further price reduction. But closing below the low and below the first day closing confirms control of sellers.
- The first day shows the market weakness and predominance of sellers – a wide range and closing at the low. Closing of the second day is lower than the closing and low of the first day. Despite a small range, sellers control the price and further reduction could be expected. This variant is more bearish than the first and second ones.
- Spread of the first day is narrow and closing is at the low – sellers control the situation. The price, first, goes below the low of the first day but then closes above the high. We have a classical key reversal day here. Sellers stopped pressing the price and buyers took advantage of the situation. Expect the price growth the next day.
The bar reading logic works on any timeframe. Here’s an example of bars Nos. 3 and 4 in the 5-minute Brent oil futures (BRZ8) chart.
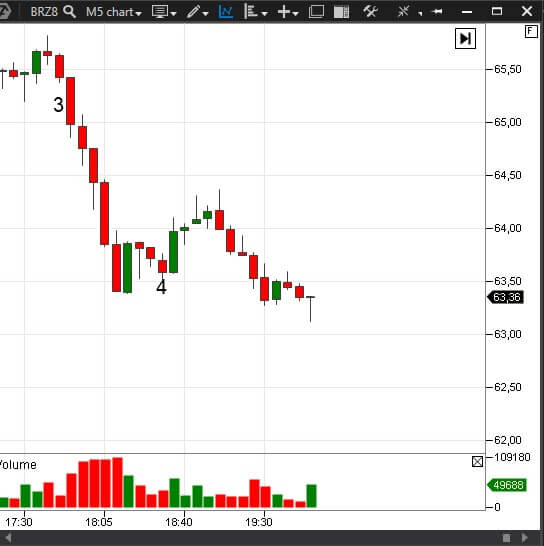
- The first day shows the market weakness. The next day the price makes an effort to move above the high of the first day, but fails to hold and is closed at the level of the low. You might thinks that practically the same closing of these two days creates a support area. But it is not so. Inability of the price to go higher and closing at the low warns about further weakness and price reduction.
- Closing of a wide range of the first day is above the middle, which tells us about availability of buyers. A small range of the second day tells us about absence of movement. Wyckoff calls such days a hinge. Note the next day, during which a movement could take place.
- As well as it was in the previous case, closing of a wide range of the first day is above the middle, which tells us about presence of buyers. The second day opens with a big gap from the closing of the previous day and is closed at the low. Despite a narrow bar range, the true movement range from the closing of the previous day to the closing of the current day is very wide. We can see that the buyers’ advantage, which they gained during the first day, was “eaten” by movement of the second day. Buyers are not able to push the price upward. That is why, most probably, there would be further price reduction on the third day.
- Here we have an opposite situation. On the second day, the price was opened much higher than the closing of the previous day and moved higher. The true range is very wide. Despite the closing of the second day at the low, the situation developed in favor of sellers. Taking into account the true range of the second day, the closing ceases to seem weak.
- Both days are with narrow ranges and closings at the low. We do not see a wide range and sharp price jumps. We observe a consistent, steady and quiet reduction, which, perhaps, would continue further on.
- The average range and closing in the middle of the first day tells us about presence of buyers. The price goes up on the second day, but then goes down again and closes in the middle, which is a bit above the closing of the previous day. Buyers did not take the situation under control, but the further pressure of sellers is also questionable. This one is the most ambiguous of all the situations considered.
Examples of bars Nos. 2, 3, 4, 6 and 10 in 5-minute MICEX index futures (MXZ8) chart.
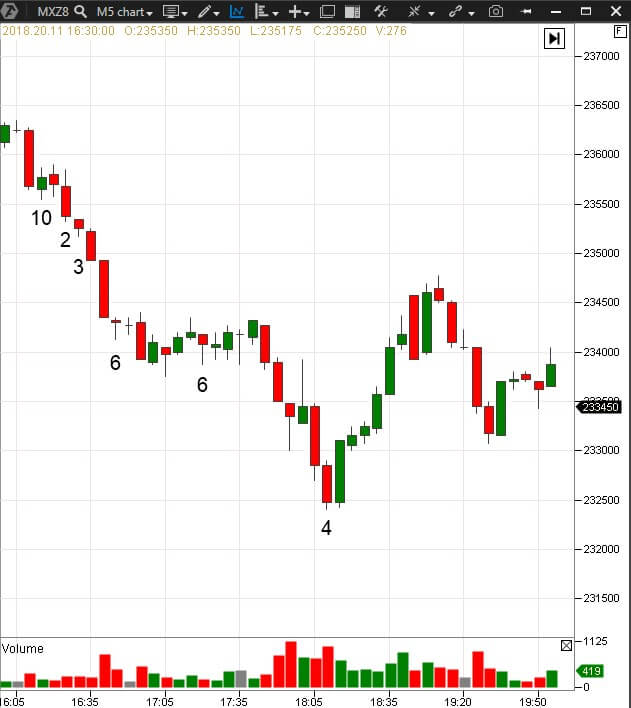
WHERE TO FIND TRADES
David Weis called this picture “where I find trading opportunities”.
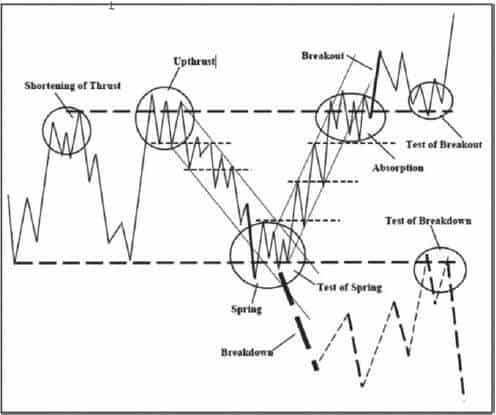
WHAT SPRING AND UPTHRUST ARE
- Spring is an unsuccessful effort of breaking the support level, which is followed by the upward price reversal. Spring is a false breakdown. Spring could be confirmed by a big volume but not necessarily. Springs appear at any time periods.
- Upthrust is an unsuccessful effort of breaking the resistance level, which is followed by the downward price reversal. Upthrust is called a false breakout.
Spring and upthrust were not used in the original Wyckoff works as specific terms. They were formulated and introduced into active usage by his followers later.
Watch this video on our channel: “how the upthrust pattern looks like in reality”.
- involvement of traders, who trade breakouts, into loss-making positions;
- activation of too close stop losses.
There is no real pressure of sellers/buyers in the market at attempt of breaking the support/resistance level due to a cunning nature of springs/upthrusts. That is why the price moves back.
It is necessary to build support and resistance levels in order to identify springs and upthrusts. This process is a bit creative, since the levels are built in different ways – by candle bodies or by candle shadows, from 3 touches or from 5 touches.
Each trader develops his own vision of the levels.
Example. Here we have a day E-mini EUR/USD futures (E7Z8) chart.
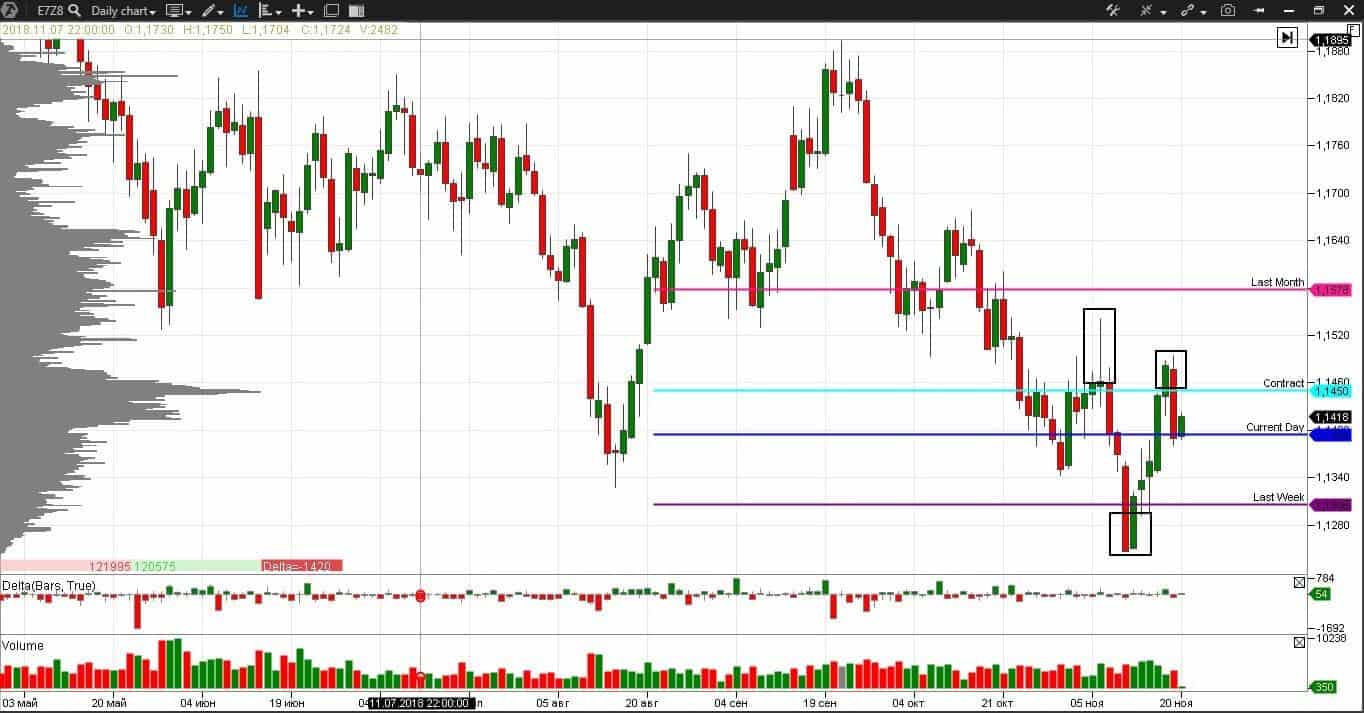
- On November 11-12: spring or false breakdown of the support level;
- On November 6: upthrust, which is confirmed by the candle’s long shadow.
WHAT VSA METHOD IS
A young man named Tom Williams moved to Beverly Hills from England in the middle of the 20th century to try his luck. He found his luck. He had a medical certificate and found a job where he looked after an unhealthy millionaire who made a fortune trading stock in a big syndicate.
Tom asked the millionaire to teach him how to trade stock and he was employed by the syndicate. They gave him a one meter ruler and showed how to draw price and vertical volume charts. That was his first duty.
Nowadays, such software complexes as ATAS build various types of charts in several seconds, while earlier traders drew their charts by hand.
Tom showed good progress and he was sent to the Stock Market Institute to study the Wyckoff method. Namely there, day-by-day, Tom studied the real mechanics of the stock market operation.
Having comprehended the intricacies of the price and volume analysis, Tom started to trade for his personal account and returned back to England a rich man. We was a little more than 40 years old. Tom continued to trade but also started educational activity. He developed the VSA method.
Volume Spread Analysis (VSA) is a simplified version of the Wyckoff method. VSA is based on:
- bar volume;
- spread – a difference between the bar high and low;
- bar closing price.
Gavin Holmes – Tom Williams’ student, follower and author of the Trading In the Shadow of the Smart Money book – continues his legacy.
WHAT ABSORPTION IS
One of the concepts in Wyckoff and VSA methods is absorption. If we analyze this process with the help of the ATAS platform, the market becomes clearer. Let’s do it.So, absorption of buyers is a process of overcoming closing long positions and opening new short positions. It is a complex definition, the main word in which is overcoming. Buyers successfully “sit out” while some traders register profit on old long positions and others open new short positions at price peaks.
Features:
- Increase of the support line;
- Increase of the volume on top of the absorption area;
- Absence of the downward movement;
- Prices consistently apply pressure on the resistance line to the right from the absorption area without downward pullbacks;
- Sometimes, spring causes absorption;
- Minor upthrusts fail to become full-fledged breakouts during absorptions.
Absorption of buyers, in most cases, is on top near the resistance area, as it is shown on the previous picture.
Absorption of sellers is the process of overcoming closing short positions and opening new long positions. The area of absorption of sellers is usually located at the support level. The key feature of absorption of sellers is a repeated inability of prices to go higher. The absorption of sellers, in most cases, results in the breakdown.
In the majority of cases, absorptions last for several days. It is very difficult to analyze the volume indicator absorptions.
Here we have a day WTI oil futures (CLF9) chart.
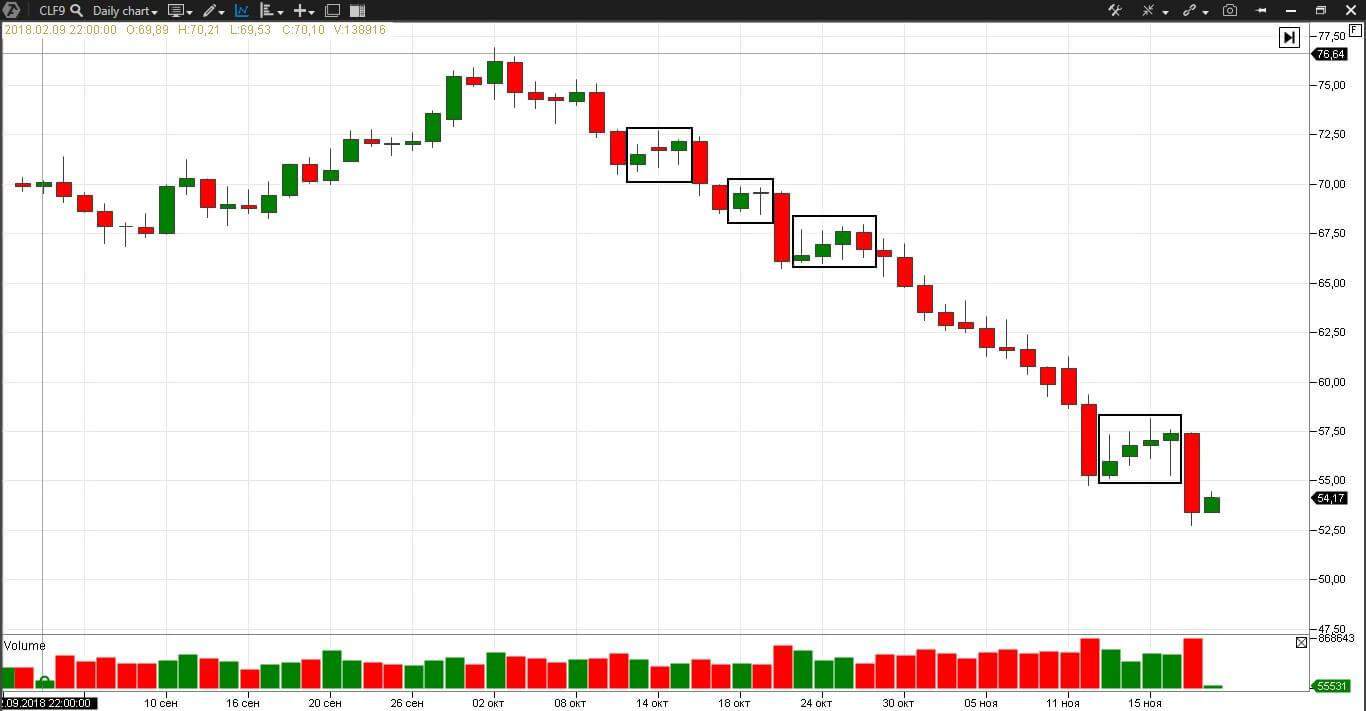
The situation was very ambiguous, especially on October 23-28 and November 13-18. The buy volumes were stable and the bar closings consistently grew upward. The cluster bar type, delta and horizontal volume will help to understand what happens in a complex situation.
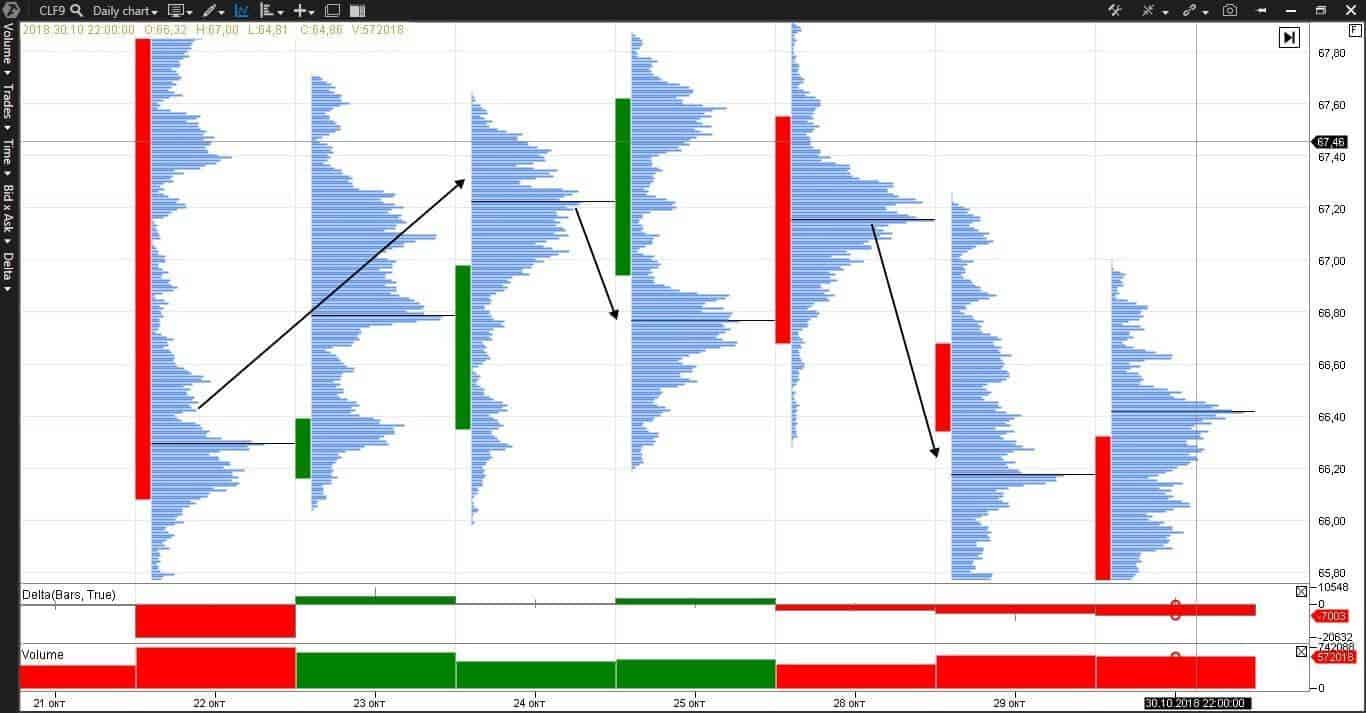
October 23 – the volume moves upward and the delta is positive – attributes of buyers’ appearance.
October 24 – bar closing is above the closing and maximum volume of the previous day, but the volume and delta are lower. Buyers try to increase the pressure.
October 25 – the maximum volume of trading takes place at the level of the maximum volume of trading on October 24 despite the closing above the previous day’s one – you should be on the alert and wait for the next day.
October 28 – the market is balanced and ready to start a new focused movement – the bell shape of the bar testifies to it.
October 29 – the closing is below the closing and maximum volume level of the previous day and the delta is negative. Sellers absorbed all buyers and nervous sellers, who closed their positions. The market would move from the middle of the balanced area of 66.73. Probability of the price fall is higher than its growth, since the closing is below this level.
Let us consider this situation at a different angle.
The chart shows the vertical volume of the current WTI oil contract (CLF9), delta, cumulative delta and horizontal volume in candles. The chart gives a general understanding of the situation with the WTI oil prices for the past 1.5 months. Price reduction is confirmed by increase of the horizontal volume and fall of the cumulative delta. Short periods of price bounce are the periods of absorption of sellers. The market reaches a balance during these periods of time and then continues a focused movement.
ADVANTAGES AND DISADVANTAGES OF METHODS BASED ON VERTICAL VOLUMES
Advantages
- could be used on various timeframes, which means many trading opportunities;
- small stops in case of a correct assessment of a market situation;
- correct understanding of the market.
Disadvantages
- subjectiveness of the method;
- it takes much time to study it;
- absence of measuring instruments.
SUMMARY
Methods of analysis of vertical volumes make the market situation clear and transparent. Professional traders accumulate the competitive advantage and reduce the risk through connecting the logical understanding of the smart money action with advanced software.“Big victories sometimes start with a small advantage” Sarah J. Maas

