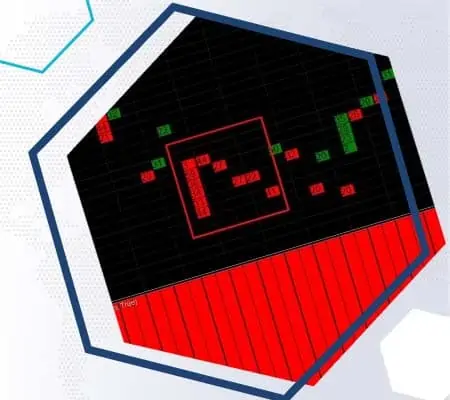
What are the pros of the Market Profile?
Deep understanding of the market. The market profile provides a detailed picture of actual buyer and seller activity, consolidating information about recent trades in a convenient format. This approach is advantageous compared to trading based on moving averages, which can cross at any moment if you change the period.
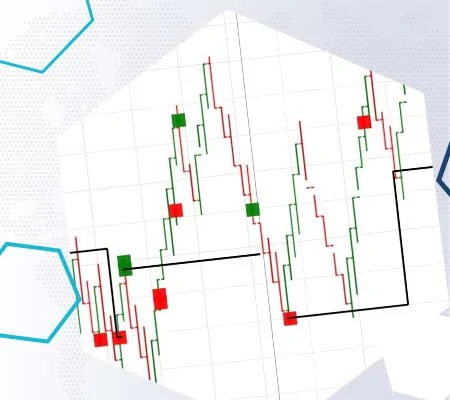
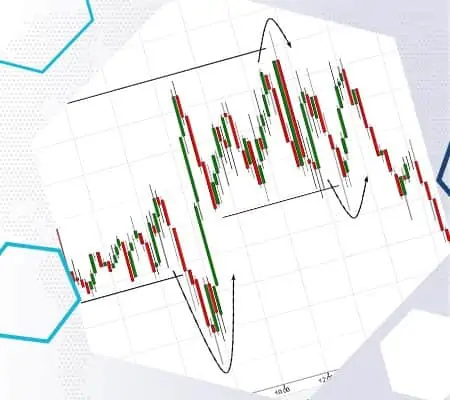
Identification of support and resistance levels. The indicator helps identify strong support and resistance levels. This can be crucial for risk reduction and decision-making regarding entering or exiting a trade.
Versatility. The market profile proves effective for both trend and bounce trading across futures, stocks, or cryptocurrency markets.
What are the cons of the Market Profile?
Difficult to interpret. For beginners, the indicator may appear complex, requiring time for learning and understanding.
It needs an additional analysis. The market profile works best when combined with other tools and analysis methods, which may demand additional knowledge and skills from the trader.
Subjectivity. Similar to many volume analysis tools, interpreting the market profile readings often involves a subjective element, leading to situations where individuals say, ‘This is how I see it – I am an artist.’
The market profile can become a powerful tool in a trader’s arsenal, however, like any other instrument, it is crucial to use it in combination with other analysis methods and always consider risks.
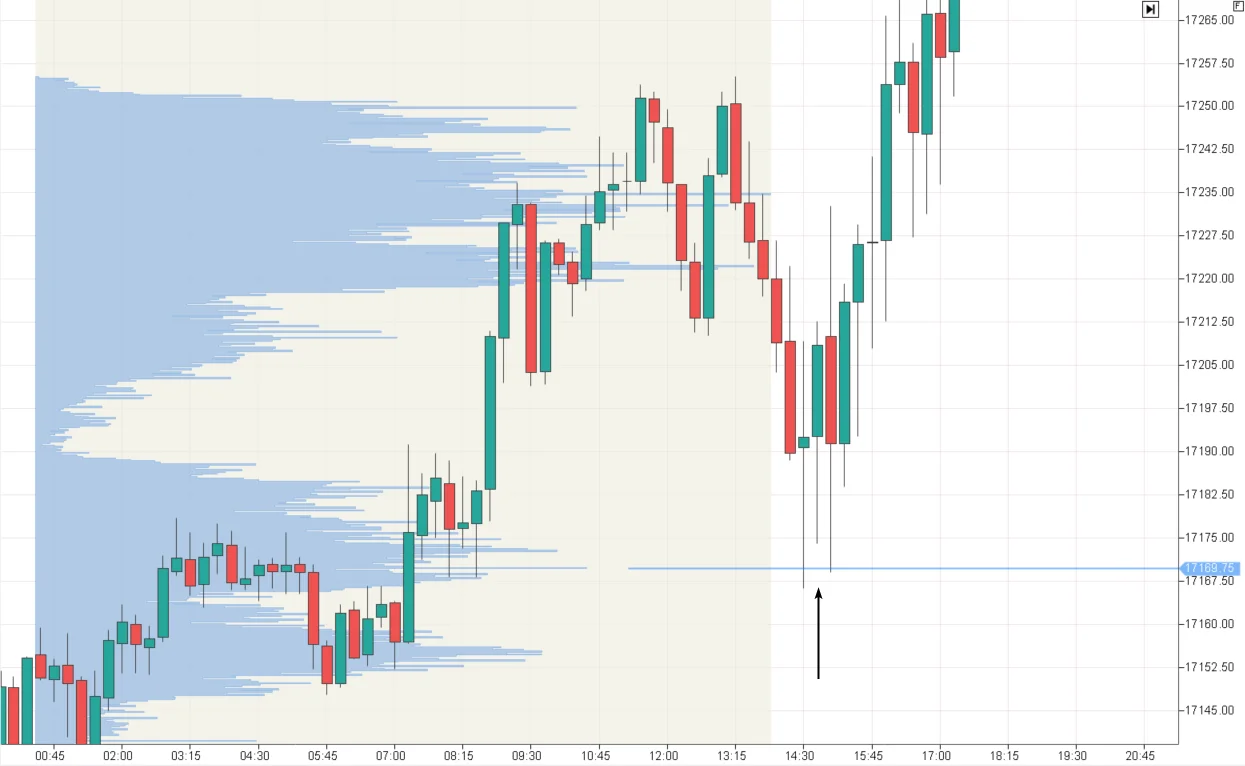
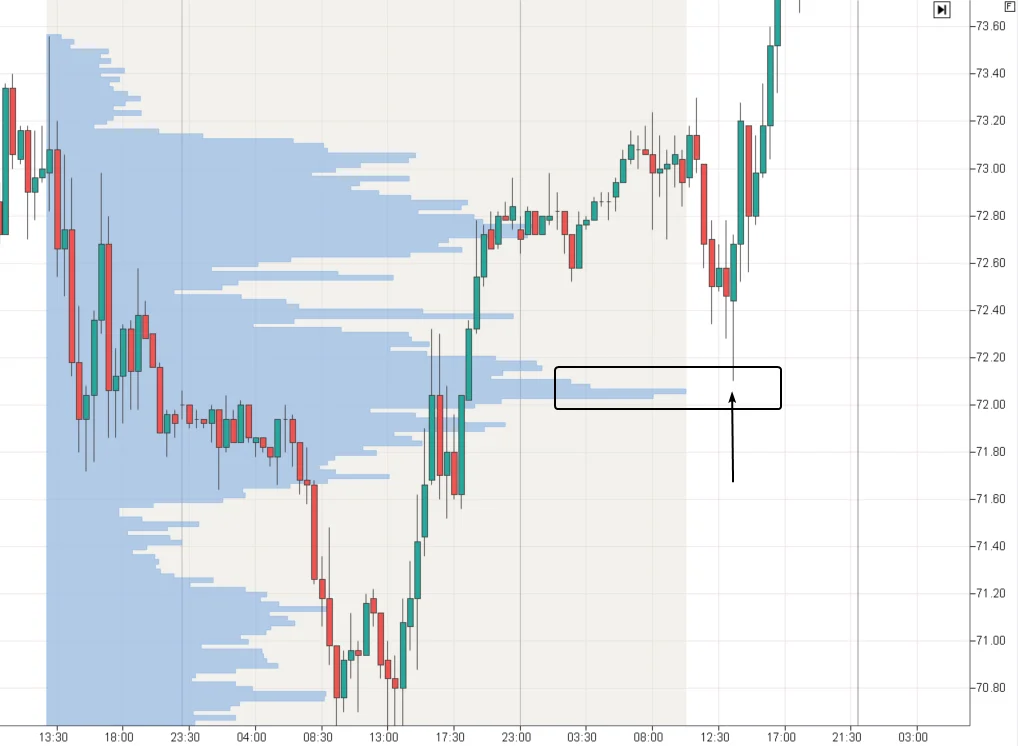
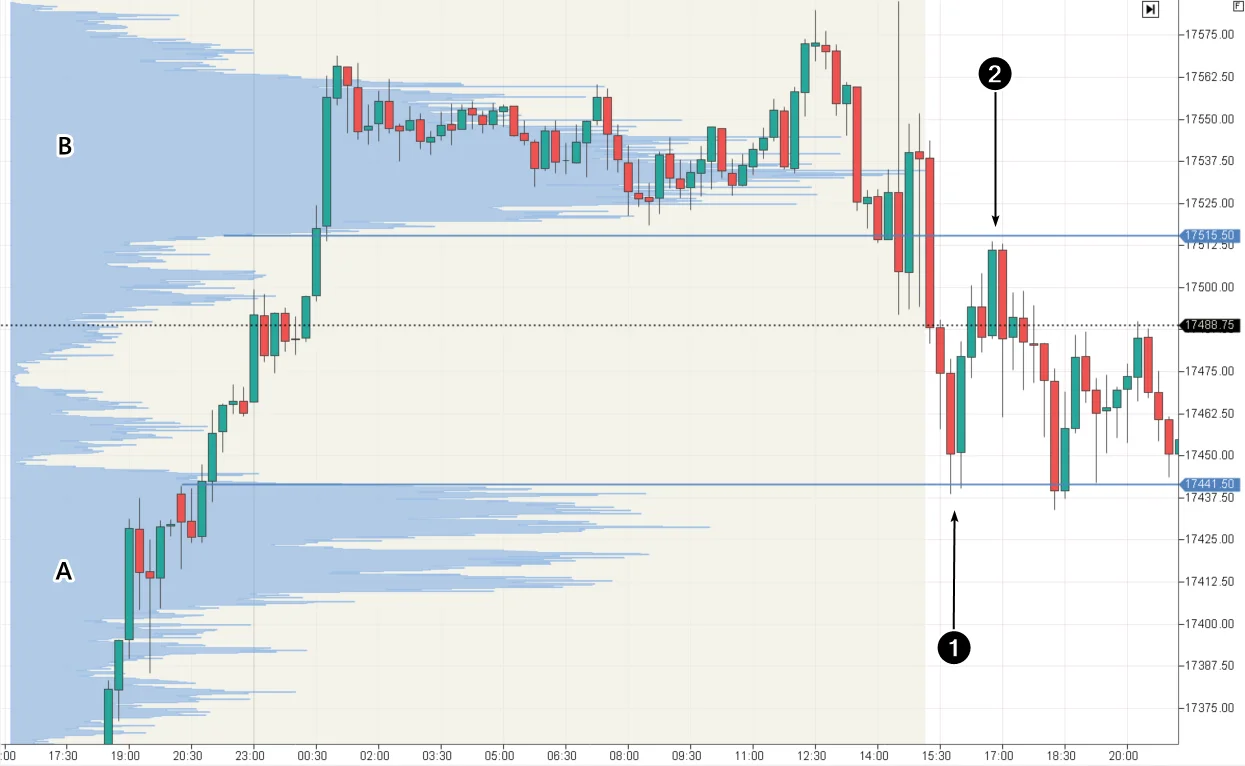
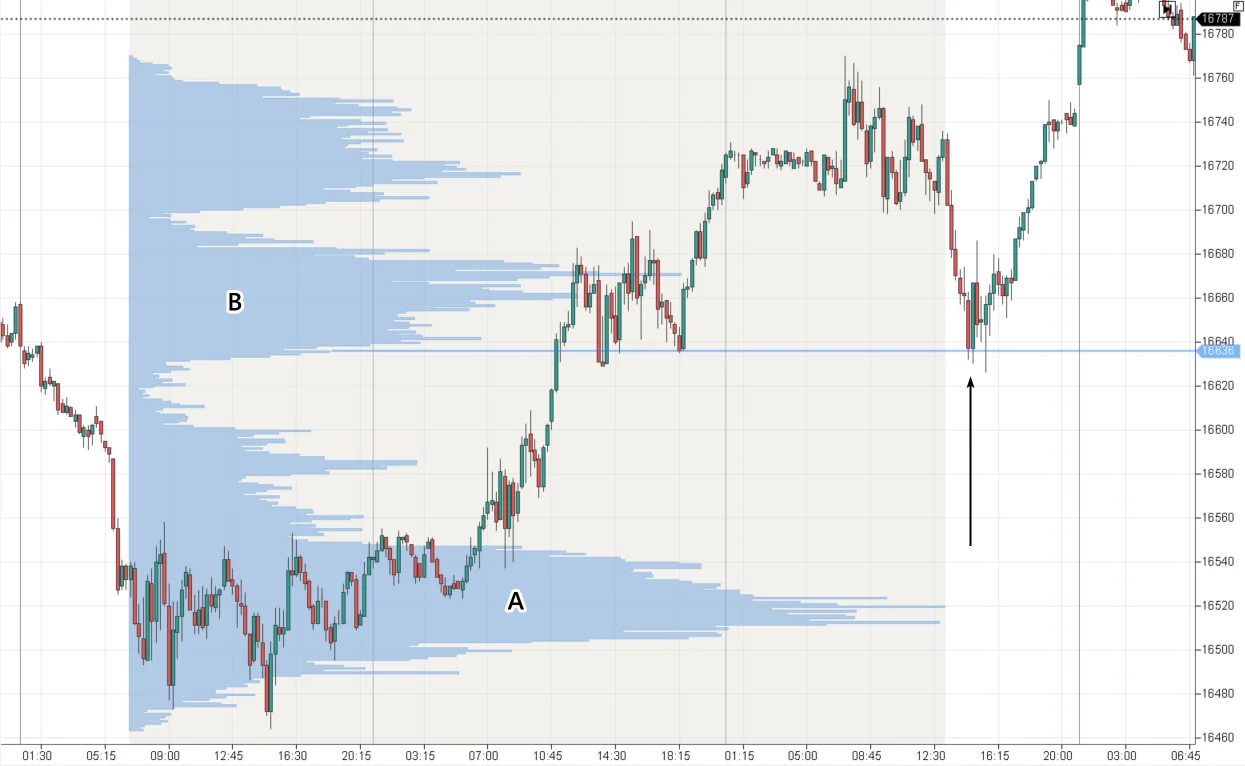
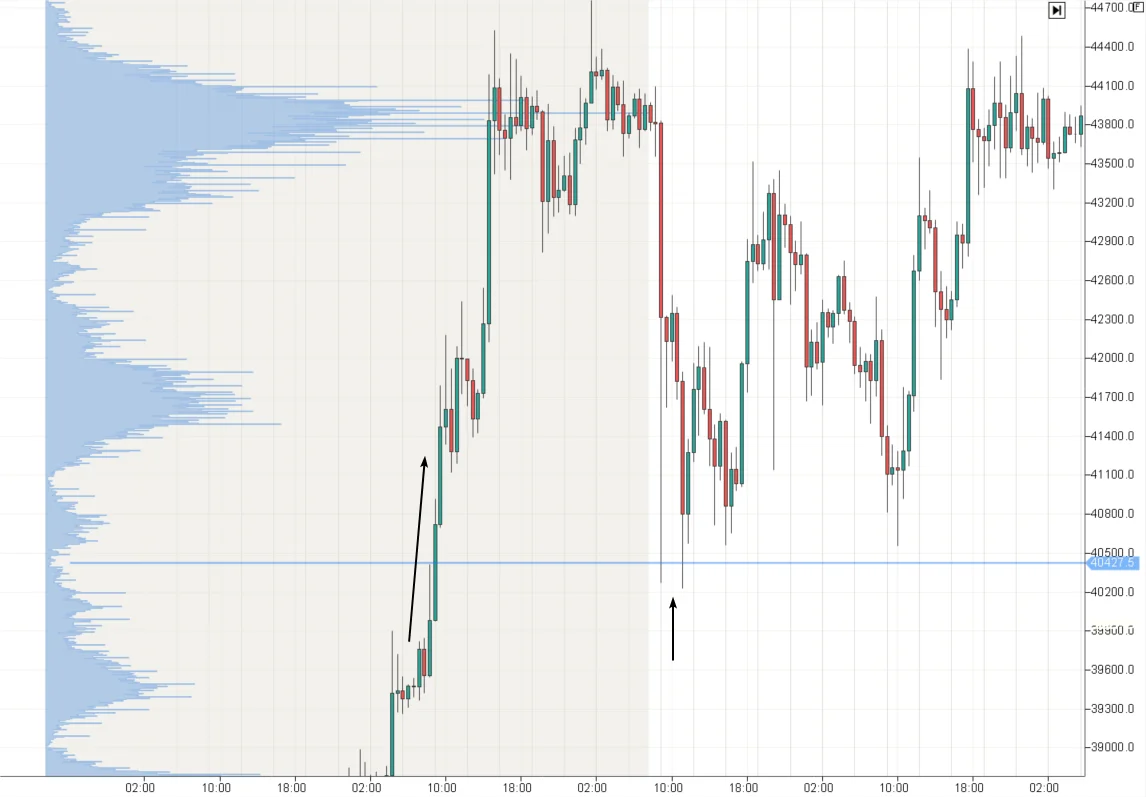
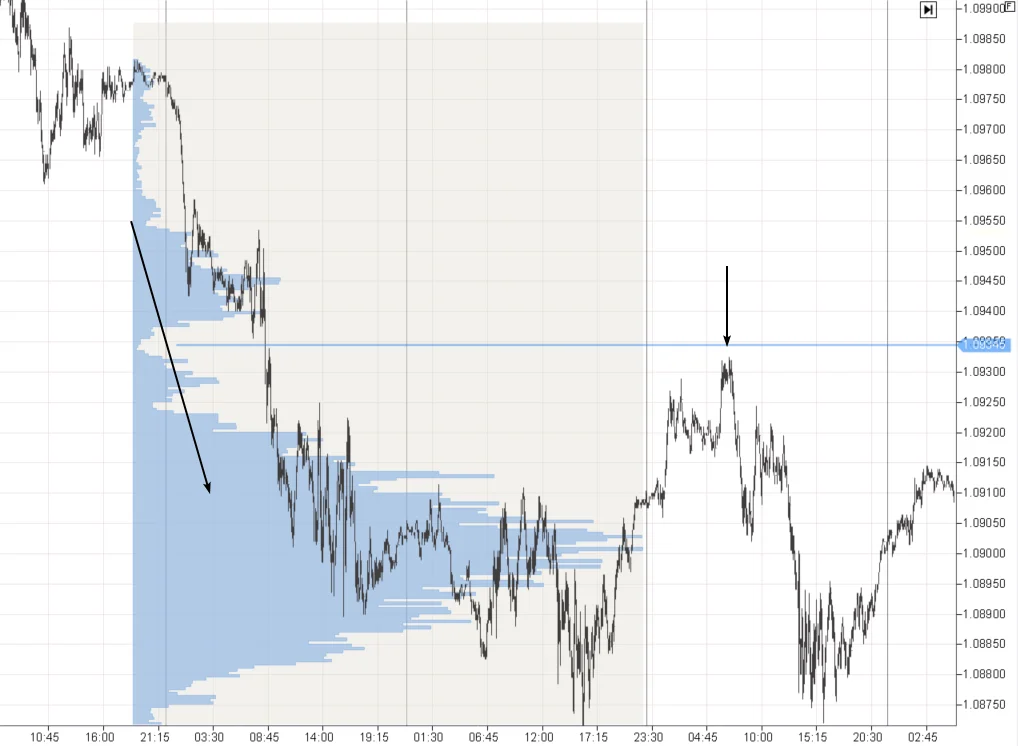
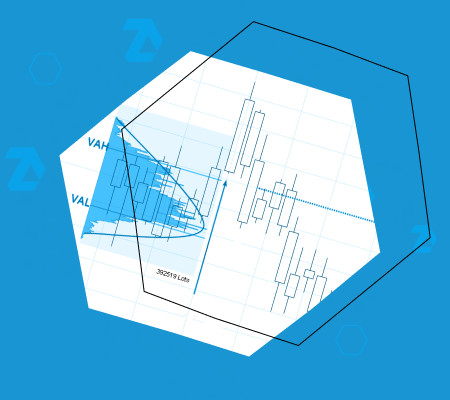
The three mentioned profile characteristics — the level of extremely high volume, the level of contrasting volume change (‘step’), the level of extremely low volume — collectively form a grid of levels on the chart to which the price may or may not react. This variability can be disappointing, so pay more attention to the most significant changes in the profile and strive to improve your ability to track how the price interacts with such areas on the market profile.
Tips for Trading With the Market Profile Indicator
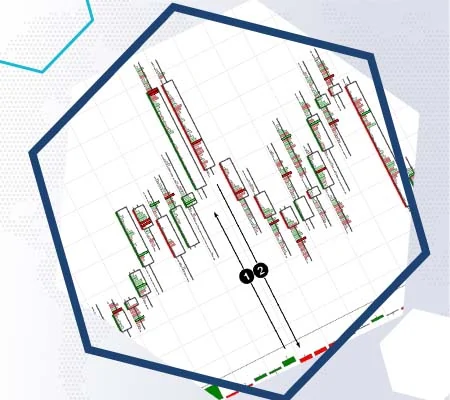
Seek confirmation to validate the accuracy of previously formed hypotheses. For instance, use cluster charts on lower timeframes.
Make your own observations. For instance, note that a retest of a level has less strength than the initial test.
Manage risks. Minimize the chances of hurting your capital by starting with a demo account or a trading simulator on historical charts.
The key recommendation is to have confidence in yourself, dedicate effort to learning market profile patterns, invest in your knowledge, and build resilience to stress.

