Forex and futures markets: how to increase trading efficiency
“People want to solve their problems without much pain, buying a dream. The majority lose their money during the first three months” – said Sergey Shvetsov, First Deputy Chairman of the Bank of Russia, in his interview about Forex trading.
In this article:
- what you need for the forex market analysis;
- how traders lose their money;
- how to increase trading efficiency;
- experiment on improvement of two trading strategies.
Forex traders – who they are, how they trade and why they lose money
Usually, beginners overestimate their abilities to make big money fast. What do you need for successful trading in the financial market?
- Sharp mind;
- Ability to stay calm under stress;
- Accept the risk of losing money;
- Determination and ability to make fast decisions.
If you have at least 3 of the listed qualities, Forex trading is for you. This is what one Forex trading textbook says. If its author is able to analyze Forex trading in 15 minutes, we will also try.
According to the brokernotes.co studies, an average client who trades on Forex:
- is a male (however, the share of females is growing);
- is older than 35 years;
- usually has some stock and/or futures market experience.
He reads exchange analytics and forecasts of famous brokers, which look as follows:
or as follows:
It is not a surprise that following forecasts in the “whether it is raining or snowing” style an average trader makes losses, which is confirmed by facts. “Net loss of traders on Forex is more than RUB 200 million for the past 2 years. Kommersant as of April 11, 2019.
Analysts give accurate forecasts about growth or fall of financial instruments only when it is quite obvious that the price goes up or down. Forecasts in all other cases will look as we showed – without clear recommendations and with vague phrases. Such an analytics could be useful only if you look for confirmation of the selected strategy. Although it is very dangerous to look for confirmation of your own forecasts in analytical reports, since as soon as a trader takes a certain position, he notices only those facts that confirm his strategy and completely ignores those facts that contradict it.
Increase of profitability of trading strategies.
We found two Forex strategies in the Internet. We deliberately chose the simplest strategies with minimum indicators, so that it is easy to notice and check trading signals.
Then we will make an experiment, the goal of which is to:
- assess profitability of a simple Forex strategy;
- find a universal method of increasing efficiency of currency trading.
The experiment will be based on the EUR/USD pair. It is the most liquid Forex pair and it accounts for approximately 25% of all trades. It is the most popular one among traders.
Strategy 1. Forex trading by MACD and Stochastic indicators
We will need MACD (26,12,1) and Stochastic (5,3,3) indicators and a pair of moving averages for the first strategy:
- With the period of 5 at the closing price;
- With the period of 5 at the opening price.
Strategy rules. We open long positions when:
- Stochastic leaves the area of overselling of 20;
- MACD is higher than the previous bar;
- Moving averages intersect;
- Bullish candle.
We open short positions when:
- Stochastic leaves the area of overbuying of 80;
- MACD is lower than the previous bar;
- Moving averages intersect;
- Bearish candle.
Stop loss is 20 points and the position is closed at the next intersection of moving averages.
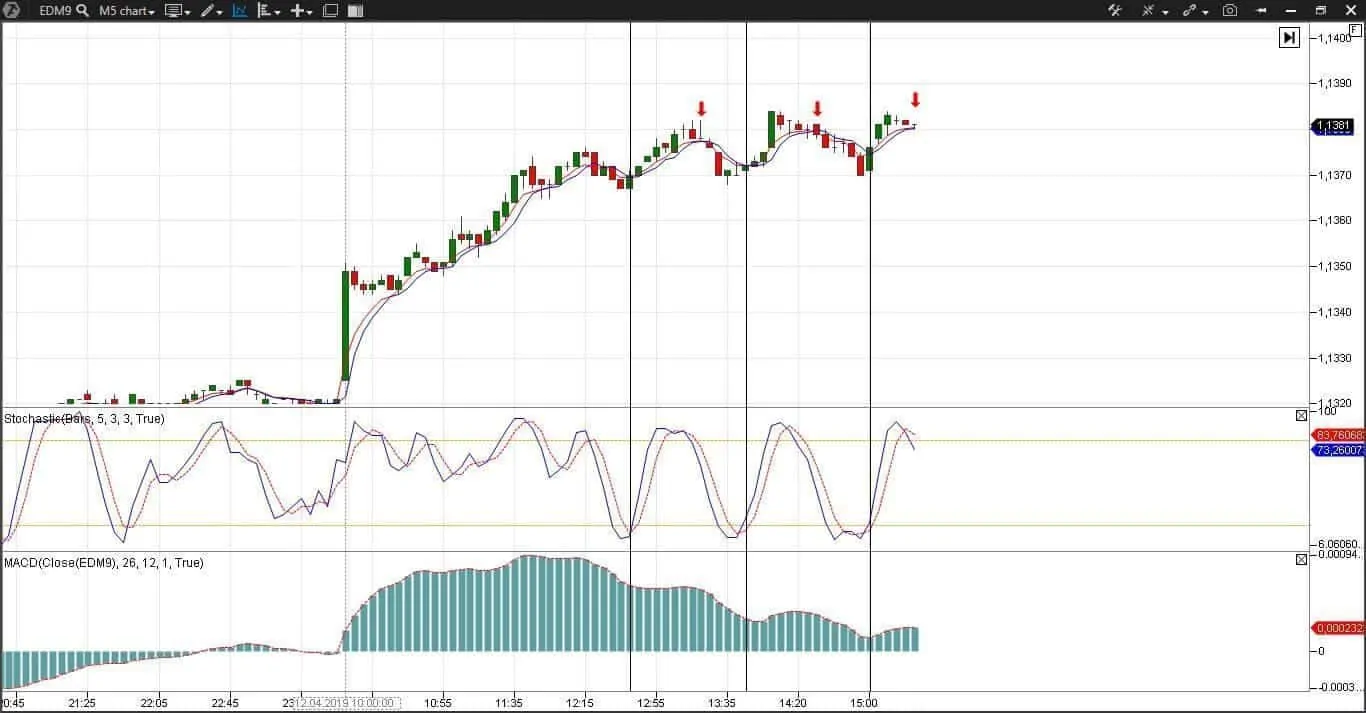
Below is the 5-minute EUR/USD futures (EDM9) chart. We marked:
- Potential entry points into a long position with black vertical lines;
- Profit registration of closing the positions with red arrows.
If we are disciplined traders and strictly follow our system, we will not open positions because MACD is lower than the previous bar in all cases. If we enter a trade following at least two out of three criteria, we will buy a EUR/USD futures three times.
We will not assess the degree of discipline in this article. Each trader decides himself how exactly he would follow his trading strategy and whether he makes exceptions or not. We will only note that it is important to follow rules date after day. If you trade today by three signals and the next day decide to enter into a trade by two signals only – you do not have a trading system and you just deceive yourself.
So, the system is very simple and clear. Even Quik has similar indicators.
Three profitable trades during one day is a good result. This result could be improved with an earlier trade opening and later closing. Every trader tries to improve this trading system for making a bigger profit and reducing risks. Let us try to do it. Let us create a similar strategy in ATAS with more advanced instruments of cluster analysis.
Let us choose the footprint instead of standard candles and add cluster statistic instead of the technical analysis indicators.
Footprint shows movement of price, volume and order flow in real time. Which means that we see who moved the price and where to. Green cells are aggressive buyers, while red cells are aggressive sellers. We want to see incremental upward progress of green cells when the price moves up. We want to see incremental downward progress of red cells when the price moves down.
The cluster statistic indicator shows basic information – delta, volume, bids, asks, session delta and delta to volume relation – using colors and numbers. The indicator can be adjusted. A trader can select necessary data only. And we did it – we selected only the delta, delta to volume relation and volume itself. Dark-grey cells are a big volume; the darker they are the more contracts were traded into the respective candle. Green and red cells are the overweight of buyers or sellers of more than 30% of all the contracts; the cells are marked with brighter colors.
Such an obvious overweight of one side should attract attention of traders, since:
- first, it is a strong and focused price movement;
- second, these are those price levels, at which support and resistance are formed.
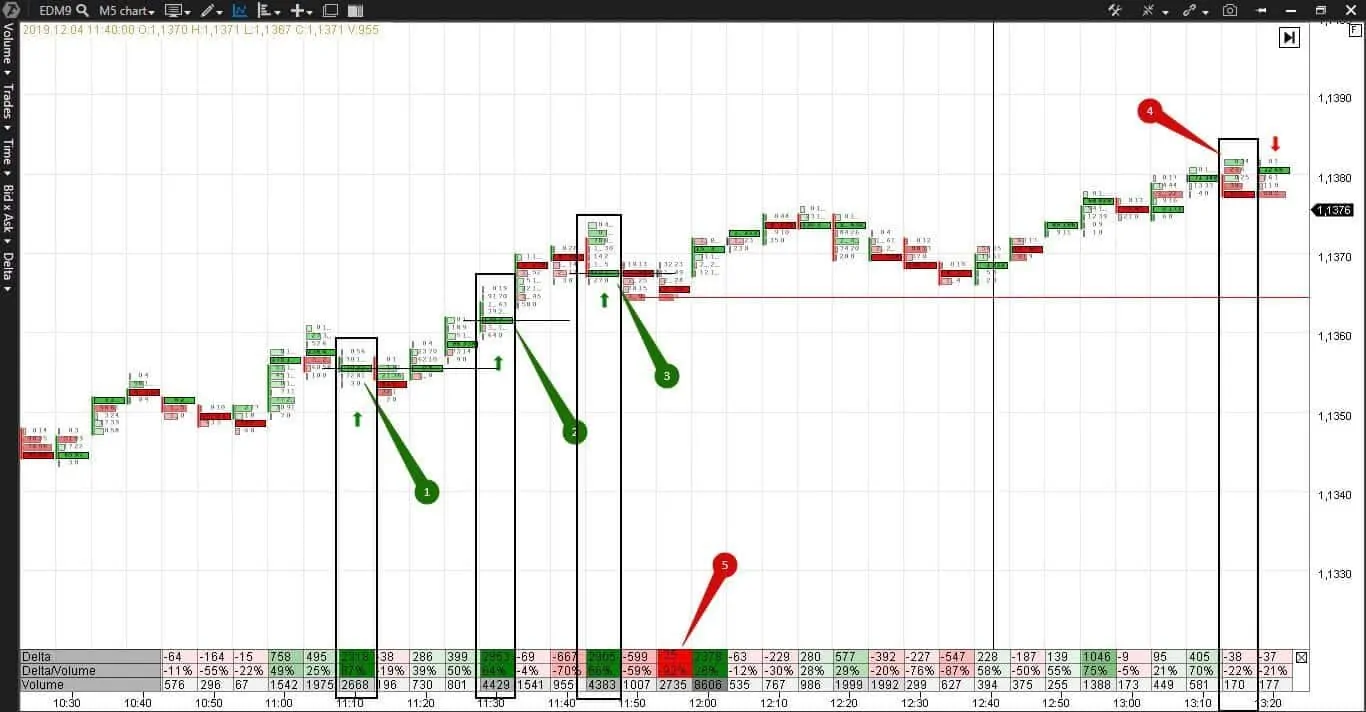
Numbers 1, 2 and 3 mark candles with pronounced buys and the levels of maximum volume of each bar move upward. We can open a long position three times. Note that levels of possible opening of long positions are marked with black lines and the trader should not hurry and can enter a trade with a limit order. Moreover, we can move the stop automatically with the help of the protective strategy. Moving the stop to the breakeven level and higher, we can protect the position for saving profit.
Number 5 marks aggressive sells, which failed to break the support level, marked with a red line. This level worked during the whole day and it could have been used as a barrier for setting stops.
Entry by the Forex system, marked with a vertical black line, is 19(!) bars further than the first entry by the ATAS strategy. 19 bars are equal to minimum 10 ticks of profit, 95 trading minutes and 2 additional potential entries into the buy by the ATAS strategy.
We will close our long positions in red point 4 – it is a local day’s low, where delta becomes negative. We already received significant profit, so, let us not take risks and not be greedy. The Forex trading system is a bit late here and the trade closure should take place one bar later.
Let us continue our experiment.
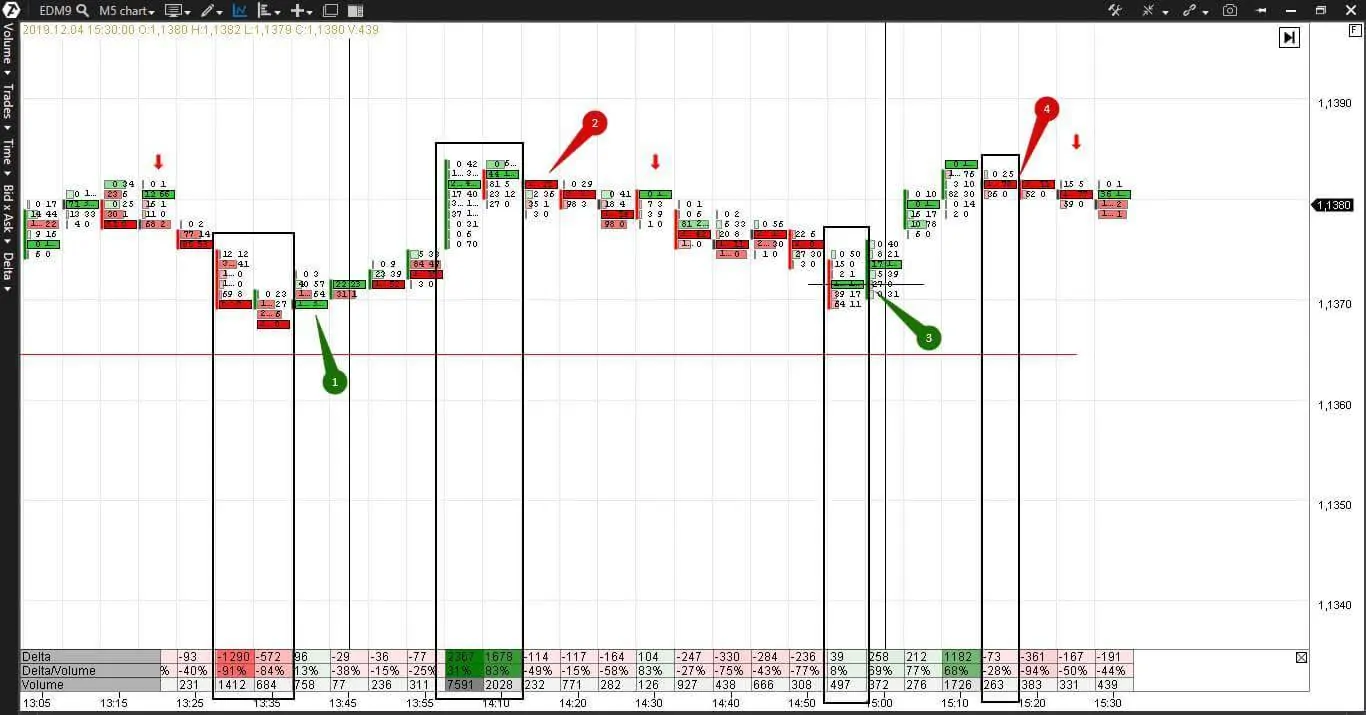
Development of the same trading session is in the next chart.
Remember that the red horizontal line is the support level, which was formed during the morning hours. The entry signals of the trading ATAS platform are marked with green points 1 and 3. The trade closure signals of the trading ATAS platform are marked with red points 2 and 4. All signals emerge earlier than in the Forex strategy, which means that traders who use the cluster analysis work more efficiently.
We open the first long position after a failed effort of sellers to push the price downward. As soon as the delta changes at the local low and the maximum volume level moves upward, we can enter into a long position with a stop at the level of the red line or immediately after the low of the previous bar. We close this position after a failed effort of buyers to push the price upward and the delta change into negative at the local high.
We can build a very simple trading system from three criteria:
- movement of the maximum volume level;
- change of the delta into opposite;
- failed pressure of buyers/sellers.
It’s interesting that number 3 plays a special role in the technical analysis. The fan principle consists of three lines. Bullish and bearish markets have three phases of development. Analysis use triple peaks and valleys, three types of price breaks, three white soldiers, three triangle types and so on and so forth. Japanese consider number three to be a lucky number and many traders also think so. And although we are not superstitious, we also selected three criteria for a simple trading system, based on the cluster analysis.
Remember that any system needs to be tested on historical data and nobody guarantees future profitability based on the results of the past.
Strategy 2. Forex trading by CCI (Commodity Channel Index) indicator.
Let us consider one more Forex strategy based on two moving averages with the periods of 40 and 80 and CCI indicator with the period of 21. By the way, ATAS has a modified and more descriptive Woodies CCI indicator, but we will use the standard one to maintain the experimental integrity.
Rules of the Forex strategy. We open long positions when:
- EMA(40) is higher than EMA(80);
- CCI crosses the zero line bottom-upwards.
We open short positions when:
- EMA(40) is lower than EMA(80);
- CCI crosses the zero line top-downwards.
The stop and take-profit are 10-15 points.
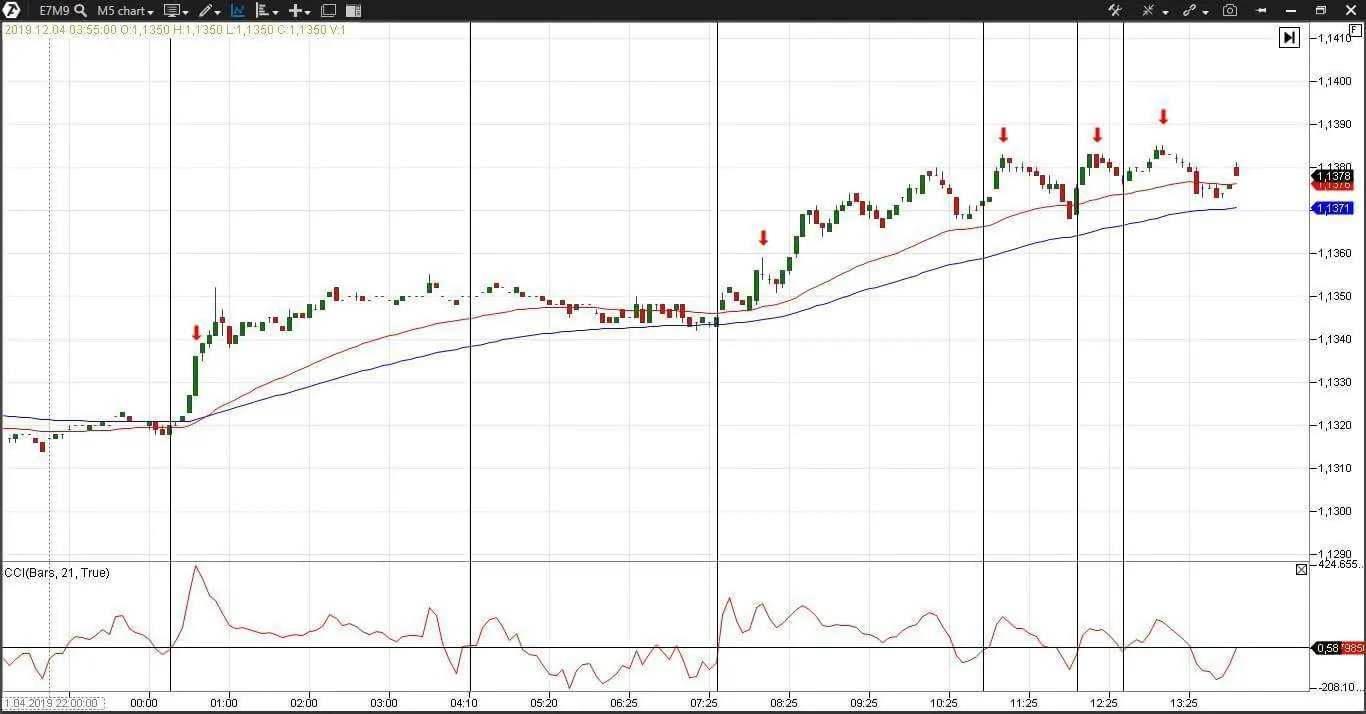
Let us implement this strategy in the 5-minute chart of a EUR/USD E-mini Euro futures (E7M9).
We again marked potential points of entry into long positions with black horizontal lines. We marked the points of closing positions when reaching the planned profit plus 15 points with red arrows. Since EMA(40) is always higher than EMA(80), we can trade with long positions only.
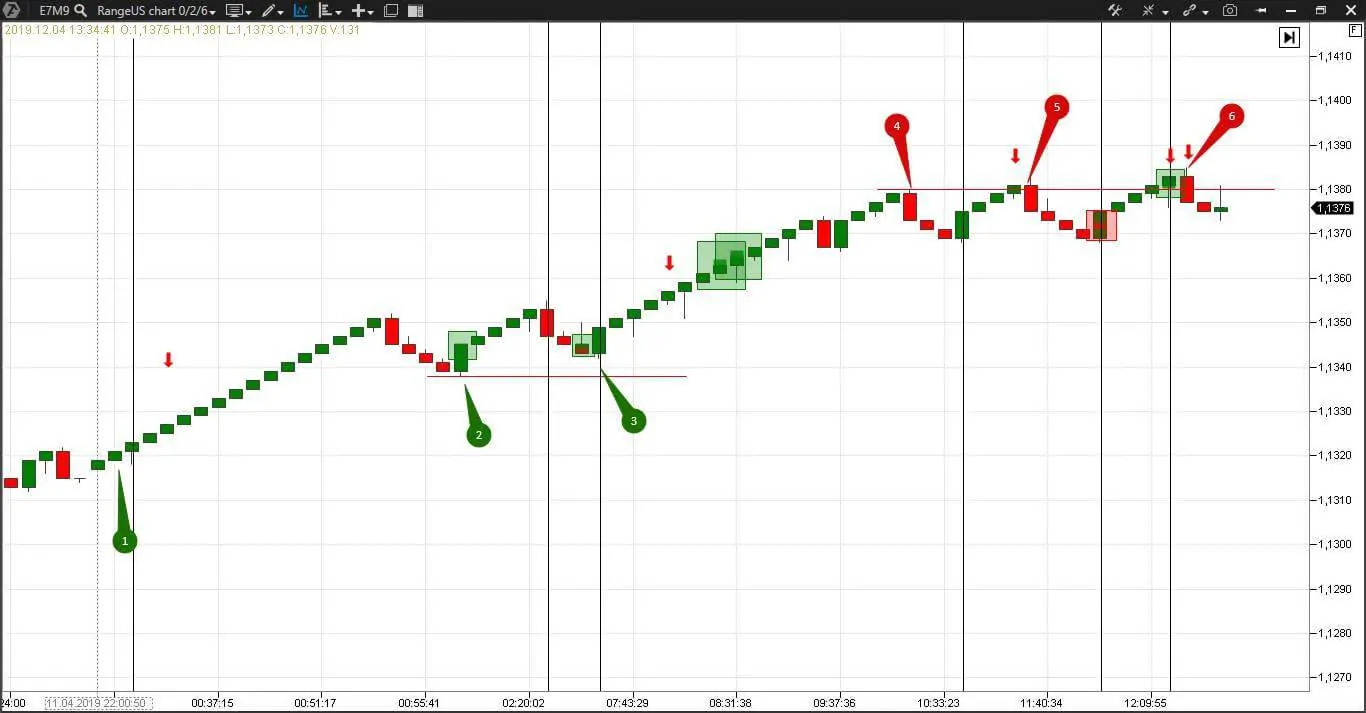
We improved this strategy in ATAS and chose the RangeUS 0/2/6 type of a chart, which is not connected with time and volume. If you want to learn in more detail how these charts are built and how useful they are for traders, please, read the article How to Search for Trades in the RangeUS chart.
We added the Big Trades Indicator to search for major buyers and sellers. This indicatopr has a convenient autofilter and we will not change settings.
Points of entry into long positions by the ATAS strategy are marked with green 1, 2 and 3 numbers. Points of exit from long positions are marked with red 4, 5 and 6 numbers.
We open a trade in point 1 after the reversal bar, while the price is growing, and use protective strategies again. There is no sense to close our position since we moved the stop in the black rather fast. We will hold it and accumulate the profit. We again open trades after reversal bars in points 2 and 3. Major buys, which we can see due to the Big trades indicator, confirm correctness of our decision once again. We will increase the number of contracts here since we already made profit. The level, below which the price failed to move during the whole day, is marked with a red line. Note that one of the points of entry into the long position by Forex strategy falls at the falling candle. It wouldn’t have entered into our mind to open this trade in the ATAS strategy.
A strong resistance level was formed at the day’s high and it is also marked with a red line. The buyers cannot push the price higher, that is why we will register profit here. We can do it as many as three times posting limit orders.
Let us draw conclusions. In the table below we calculated potential profit in two different strategies.
| Currency pair by the Forex strategy | EUR/USD futures by the ATAS strategy | |
| Number of profitable trades | 5 | 3 |
| Number of loss-making trades | 1 | 0 |
| Number of pyramid trades | 0 | 2 |
| Potential profit per trade | 0.0015 – maximum | 0.0024 – minimum 0.0035 – minimum 0.0031 – minimum |
| Potential total profit | 0,0075 | 0,0090 |
| Commissions | for 6 trades | for 3 trades – the number of trades can be reduced without reducing profit. |
We can make the following conclusions after the above comparison of the Forex and ATAS strategies.
Experiment conclusions and brief summary
Trading efficiency is increased by:
- cluster analysis;
- unique professional indicators;
- trading on the exchange and not against your dealer;
- lengthy position holding;
- position accumulation in the trading process;
- protective strategies of moving stops to the breakeven and profitability level;
- discipline and following your trading system.
We wrote many times about the fact that your vision and understanding of the market situation exerts huge influence on the quality of trade execution. You can find your trader’s path with Forex and moving averages, but in the process of gaining experience and in the course of time you develop understanding that it is not sufficient for constant efficiency.
You need a competitive advantage for consistently profitable trading. In case you haven’t found your competitive advantage yet – try ATAS.

