Read in this article:
- Patience is an important trader quality.
- Big Volume and big Delta.
- Extreme cluster.
- Price reaction.
Patience is an important trader quality
‘Specific’ clusters or areas of their accumulation are rare. That is why it is important for a trader to be capable of waiting for a moment, which most accurately corresponds with his trading system. You should spend 90% of time waiting for a good trade and only 10% of time for trading. A trader is like an experienced fisherman who should wait for fish biting rather than create noise and shift around.There are 3 ways, which can help a trader to wait for a good trade:
- Describe your trades. Thoughts and ideas, which are noted down on paper, could help a trader to understand himself and reasons for his trades better. Describe both good and bad trades. What mistakes were made? What actions were proper and should be repeated in the future? If you showed impatience, what was the reason? How to avoid such situations in the future? There could be a several day interval between good trades. Use this time to analyse your trading properly.
- Take your time. A trader should not have a goal to become a millionaire in one month. It is possible in gambling but not in trading. Trading is a profession and you need sufficient time for mastering it and acquiring experience. That is why you shouldn’t hurry. Just allocate several years for becoming a professional. Understanding the time perspective will help you in everyday trading to wait calmly for a favourable situation, which specific clusters provide.
- Take sufficient rest. In case you are tired and feel tension or nervousness, the error probability increases. Trading is an analytical activity, that is why your brain should have a good rest from time to time. Have a break if you are tired. Do not trade for several days and spend some time with your relatives or your hobby. It will help you to avoid errors and, as a consequence, losses.
Big Volume and big Delta
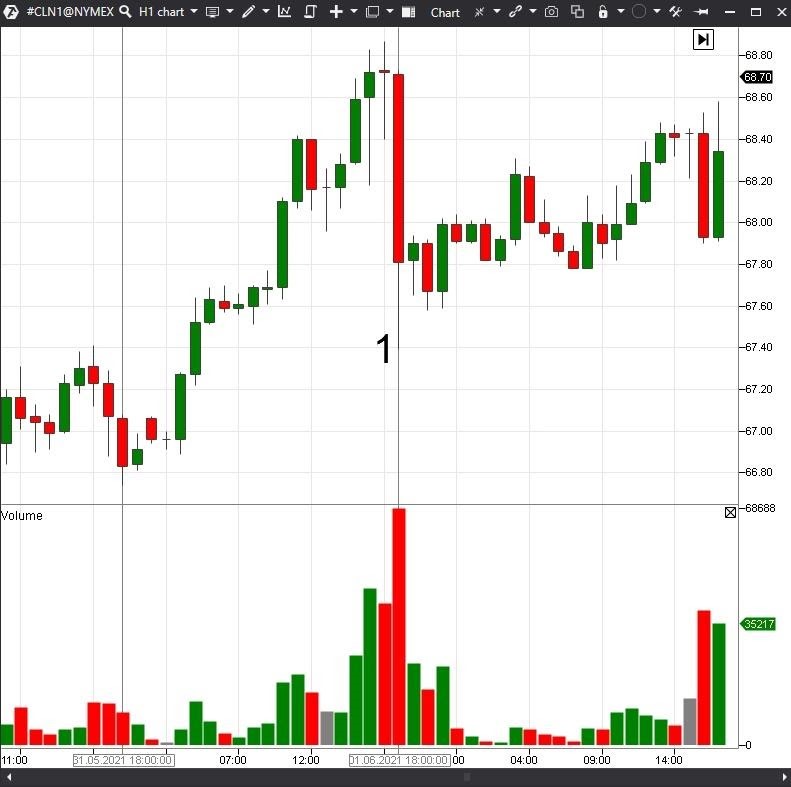
The Vertical Volume indicator from the trading and analytical ATAS platform will help you to find ‘specific’ clusters.A ‘specific’ cluster is an important price for a major player and a high Volume indicator value, as a rule, points to activity of professional market players.
Let’s consider an example in the North-American oil chart (CL futures; hourly time-frame):
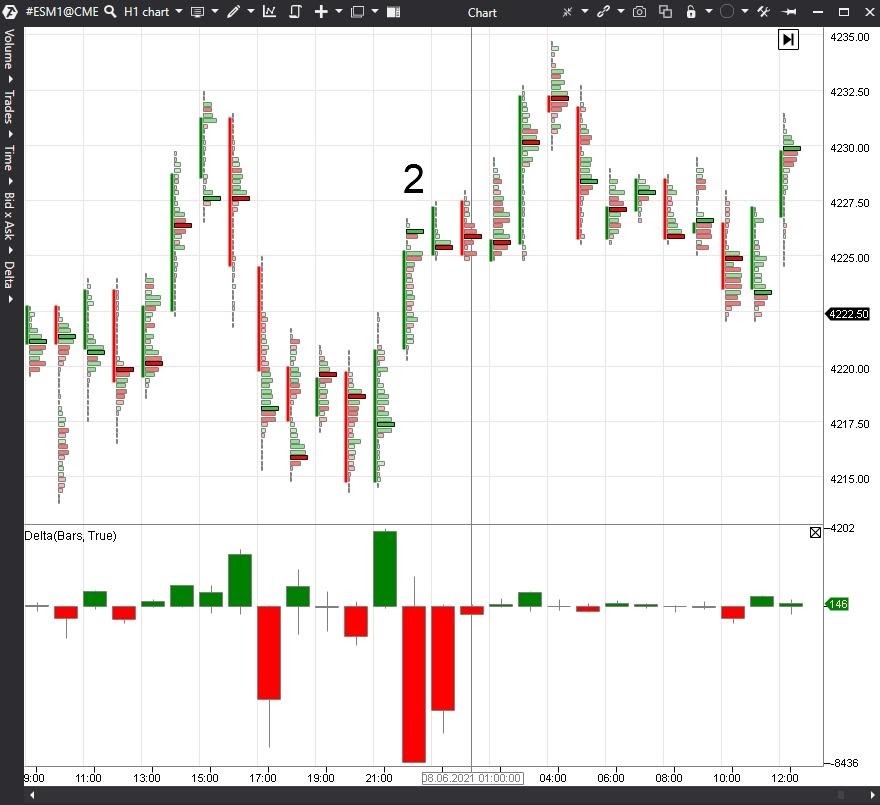
The second indicator, which may show specific market places, is Delta. The Delta indicator shows the difference between the market buys and sells.
If there is an explicit predominance of sellers or buyers, it means that this is an interesting place in the market. If there is an obvious predominance, which the positive Delta shows, but there is no up movement, it means that there is a major limit seller in the market. Perhaps, this seller absorbs all market buys and in so doing doesn’t allow the market to move up. Only major market participants can do that and you should pay attention to such places.
Let’s consider an example in the S&P 500 index chart (ES futures; hourly time-frame):
So, these two indicators (Volume and Delta) could be good assistants in identifying specific market places, which are important for major players.
Let’s move now to the direct definition of a ‘specific’ (or extreme) cluster.
Extreme cluster
How to find an extreme cluster?Open a cluster chart in the trading and analytical ATAS platform (review article with instructions for working with cluster charts).
Set the Graduated Volume mode in the cluster chart settings:
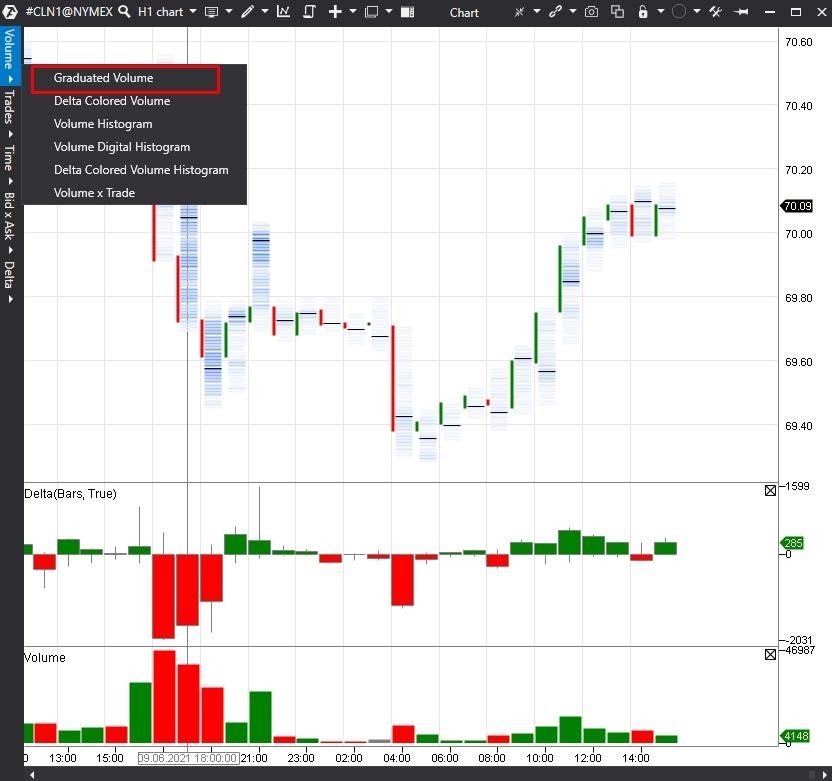
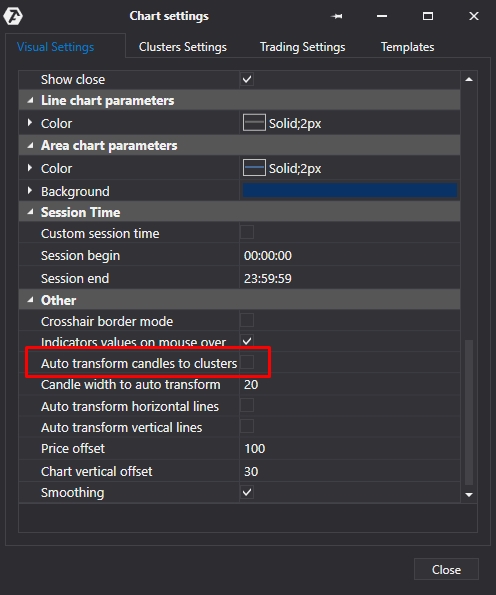
What will help you to find entry points after the emergence of an extreme cluster?
Price reaction
You can understand whether an extreme cluster influenced the market only when you see the price reaction. In other words, you shouldn’t look for entry points immediately. It is preferable to wait for the next volume inflow area testing and look for an entry point after that only. Patience will serve you.Let’s consider an example in the North-American oil chart (CL futures; hourly time-frame):

The Volume indicator shows a rather big volume on this candle compared to the neighbouring candles. Everything indicates that, most probably, this area could serve as the price support level. It is important to remember that you should take into account an area, a certain price range, rather than a specific level. This happens because it is difficult to pump a big volume into the market at a specific price, since there is not enough liquidity. A big volume can be distributed within a certain price range.
Further on, the first price reaction to the extreme cluster takes place in point 2 and the price bounces up. After that you can look for possibilities to enter the market.
Yet another bounce from the extreme cluster price range takes place in point 3, which provides a possibility to enter by a limit order with the minimum stop loss size. The price starts to move up after that.
One more example
Let’s consider an example of an extreme cluster, after which you may look for entry points for selling. Let’s consider the 6E futures chart (hourly time-frame):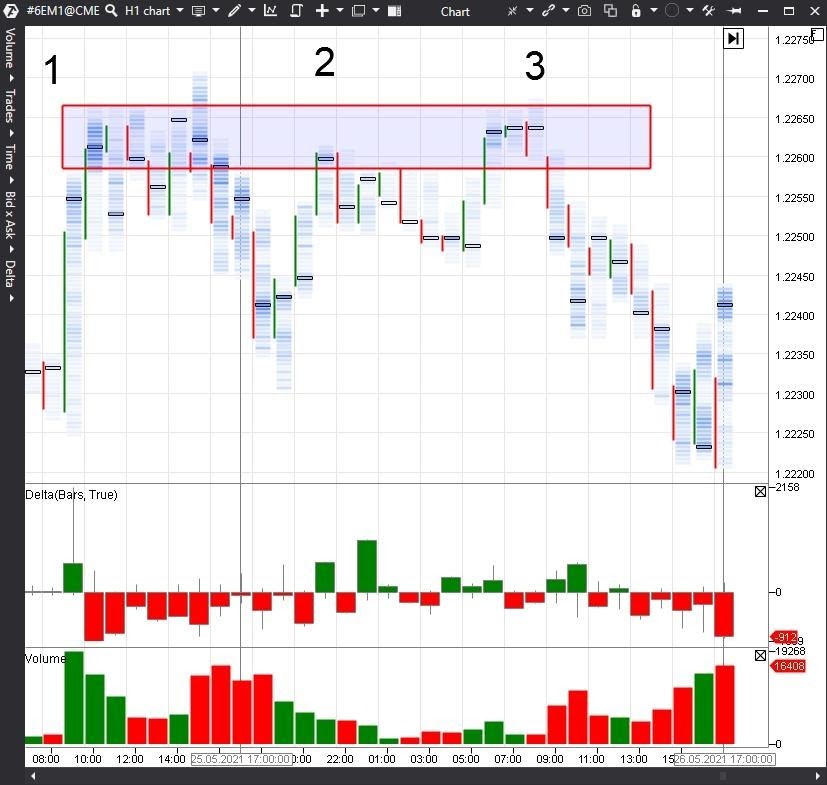
You could see a price bounce from the extreme cluster range in point 2. After that, you could have started to look for the market entry points for selling.
Point 3 provided an opportunity to enter the market by a limit order and a stop loss could have been posted behind the extreme cluster area. After that, the price down movement started.
If you look for market entry points in a global trend, their efficiency will be higher. Such an approach may help to find trend correction endings and enter for continuation of the main movement.
You need time for mastering any new trading system. That is why, allocate sufficient time for analysing movement of a trading instrument and collection of the trading system efficiency statistics.
Conclusions. What to do in practice?
You should be able to wait for a good trade. That is why, develop your patience and do not hurry. The market will always provide opportunities to make money to those who understand what they do. Use the ATAS platform instruments to find a specific cluster:- Graduated Volume in the cluster mode of the chart display will automatically show strong inflows in the market.
- The Volume indicator will point to the candle, which you should pay attention to. Especially analyse all candles with an extremely big volume.
- The Delta indicator will help you to see if there is a major limit player. Track а big Delta and absence of further movement along the Delta direction.
- Price reaction will confirm the correctness of your conclusions. You can start looking for the market entry points after a bounce from an extreme cluster price range.
Trade without hurry and with your eyes open and the trading and analytical ATAS platform will help you in it!
Information in this article cannot be perceived as a call for investing or buying/selling of any asset on the exchange. All situations, discussed in the article, are provided with the purpose of getting acquainted with the functionality and advantages of the ATAS platform.

