How to analyse stock quotes in real time
In this article, we will speak about price quotes:
- what it is;
- where to view the quoting history;
- quotes in real time.
Quote is the cost or price of a commodity. The word originates from the French ‘to number’ or ‘to mark’. Securities are quoted or numbered on the exchange and registered in the quotation list. The stock quote on the exchange is identification of the price during trades and price publication in the quotation list. Sometimes this term is used for marking the rate of securities.
By the way, not all securities, which are admitted to trading, are quoted. This occurs because the requirements for admitting into the quotation list are stricter than for admitting to the exchange trades.
Stock quotes. What they are?
Prices (or quotes) could be different in the stock market:
- Bid price is the highest price, at which the buyer, who posted a limit order, is ready to buy. This is the price, which the market sell order meets.
- Ask price is the lowest price at which the seller, who posted a limit order, is ready to sell. This is the price, which the market buy order meets.
- the opening price;
- the closing price.
You can read more about bids and asks in this article.
Usually, the price is expressed in money units. For example, the Sberbank stock are quoted in RUB, while oil futures – in USD. However, sometimes quotes are expressed in percentage. It is typical for the exchange bond market.
There are 2 levels of quoting on the Nasdaq:
- Level 1 or time & sales tape provides data about the best bid and ask prices, number of lots and most recent price.
- Level 2 or order book provides a more complete format of information, because it shows what types of traders sell or buy stock in real time. This information helps experienced traders while it may confuse novices. We often tell you in our blog that the managed money confuse the market players deliberately in order to get additional advantages and profit, that is why you should use the order book with your eyes open.
Forex quoting
They trade currency pairs in the currency market (Forex). That is why the quotes there are different from the quotes in the stock market. They could be:
- direct – relation of any currency to the USD, for example, EUR/USD;
- indirect – relation of the USD to any currency, for example, USD/RUB;
- cross-rates – relation of different currencies to each other. Cross-rates are calculated through the USD.
Quoting history
Traders analyze the asset value at the current moment of time with the help of quotes. Traders check how successful their robot or algorithm is with the help of the history of stock quotes. Quotes are present in all trading systems and on analytical web-sites.
As a rule, free data are provided with a delay. Time delay is not critical for investors, but it is important for intraday traders to see stock quotes in real time. They could be received through:
- the brokers that have a direct access to trades;
- the online observation.
The standard software for the quote history observation are MT and Quik. Brokers often offer additional more powerful and interesting software which allows analysing both historical data and stock quoting in the online mode.
Prices could also be checked directly on the exchange web-sites. But the exchanges also show the data with a delay. You may download day data about the results of futures contract trading on the Moscow Exchange web-site.
The deeper and more complete history of stock quotes is, the bigger number of setups and algorithms could be checked. The depth and accuracy depend on the data supplier. As a rule, it is possible to download the data for different time-frames – form long-term (for example, monthly and weekly) to the most popular among intraday traders 1-minute chart.
Historical quotes of different brokers could differ and you also need to take into account day-light saving time and week-ends.
It is important to remember that the algorithm development starts with understanding of the market and trader logic. A trader finds a repeated regularity, which he successfully and often trades manually, and makes it automatic. It is dangerous for your deposit to use ‘black boxes’ – strategies the principles of work of which you do not understand.
It is important to pay attention to different activity at day and night time and also to the availability of ‘holes’ in the downloaded data when you look through the quoting history. ‘Holes’ are gaps in the price history. They may appear due to low activity of trades or broker mistakes. It is not informative to test your strategy on the ‘broken’ data, since the received results would differ from those which were received on the basis of the correct data.
Software for viewing the quoting history
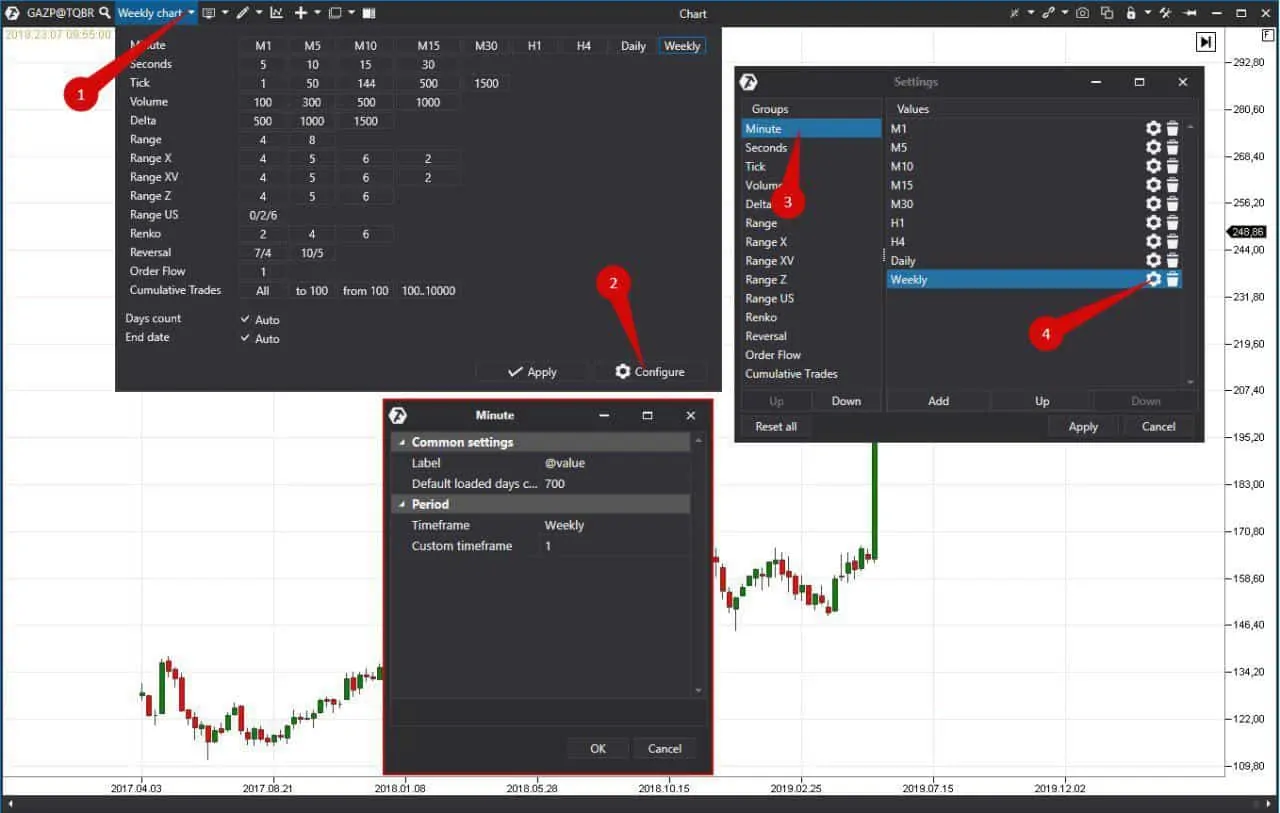
Traders can set different periods for analysis of the stock quoting in the ATAS platform. To do it, go to the upper menu (1), select period (2) and press the setting wheel (3).
You can view not only stocks, but futures and even ETF in the ATAS platform.
Dynamics of the stock quoting allows investors and traders to judge the market moods and financial state of a company. Stocks of stable and long existing companies, as a rule, do not change in price sharply and strongly. However, there are exceptions which are connected with positive or negative news or financial reporting.
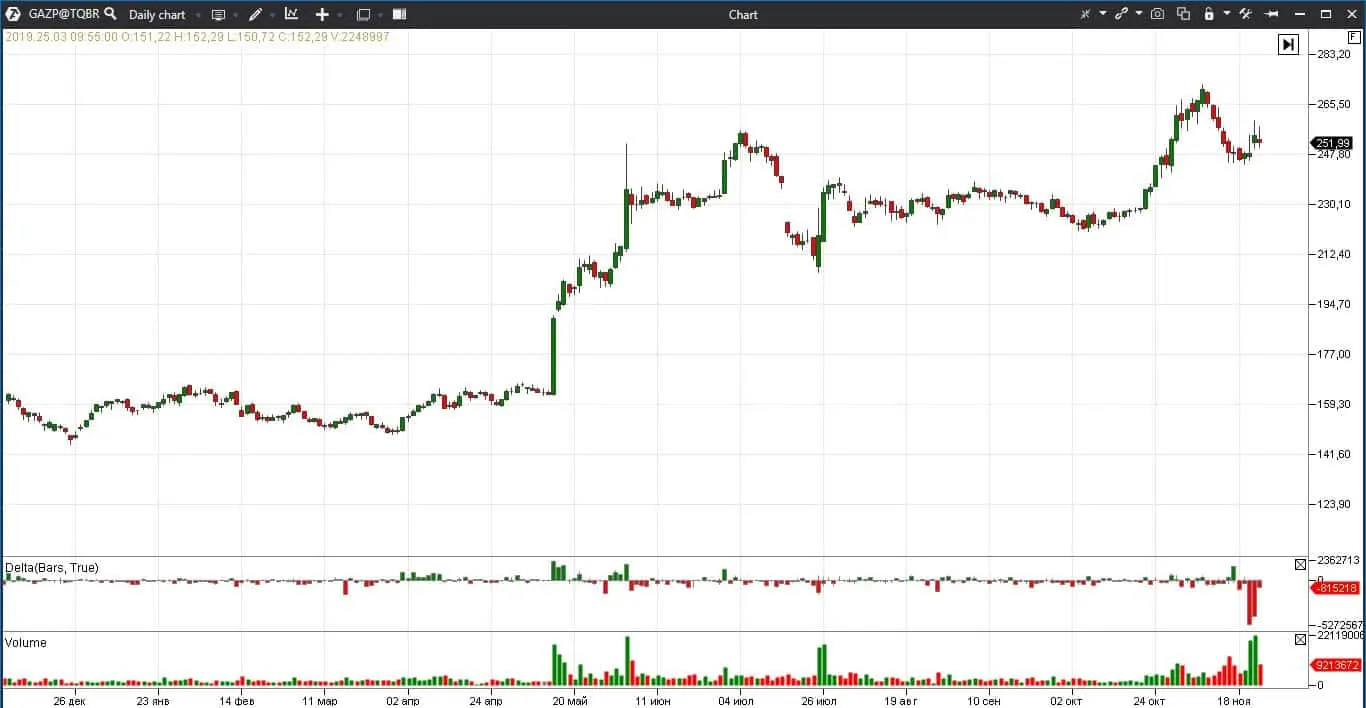
For example, Gazprom stock quotes impressed and surprised investors in 2019. The stock increased in price from January 3 until November 22, 2019, by 37.8% from RUB 156.28 to RUB 251.99. Their dynamics allowed both investors and intraday traders to make a profit.
The sharp growth started in May when investors learned about the fact that the company would pay much bigger dividends than before. The online stock quotes increased by more than 16% on May 14, 2019. And traders who traded Gazprom stock futures managed to make even more by means of the guarantee collateral (in general, about RUB 4,000 for 100 shares). Volumes of trades in futures and stock increased compared to 2018.
Analysis of the quoting charts
ATAS has stock quoting charts of the Russian and American markets. You can select a good moment for investments or speculative trading with the help of the modern cluster analysis. There is an expanded set of instruments of the technical analysis, for example, the ZigZag pro, Woodies CCI and Margin Zones indicators for conservative traders.
The stock and futures quote analysis takes less time in the modern software and allows to find setups with a high reward-risk (R:R) ratio. In the event you haven’t yet developed your own algorithm or robot, which increases your deposit without your participation, master manual trading. All successful traders started from it and practically all of them lost some part of the start-up capital. Everyone can see free stock charts and their quotes. Try ATAS – it will help you to find your own competitive advantage and trading niche.


