In the forward market environment, a continuous contract has a little bit different meaning.
Important feature of futures trading
Existence of a continuous futures contract is connected with such an important feature of a forward contract as the expiration date. The reason why these contracts are called forward is that they have their ‘term of validity’.For example, let’s take an S&P 500 stock index forward contract. It is stated on the CME Group web-site in the ESM21 contract specifications list that trades of this futures contract start on March 20, 2020, and the last trading day is on June 18, 2021.
By the way, the last trading day is encoded in this brief code ESM21, since:
- ‘ES’ means the common code for all E-mini S&P 500 index futures;
- ‘M’ usually means ‘June’ on stock exchanges;
- ‘21’ are the last digits in ‘2021’. You can often come across ‘1’ instead of ‘21’. For example, we use the brief code ESM1 in the ATAS platform.

If you have an open position on a futures contract, under which the expiration date approaches, the broker will send you a notification about it and will recommend closing the position on your own. In case you do not do it, the broker will close the position forcedly on the expiration day and will register the closed trade financial result on your account. He has the right to do it under the brokerage agreement.
The described processes are clearly seen in the daily period volume chart. Let’s take, for example, a March E-mini S&P 500 index futures with the code ESH1. Letter ‘H’ means expiration in March.

After that traders switched from ESZ0 to ESH1 and we see gradual accumulation of ESH1 trading volumes in the mid December 2020. The last ESZ0 trading day was December 18, 2020 (as it is stated in the specifications list), and ESH1 contract was traded ‘at full pace’ on that day.
Note that the volume profile in the left part of chart ESH1 (Period = Contract) becomes wider only above level 3629.5, since the March contract was traded at lower prices only until mid December 2020 and those were very inactive trades.
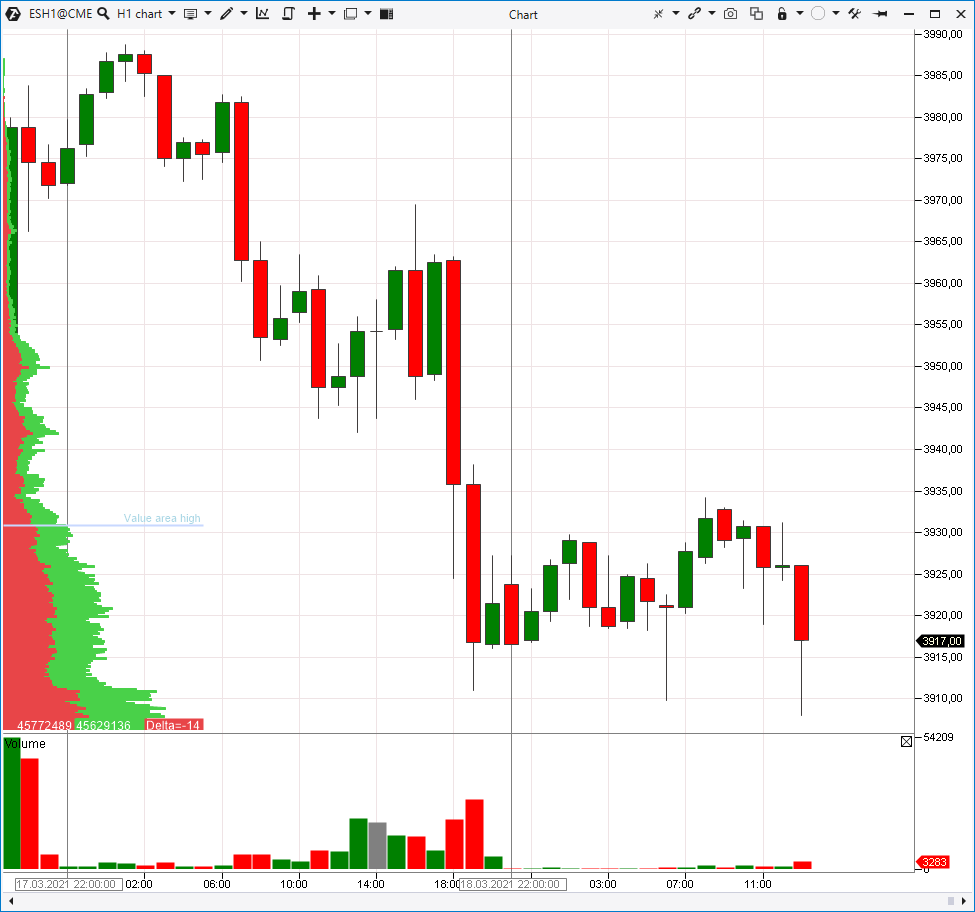
ESH1 trades looked as follows on the expiration day (Last Trading day = 19.03.2020):

And now we closely approached the ‘continuous’ concept. If you still do not understand clearly what futures and their expirations are, we recommend you to read the following articles:
The continuous futures concept
No matter whether these expirations are convenient or not, professional futures contract traders got used to this state of things, which has developed historically. It is believed that the modern forward market originates from the Osaka Exchange, where they started to trade rice futures in the 1700s, although some studies point to the existence of futures contracts as early as in the 18th century B.C. in Mesopotamia (territory of modern Iraq).Whatever it was in ancient times, the current inconvenience when working with futures charts is connected with the fact that it is important for traders and analysts to assess wide prospects. How, for example, to view the price and volume chart of ES futures trading for 1-2 years if expiration takes place only once a quarter?
Trading data for 3 months after expiration will provide the most trustworthy information about ES. It turns out that to receive an annual chart, you need to:
- take charts of trading 4 various futures;
- cut them approximately on expiration days to identify high activity periods;
- ‘paste’ four 3-month pieces.
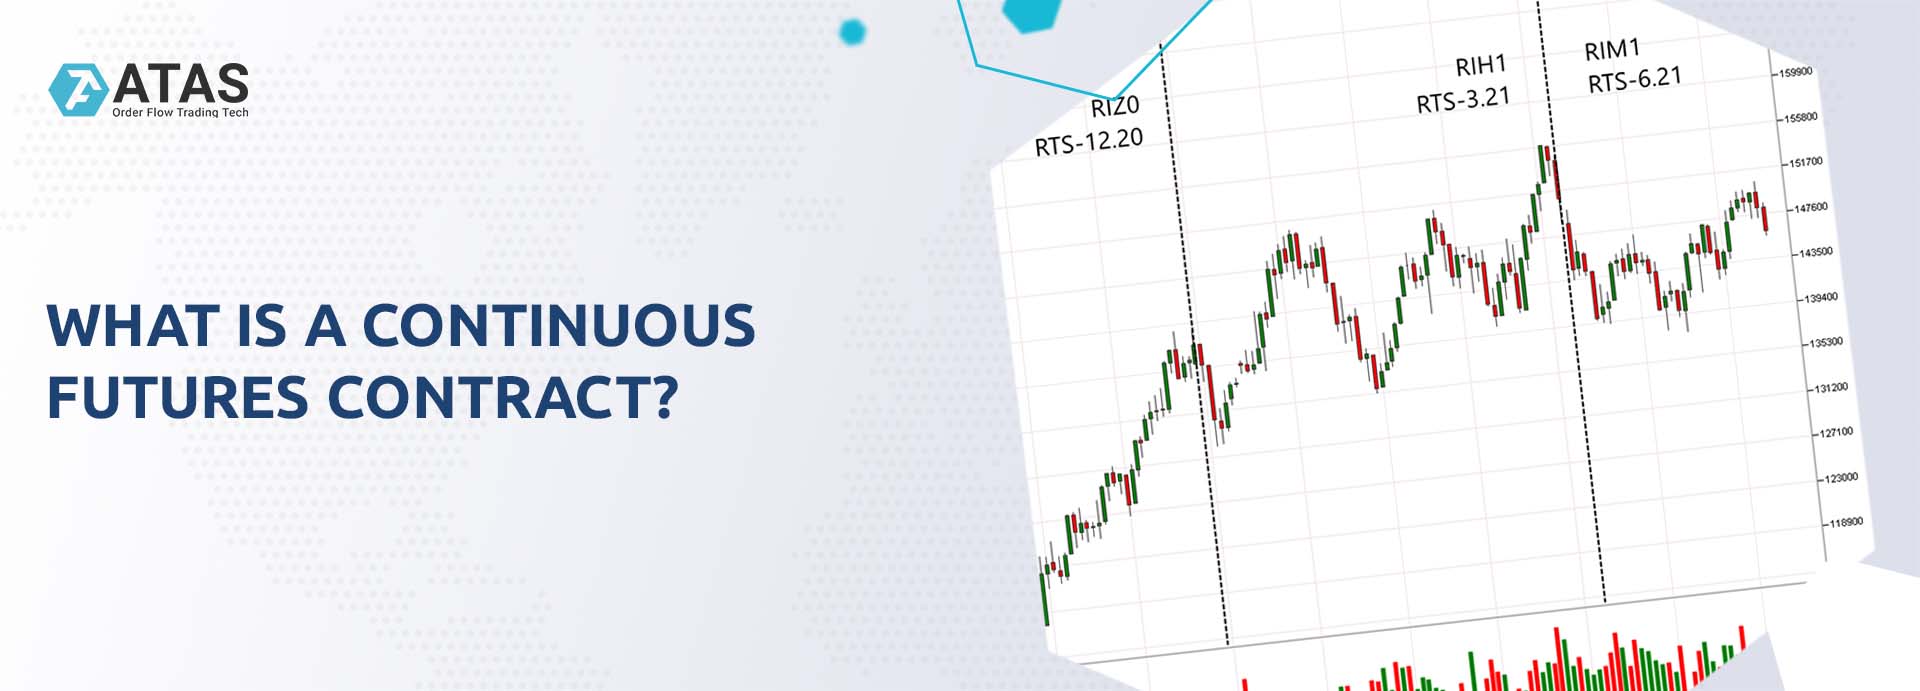
This is how we get the ‘pasted’ continuous futures chart (see the screenshot below).

Thus, a continuous futures contract is a composite instrument. The same underlying asset (in our case – S&P 500 index) is in its basis, but the continuous futures chart is composed of the most liquid periods of individual contracts (in the example below: ESZ0+ESH1+ESM1).
In other words, a continuous futures contract is not an independent financial instrument. In fact, it is not a futures contract. It is more accurate to say that it is a way of displaying several futures trading data in one chart, when several chart parts are ‘pasted’ approximately on expiration days.
As a rule, these parts are ‘pasted’ not exactly on the expiration days but several days earlier. The trading platform compares various contract trading volumes and displays continuous data in the chart on that contract, which was traded with higher volumes. Thus, the chart shows data on the day’s most liquid contract.
It is not unlikely that gaps may appear at the places of ‘pasting’ – it is acceptable due to the fact that two different contracts are combined and they can have different prices. We only want to note that the more popular and liquid an instrument is, the smaller a gap would be.
How to open a continuous futures chart
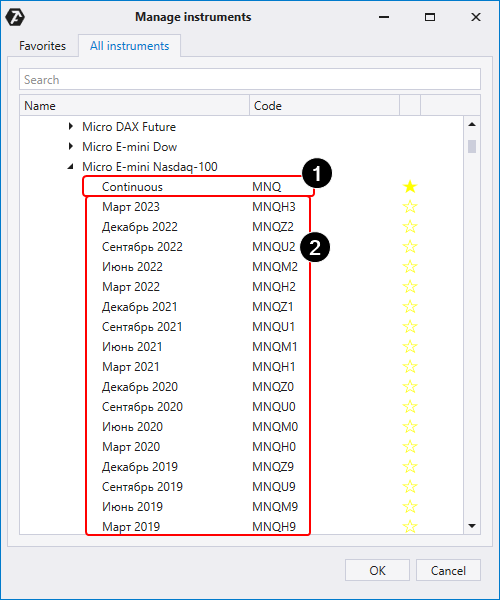
Let’s show it through the example of the Nasdaq stock index futures.Open the instrument manager in the ATAS platform and enter ‘NQ’ in the search field or click: US Futures > Equity index > Micro E-mini futures. You will see:

Continuous futures will be the first one (1). In this case, it has a brief code MNQ. Then goes a list (2) of contracts, which you can trade, sorted out by expiration dates. They have codes, which are accepted on the CME, where these futures are traded. For example, MNQH3 is the code of the futures, which expires in March (letter ‘H’) 2023.
How to trade continuous futures
In fact, you cannot open exactly a continuous futures position, since a continuous futures is not a specific contract.Note that if you select Continuous MNQ in the list of instruments and press OK, a chart will open with a ticker of a specific valid contract, which expiration date is the closest (it is the MNQM1 June 2021 futures at the moment of writing this article), in the upper menu.

Conclusions
The purpose of continuous (‘pasted’) futures is to help traders to analyse charts and monitor global tendencies.If you open the continuous chart, the platform will automatically ‘paste’ data about the most liquid periods of various contracts in one chart. The most liquid contract, which is traded most actively, will be the current one. Usually, its expiration date should occur first.
If you plan to hold your position longer than one day and even a week or longer, make sure you do not open it immediately before the expiration date. In such a case it is more reasonable to open a chart of a specific futures contract, which has a sufficient time buffer before the expiration date, instead of a continuous futures contract.
Independent of a trading style, traders need to be very cautious when expiration approaches, since the market volatility could be higher in those days.
Information in this article cannot be perceived as a call for investing or buying/selling of any asset on the exchange. All situations, discussed in the article, are provided with the purpose of getting acquainted with the functionality and advantages of the ATAS platform.


