The Session Volume Profile (SVP) indicator is a market profile tool designed to display horizontal volumes for a specific trading session.
In simpler terms, it is a market profile built based on a defined time interval — from a selected “begin time” to an “end time.”
Session Volume Profile Indicator: How It Works
A standard market profile displays how trading activity is distributed across price levels.
The Session Volume Profile does the same but within a specified time range. By simply setting the “begin time” and “end time” boundaries, the chart will show volume data only for the selected session.
In simple terms, the Session Volume Profile is a market profile “compressed” to the limits of a single trading session.
The example below — based on Dow Jones index futures — shows two market profiles in the ATAS platform. It provides a clear visual comparison between the standard profile and the Session Volume Profile.
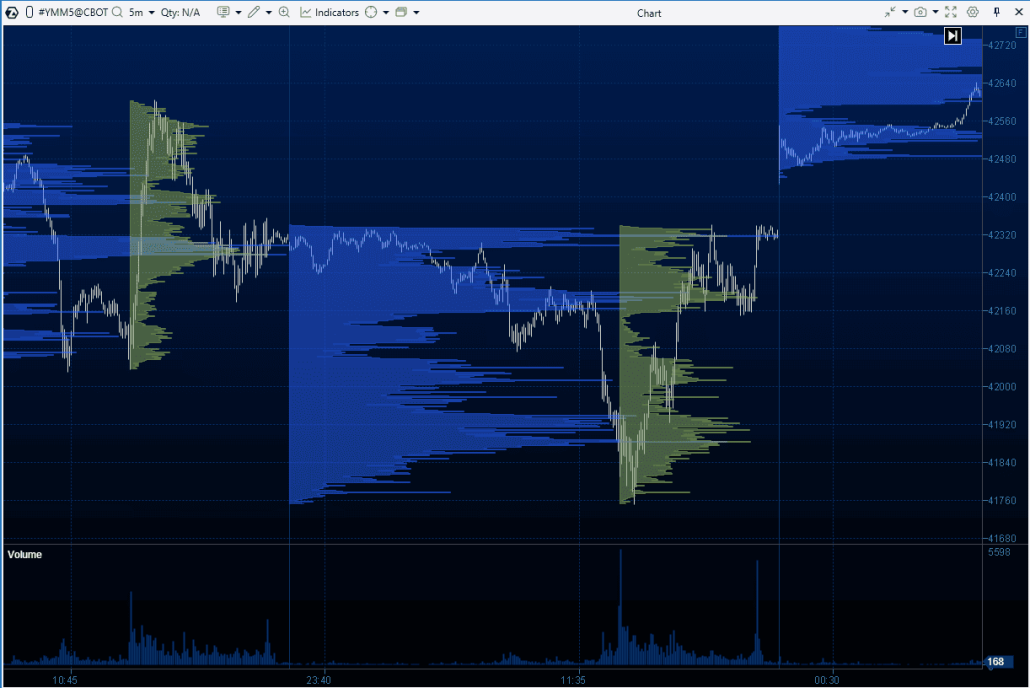
The standard daily Volume Profile is displayed in blue. It captures market activity from midnight to midnight (by default, the ATAS platform uses UTC time).
The green color indicates the Session Volume Profile, which reflects market activity within the time frame from 13:30 to 20:00 (UTC) — the main hours of the U.S. trading session. This period typically sees increased activity not only in the stock market but also in commodity (e.g., gold, oil), currency, and cryptocurrency markets.
Tip. The U.S. trading session is known for increased trading volumes, with typical spikes in activity at the very start and end of the session. To ensure your profile time range is set correctly, check the volume histogram below the chart — volume spikes at the beginning and end of the session will help confirm your settings.
Why Is the Session Volume Profile Indicator Useful?
Conciseness. In the example with Dow Jones futures, the main trading volume occurs during New York’s working hours. As a result, the blue and green profiles are quite similar. By removing data from outside the U.S. trading session, the chart becomes more streamlined, while still retaining valuable insights for volume analysis.
More focus. Data from outside the U.S. session can add “noise” to the chart, making it harder for traders to focus on the most important part — the active trading phase in the U.S. The Session Volume Profile helps to highlight this period, removing unnecessary data and leaving only the essential information for analysis.
Visual clarity. Traders may find it more convenient for the profile to be displayed over the candles during active trading in the selected session, rather than positioned on the side near midnight.
Intraday strategies. Analyzing the volume profile for a specific trading session is useful when applying various trading strategies. For example, in the Smart Money Concept strategy, the term Kill Zones refers to time periods when the price behaves in a certain way. It reflects how the price behaves from the traders’ perspective in different time zones (for example, it is believed that during the European session, traders focus on using liquidity zones created during the Asian session).
Of course, this is just a partial list of situations where the Session Volume Profile indicator can be useful.
How to Set Up the Session Volume Profile Indicator
Step 1. Add the Indicator to the Chart
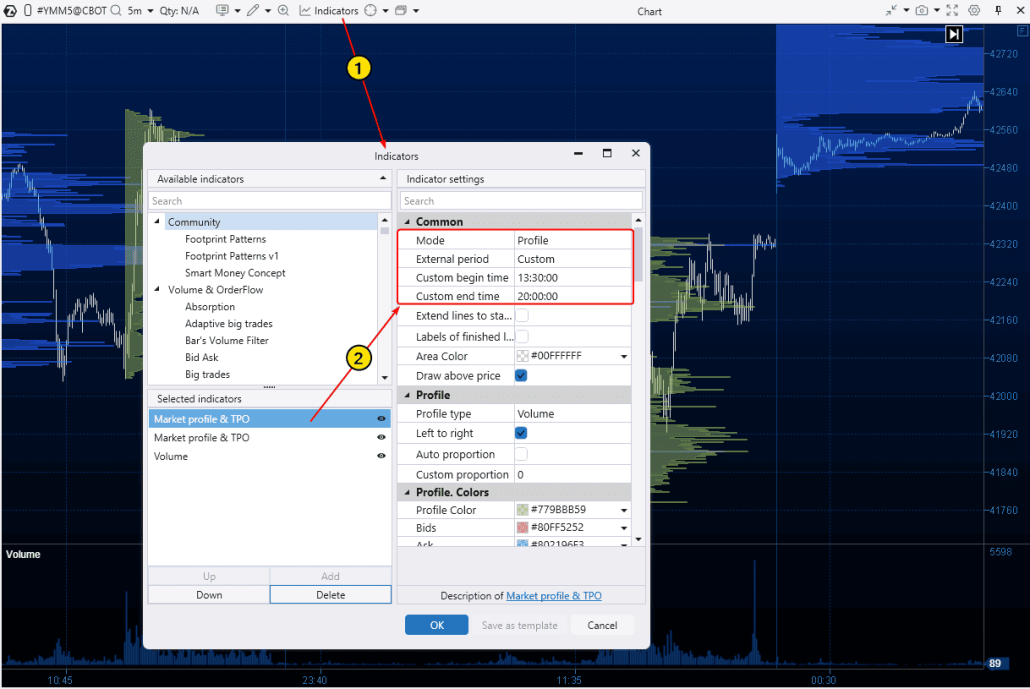
Open the chart of the desired instrument and add the Volume Profile indicator via the Indicator Manager. You can do this using the menu above the chart or by pressing Ctrl+I. In the window that opens, select Volume Profile and click Add.
Step 2. Set the Time Boundaries
In the same Indicator Manager, set the Period parameter to Custom. This will activate fields for setting the time.
Enter the desired values in the Begin Time and End Time fields to specify the start and end times of the session you are interested in.
Step 3. Additional Settings
You can customize the profile display to include delta, add a Point of Control, and adjust colors, transparency, and other parameters for better visualization.
Would you like to learn more about the Volume Profile indicator settings?
Watch the detailed review on our YouTube channel and learn how to effectively use all the features of this indicator for trading!
Alternative Ways to Access the SVP Indicator in the ATAS Platform
These methods involve using drawing objects.
Method 1. Anchored Market Profile
Open the chart and go to the drawing objects menu on the top panel. Select Anchored Market Profile. You will see Begin (1) and End (2) lines appear on the chart, as shown below.
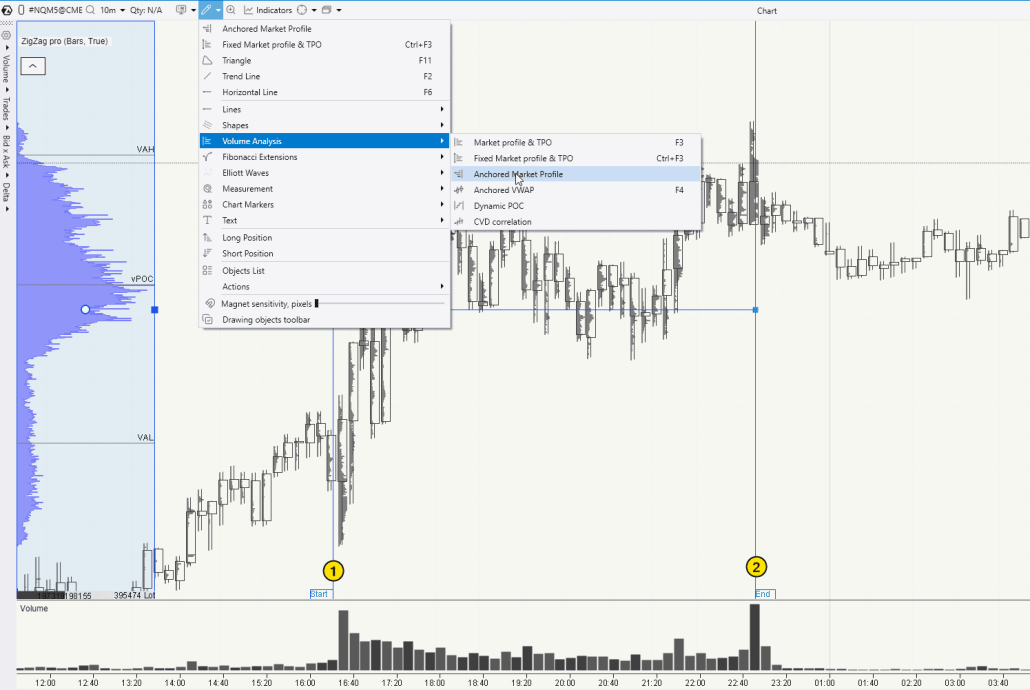
You can freely move these lines to set the start and end of a specific time period, for example, the U.S. trading session. ATAS will automatically build the volume profile for the selected time range.
This is a more flexible method compared to the ones described above and offers additional benefits:
- You can adjust the Begin and End boundaries based on the context. For example, a trader may choose to include a few candles before the official session starts if important news was released during that time.
- The profile (in this example, the blue histogram on the left) can be moved to any location on the chart for better visibility.
However, the Anchored Market Profile requires more manual work — you need to set the boundaries for each session yourself.
Method 2. Market Profile & TPO
Open the chart. From the drawing objects menu on the top panel, select Market Profile & TPO (or simply press F3). Then, use your mouse to highlight the candles that formed during the trading session you are interested in.
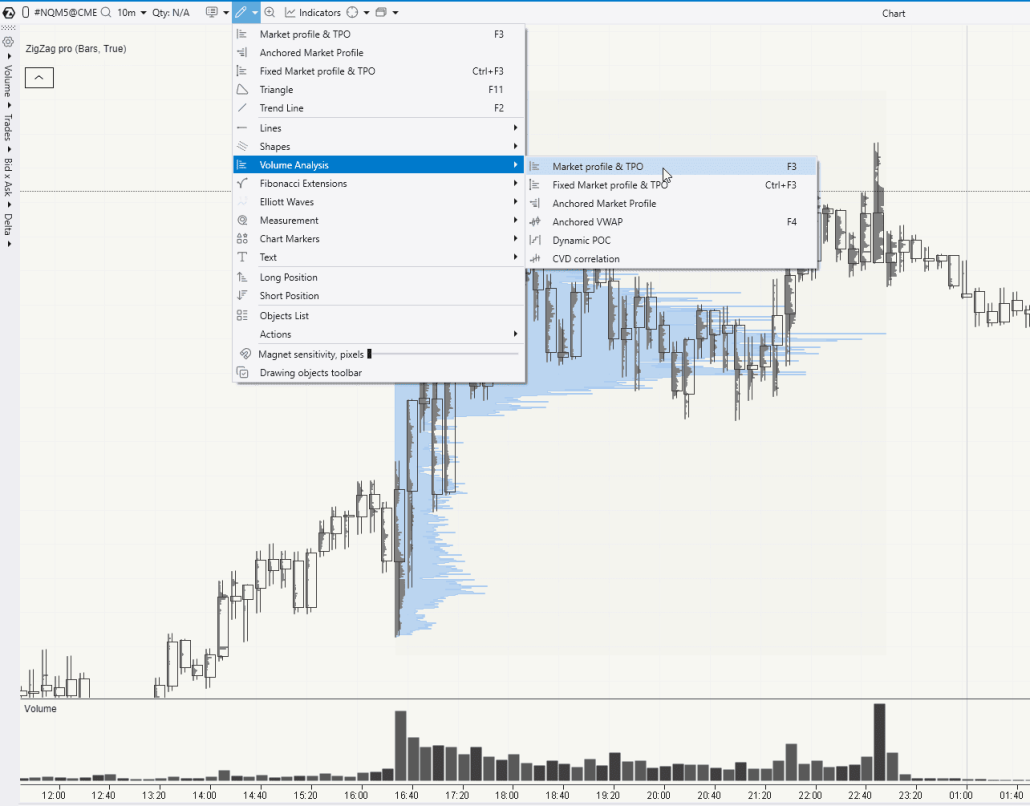
The Market Profile & TPO tool is useful because it allows you to create a profile for any section of the chart. However, like the Anchored Market Profile, it requires manually setting the boundaries, which can be inconvenient for frequent use.
ATAS functionality is constantly updated. Download ATAS for free and explore its powerful volume analysis tools for the markets you are interested in.
Tips for Working with Session Profiles
Tip 1. In some cases, you may need to experiment with the profile’s level of detail. To do this, use the Scale window in the upper-right corner of the chart. This enables you to consolidate multiple levels into one, effectively adjusting the price step on the vertical scale.
Tip 2. In the lower-right corner of the chart, you will find the Trading Hours switch, which can be useful when working with the U.S. trading session.

By default, the Trading Hours switch offers the following time settings:
- ETH – displays the entire day on the chart;
- RTH – displays only the main trading session using the default settings;
- Custom – enables you to adjust the display for the specific time range you need.
Trading with the Session Volume Profile Indicator
Making trading decisions based on volume profile analysis is a subject far too complex for a short help article—it belongs in a comprehensive book. Or even several. Among the authors recognized as classics in the field of horizontal volume analysis are:
✔ Peter Steidlmayer – the founder of the Market Profile concept and theory. His most well-known books include:
- “Steidlmayer on Markets: A New Approach to Trading”
- “Markets and Market Logic”
✔ James Dalton, continued to develop Steidlmayer’s ideas. He is known for focusing on the practical application of Market Profile.
- “Mind Over Markets: Power Trading with Market Generated Information”
- “Markets in Profile: Profiting from the Auction Process”
✔ Frank H. Alper. Another early developer of the Market Profile idea, who combined profile analysis with market psychology. He wrote the book “The Trader’s Window: Decoding the Work of Market Profile.”
In addition to these authoritative sources, we also recommend several relevant and useful articles from the ATAS blog:
- How to Trade Using the Market Profile Indicator
- Trading by Levels with the Market Profile
- How to Start Using Volume Profile
- Test mini-POC Trading Strategy
Example of Session Volume Profile Indicator Analysis
One of the common techniques for using market profile in trading decisions is the analysis of the Point of Control (POC) level and the boundaries of the value area (VAL and VAH).
In the context of the Session Volume Profile indicator, this may look as follows:
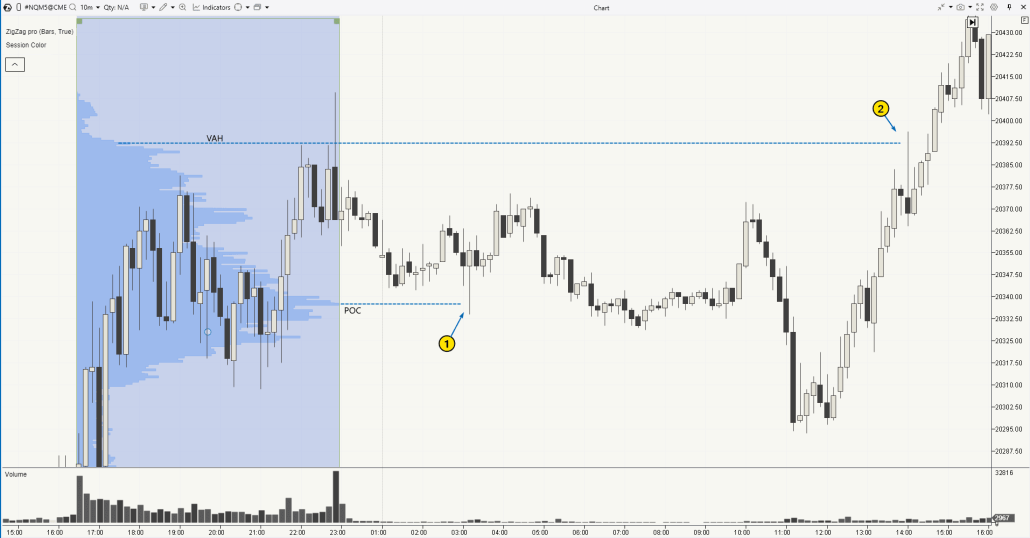
The chart above shows the profile for the U.S. trading session. The POC level from this profile acted as support (1) during the subsequent Asian session, while the upper boundary of the value area (Value Area High) served as resistance for the next day’s European session.
If you combine this with switching to lower time frames to look for confirmation signals and refine entry points + a sound capital management strategy → you will have the essential components of a working trading strategy.
FAQ on Session Volume Profile
Although the instructions above on using the ATAS platform tools to build volume profiles for specific trading sessions may appear comprehensive, beginner traders might still have some unanswered questions.
What are trading sessions?
In trading, sessions refer to periods that correspond to the operating hours of major exchanges. These periods are categorized based on the geographic location of the exchanges and reflect business hours in different time zones. The three primary sessions are Asian, European, and American. Market activity can vary significantly during these periods, often increasing at the points where sessions overlap.
Useful resources on the topic:
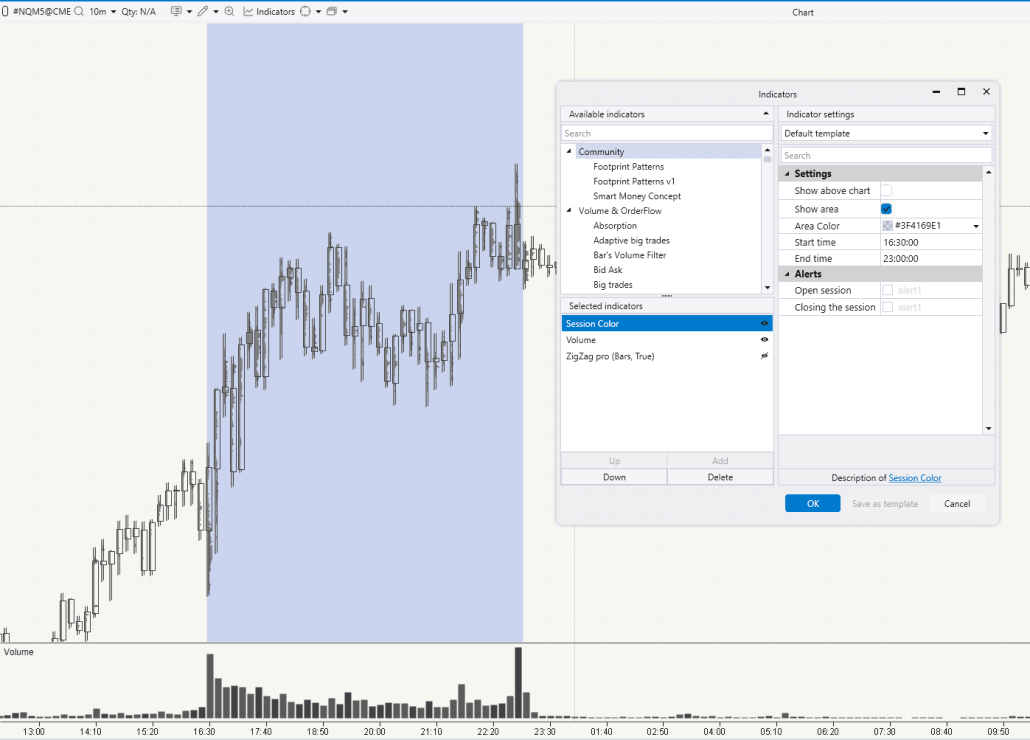
- How to Set Up the ATAS Session Color indicator (example shown in the chart above).
- Article: How to Trade at the Opening of a Trading Session?
How can you find out the time frames of a trading session?
Refer to official sources.
Example. The NYSE website provides the official start and end times of the Core Trading Session.

To further customize the ATAS platform based on your time zone preferences, you may find this article from the ATAS Knowledge Base helpful.
What is a Market Profile?
It is a volume analysis tool used by professional traders. It shows, in the form of a horizontal histogram, how trading activity (such as volume or the imbalance between bids and asks) was distributed across price levels over a specific time period.
The concept is simple: the longer the bar on the histogram, the more trading activity occurred at that price level; the shorter the bar, the less activity took place at that price. This makes the profile visually intuitive and quick to interpret. Most importantly, it is highly useful. To get started with the profile, refer to the list of articles above. Here is another valuable one: How to Start Using the Market Profile in Trading.
How does the Session Volume Profile indicator work?
SVP is a market profile histogram that reflects information about trading activity at different price levels over the time period during which a trading session was open. For example, if the trading session starts at 9:30 and ends at 15:50, the SVP indicator will only consider the trades executed between 9:30 and 15:50 for building the histogram.
What indicator is best for volume profile analysis?
The ATAS platform provides a comprehensive set of indicators for working with volume profiles. We recommend mastering all of them and using the one that best fits your specific task.
How to choose the best one? First, different indicators are better suited for different tasks. Second, a volume profile is simply statistical data that summarizes trading activity over a given period, organized by price levels. You can apply various filters and settings to tailor the profile to your needs.
Given that the volume profile indicators in ATAS offer the most extensive range of settings, they can be considered the best in their class for volume profile analysis.
Learn more about ATAS indicators:
Conclusion
The SVP market profile indicator is a version of the market profile that displays a histogram with data only for the trades executed within a specific period — from the start of the trading session to its end.
This time filter can be particularly useful in various scenarios. For example, a trader might want to display two market profiles on a Euro-to-Dollar futures chart: one for the European session and another for the American session. This enhances flexibility and provides more options for analyzing market activity and applying different strategies.
With the tools provided by ATAS, you can easily implement tasks related to building market profiles for the desired trading session.
Do not miss the next article on our blog. Subscribe to our YouTube channel, follow us on Facebook, Instagram, Telegram or X, where we publish the latest ATAS news. Share life hacks and seek advice from other traders in the Telegram group @ATAS_Discussions or on Discord.
Information in this article cannot be perceived as a call for investing or buying/selling of any asset on the exchange. All situations, discussed in the article, are provided with the purpose of getting acquainted with the functionality and advantages of the ATAS platform.