ATAS + dxFeed
A New Level of Futures Analysis with Heatmap History in DOM Levels
Through ATAS’s partnership with dxFeed, a leading market data provider, users can now access an exciting new feature: analyzing classic futures history using the Heatmap in the DOM Levels indicator.
While this analysis was previously limited to cryptocurrency instruments, traders can now examine how liquidity evolves in the order book over time for instruments like E-mini S&P 500 (ES) futures and other assets from major exchanges.
Why Market Depth Matters for Traders
Market depth is essential for understanding where liquidity lies hidden and what truly occurs within each candle.
It reveals not only price movements but also the driving forces behind them—showing where large limit orders are placed, which price levels traders defend, and which ones they break through.
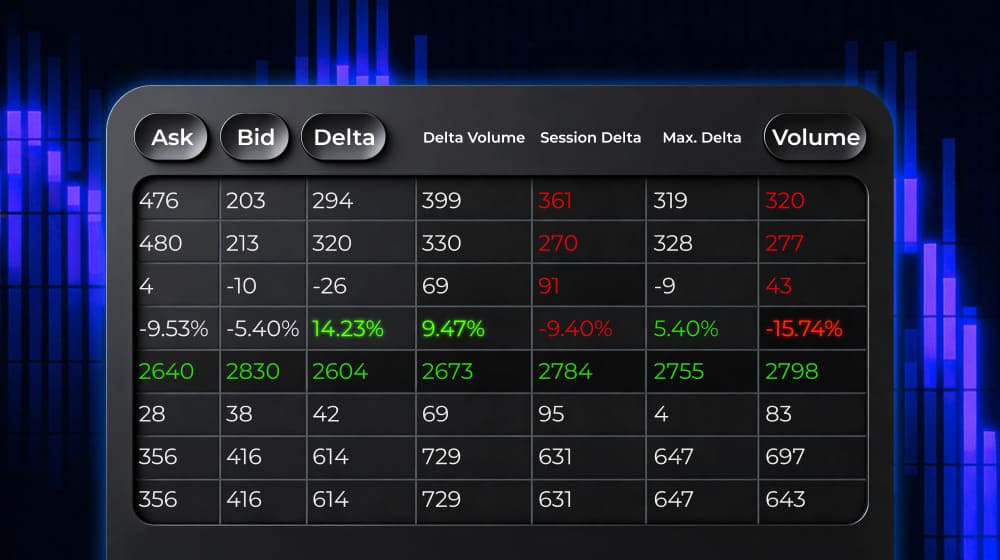
DOM (Depth of Market) tools display real-time data on limit orders to buy (Bid) and sell (Ask) submitted to the exchange. They show where liquidity concentrates, indicating how many market participants are ready to trade at specific prices. This is known as Level II data in professional circles.
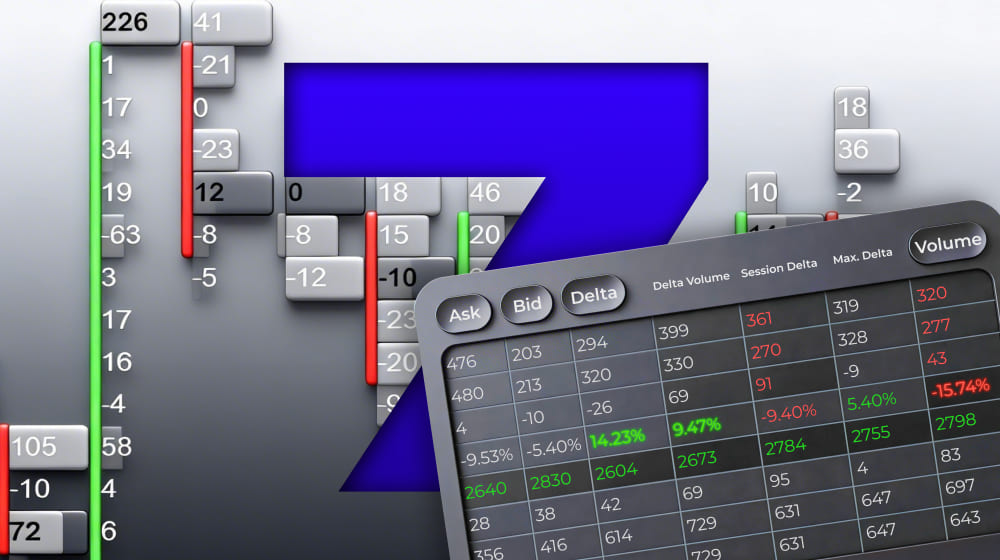
ATAS tools for market depth analysis:
What the Heatmap Shows
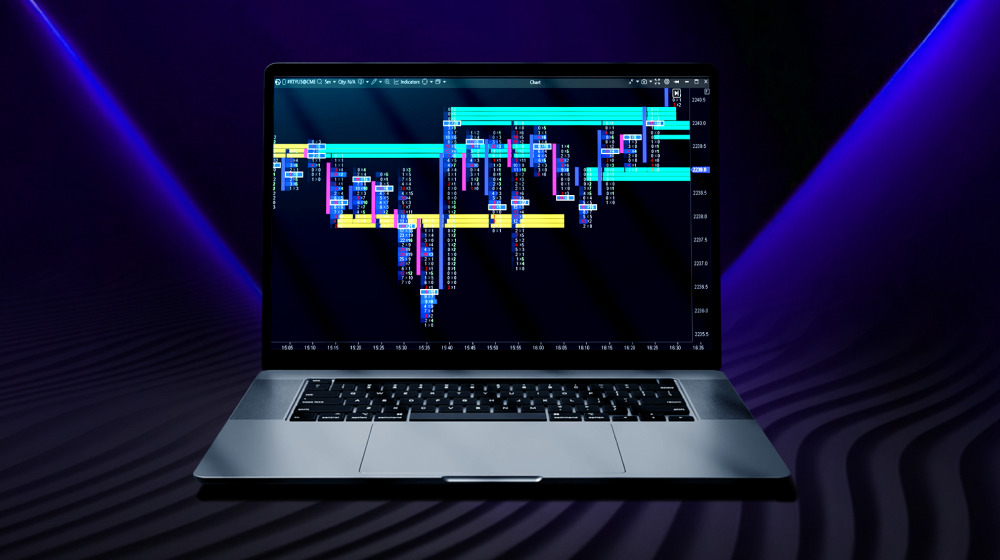
The DOM Levels indicator shows Level II data right on your chart. With its built-in Heatmap, you can visually analyze liquidity patterns. The colors indicate order volume at each price level—brighter colors mean more orders.
📌 With the heatmap, you can:
- Find patterns of price interaction with large-volume limit order levels
- Identify support levels (1 and 2) and resistance levels (3 and 4)
- Analyze market maker order placement
- Improve your trading strategy
Most importantly — thanks to dxFeed, this historical data is now available not only for cryptocurrencies but also for key traditional market instruments.
What is dxFeed
dxFeed is a leading global market data provider headquartered in Germany.
- Delivers high-precision exchange data for 2.5 million instruments: stocks, futures, options, indices, currencies, and cryptocurrencies from major US, European, and global exchanges.
- Services over 6 million end users with more than 200,000 concurrent connections.
- Operates 6 data centers worldwide for fast, reliable data transmission.
- Winner of “Most Innovative Market Data Project” at WatersTechnology Awards 2022.
Quality trusted by brokers, funds, exchanges, and private traders worldwide — now available in ATAS.
How to Connect dxFeed to ATAS
✓ Download and install the ATAS software
✓ Get a dxFeed subscription if you don’t have one
✓ Connect dxFeed to ATAS
Subscription Process
To test the new analysis features, consider starting with the CME Market Depth subscription, which includes major futures like E-mini S&P 500 (ES).
Choose your status as either Professional or Non-Professional.
- Non-Professional — applies if you trade your own funds, don’t work for a brokerage company, and don’t provide financial services to others.
- Professional — applies to those working in the financial industry.
⚠️ Most private traders qualify as Non-Professional, which offers market data at a lower price.
Once you complete your subscription, you’ll receive login credentials via email for connecting dxFeed to ATAS.
Connect dxFeed to ATAS
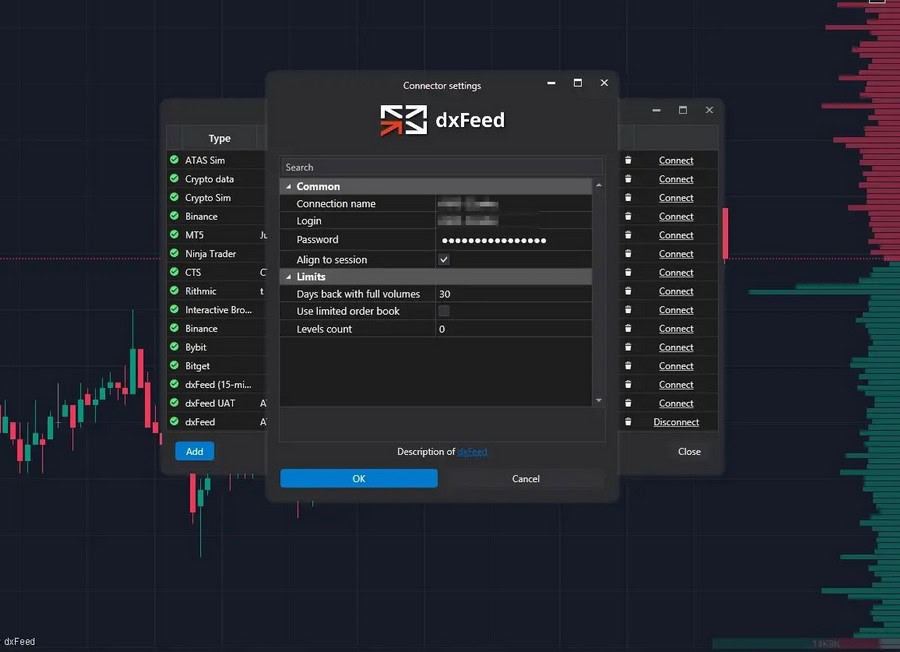
Open ATAS, click Connections and create a new dxFeed connection using the login and password from your email.
🔍 Detailed step-by-step guide “How to connect dxFeed to ATAS” is available in the ATAS Knowledge Base
Done! Now you can use DOM Levels history.
To begin:
- Open a futures chart from the US and EU futures section, such as NQ, GC, or FDAX.
- Add the DOM Levels indicator through the indicator manager.
- The heatmap history will load automatically within seconds.
You can customize the visualization by adjusting the color scheme, contrast, volume filter, and other settings.
Start now!
Try ATAS free with no time limit
Possible Issues and Solutions
If DOM Levels history isn’t loading, check these two items:
1. Connector Type
Ensure you’re connected to dxFeed, not dxFeed (15-min delayed).
⚠️ Historical DOM Levels data isn’t available through the delayed connector.
Check the Connections window to verify that the main dxFeed is active.
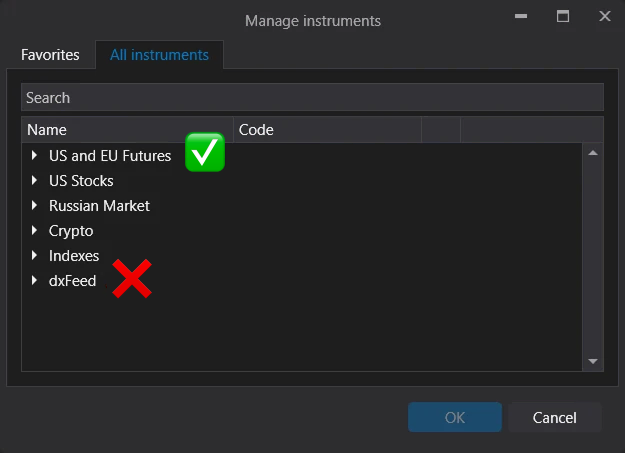
2. Which instrument chart is open
Use instruments from the US and EU Futures: ES, NQ, GC, FDAX, and other classic futures section. These instruments support heatmap history.
⚠️ Note that while dxFeed instruments appear in their own folder in the instrument manager, they do not support DOM Levels history loading due to technical limitations.
If you need help resolving any issues, contact ATAS support via Telegram or email support@atas.net.
How to Analyze DOM Levels Heatmap
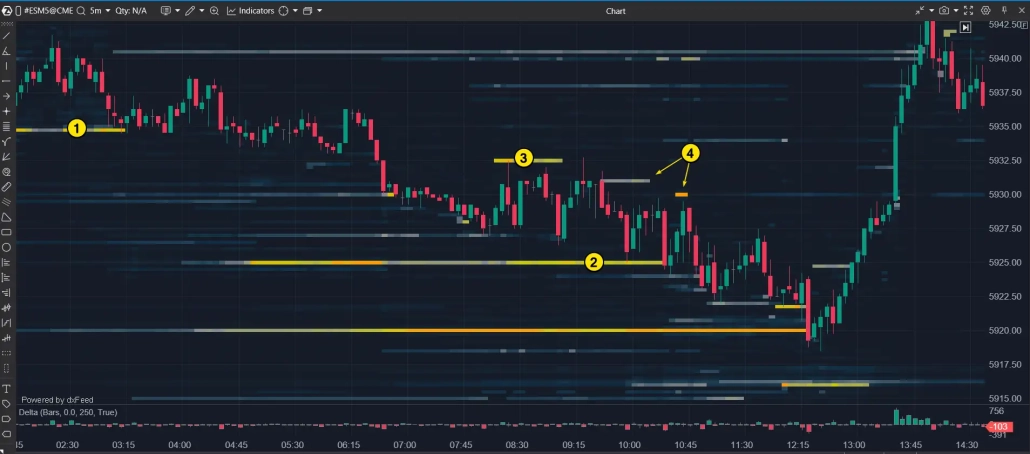
Let’s examine an example using ES futures on a 5-minute chart during the European session.
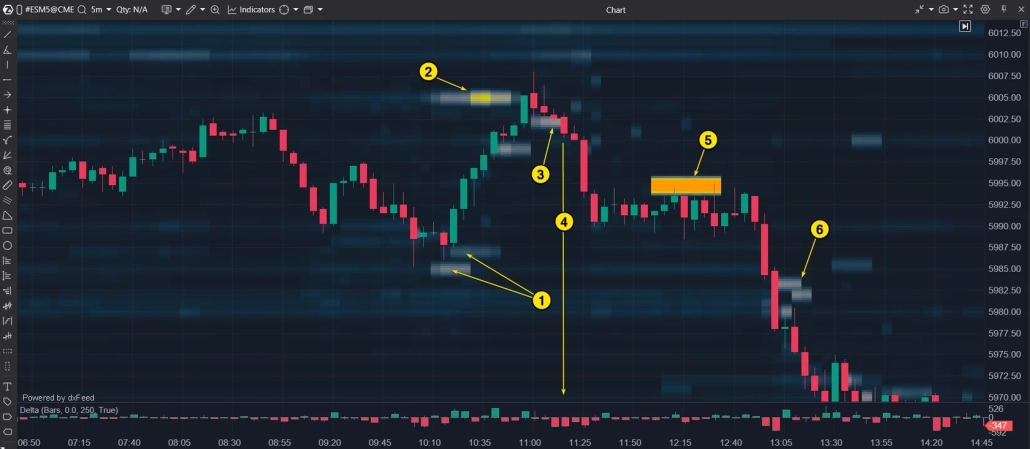
The DOM Levels indicator with Heatmap function helps traders understand price movements more clearly.
What can be seen on the chart:
- A significant volume of limit buy orders below the current price drove up demand, causing the price to rise.
- Heavy sell orders halted the upward movement.
- Strong buy orders created temporary support, holding the price steady.
- Selling pressure, confirmed by negative values of the Delta indicator, broke through the support level, pushing the price down permanently.
- Substantial sell orders blocked any potential price recovery.
- Continued sell orders sustained the downward trend.
Why This Is Important
📌The DOM Levels heatmap reveals both current orders and historical order book patterns, showing:
- Major participant positions
- Price support zones
- Resistance levels and growth barriers
With DOM Levels history now available for ES, NQ, GC, FDAX, and other classic futures, you can analyze these patterns retrospectively.
Conclusion
ATAS’s partnership with dxFeed now provides DOM Levels heatmap history for US and European futures. This key update extends beyond cryptocurrency instruments to include classic futures like ES, NQ, GC, FDAX and others.
The DOM Levels heatmap history reveals the relationship between price and order book liquidity. The visualization clarifies support and resistance formation, major participant activity, and volume-driven market behavior.
DOM Levels + dxFeed = a qualitatively new level of market analysis
Start exploring this new analytical dimension:
– connect the dxFeed data,
– choose a futures contract from the supported list,
– examine liquidity directly on the chart.
This enhancement delivers deeper, more intuitive volume analysis. And it’s only the beginning – the ATAS team continues developing cutting-edge volume analysis tools!
Information in this article cannot be perceived as a call for investing or buying/selling of any asset on the exchange. All situations, discussed in the article, are provided with the purpose of getting acquainted with the functionality and advantages of the ATAS platform.
Subscribe
Get the latest ATAS news delivered conveniently