
Perhaps, candlestick patterns worked well in the 18th century. However, their use in the pure classic form nowadays creates a wish to increase efficiency of their forecasts.
In this article:
- a review of popular classic patterns of the Japanese candlesticks;
- advantages and disadvantages of using the Japanese candlesticks;
- how to increase efficiency of the candlestick pattern signal, using the modern methods and progressive software.
Popularization of candlestick patterns
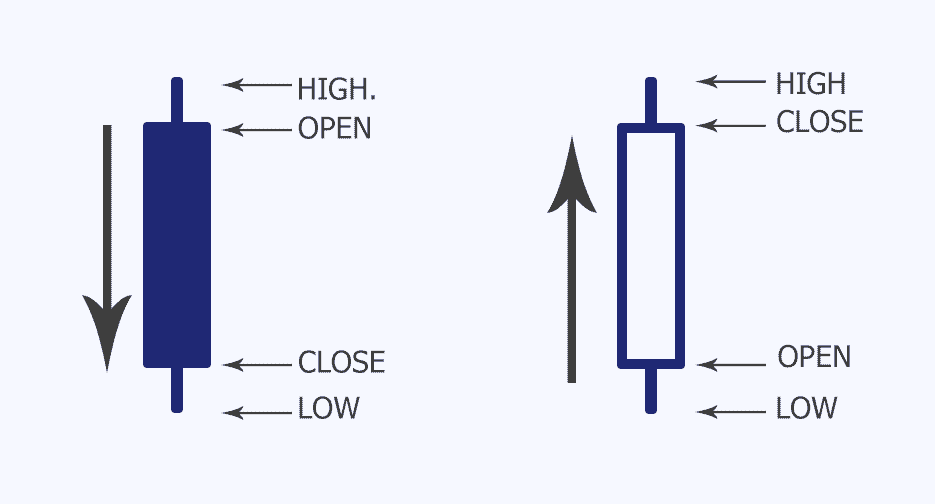
Japanese candlesticks could be bearish and bullish. Picture 1 shows examples of the bearish and bullish candlesticks.
The authors specify more than 50 sub-types of candles and candlestick patterns. They also divide all candlestick patterns into two types:
- reversal patterns;
- continuation patterns.
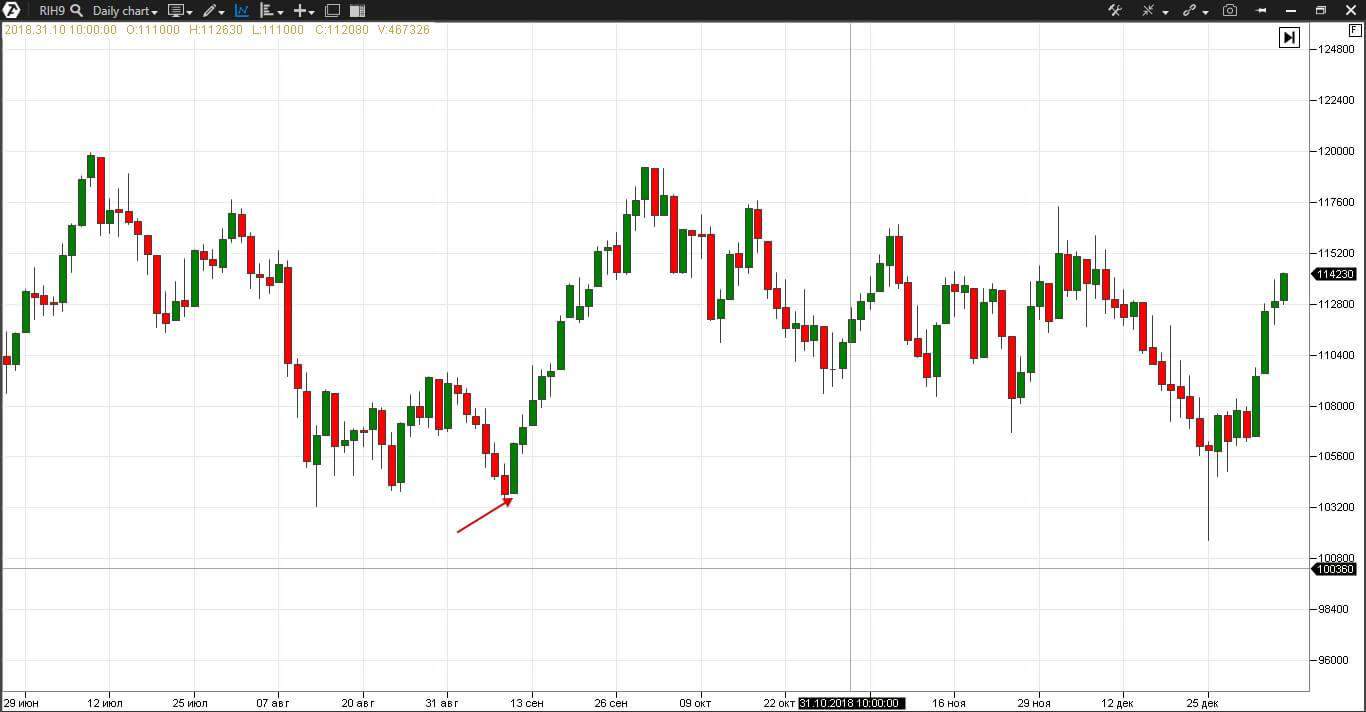
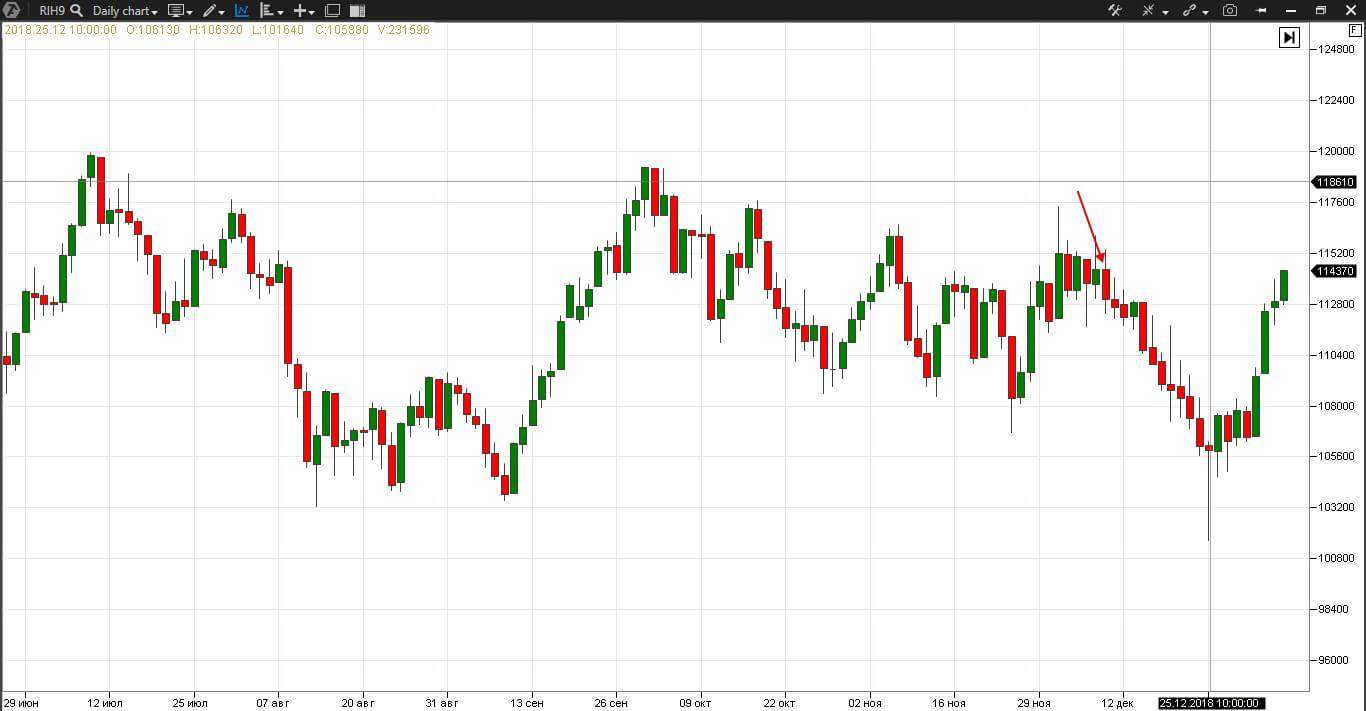
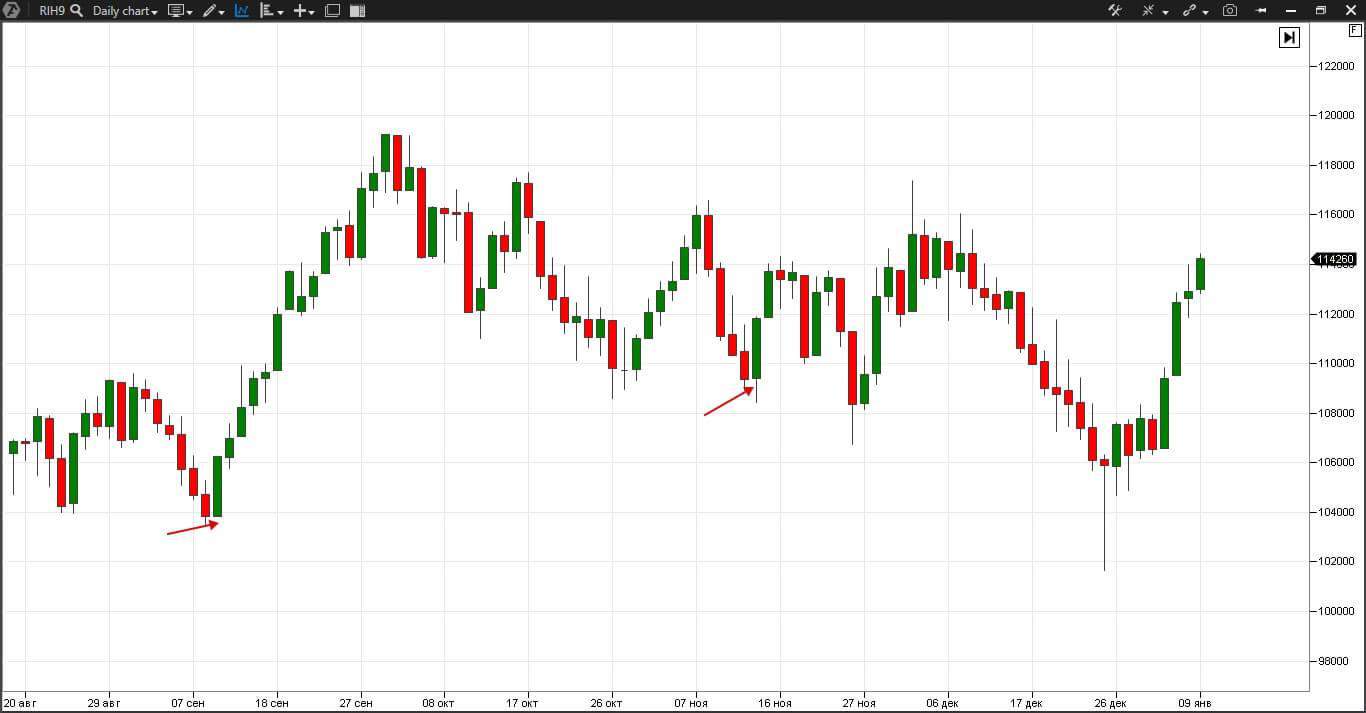
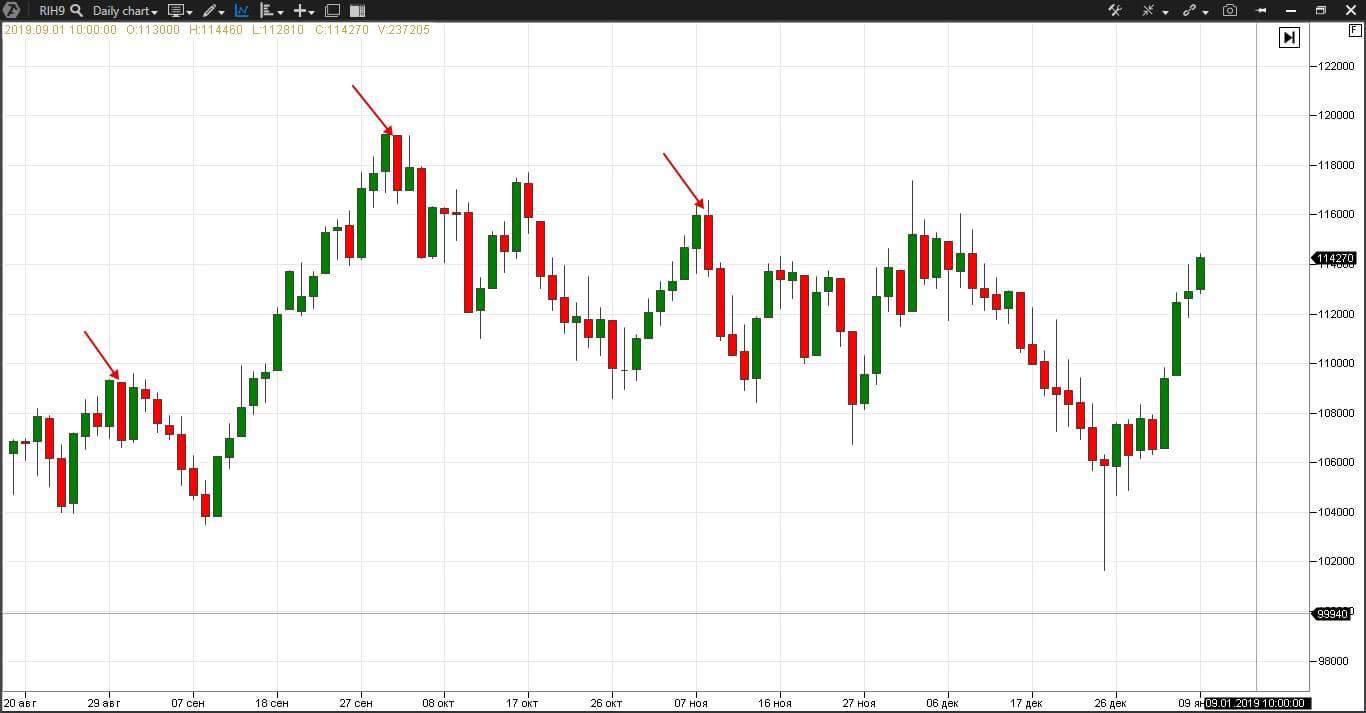
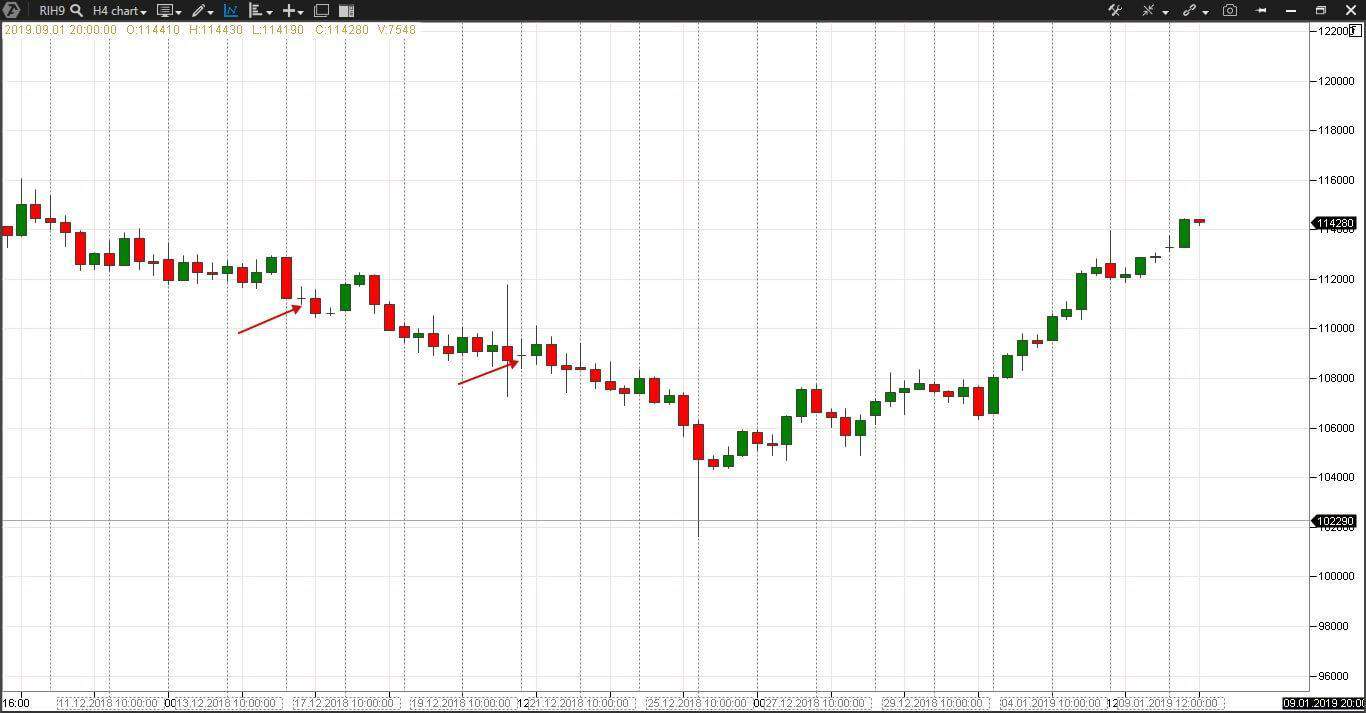
We will consider only the most popular ones, which are considered to be reliable. For our study, we will consider examples in a day and four-hour charts of the RTS index futures (RIH9).
Reliable and frequent reversal patterns
3 outside up, three outside days upward – a bullish reversal pattern with 74% reliability. Look for three candles. The first one is black at the bottom of a bearish trend. The second candle is white and closes the body of the first one. The third candle is also white and closes higher than the second one.
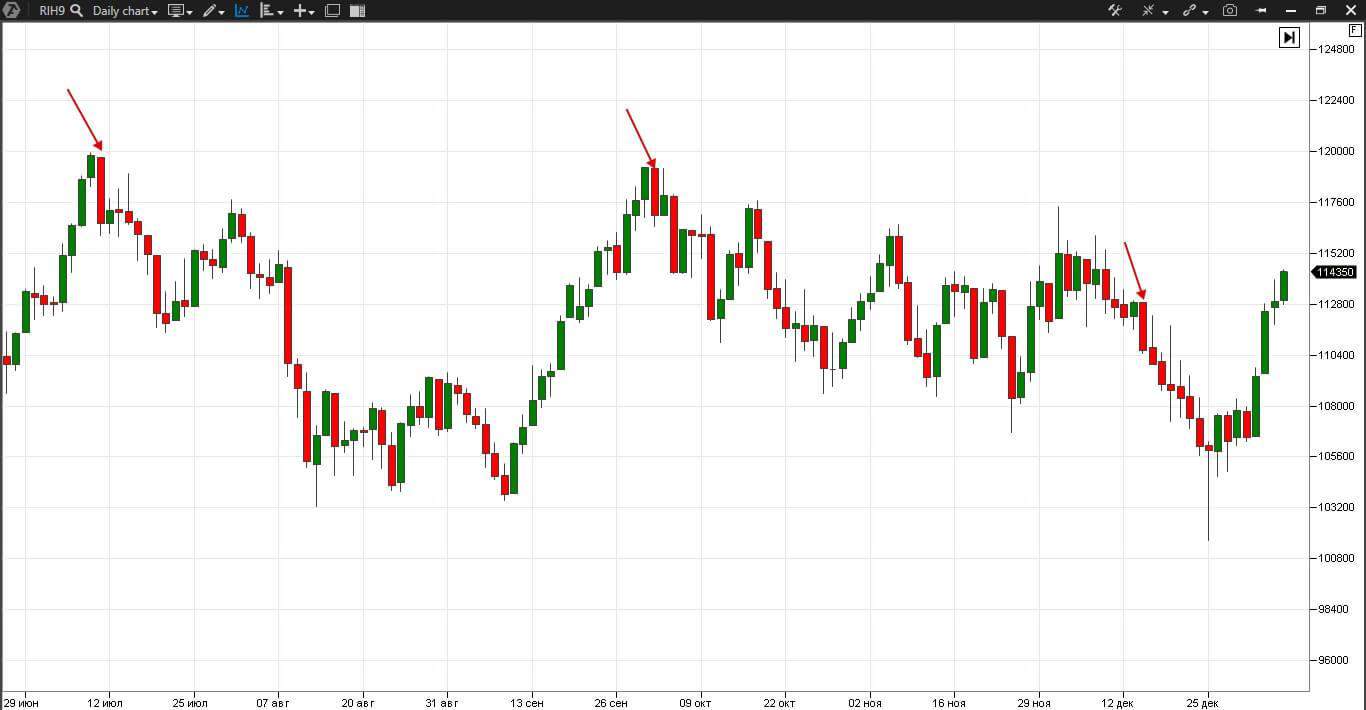
3 outside down, three outside days downward – is a bearish reversal pattern with 69% reliability. Look for three candles. The first one is white on top of a bullish trend. The second one is black and it closes the body of the first one. The third candle is also black and closes lower than the previous one.
3 white soldiers – is a bullish reversal pattern with 83% reliability. Three tall white candles close each other and are closed at the very high.
Takuri line or hammer – is a bullish reversal pattern with 64% reliability. Look for a candle with a short body and very long lower shadow, more than three times longer than the body, at the bottom of a bearish trend.
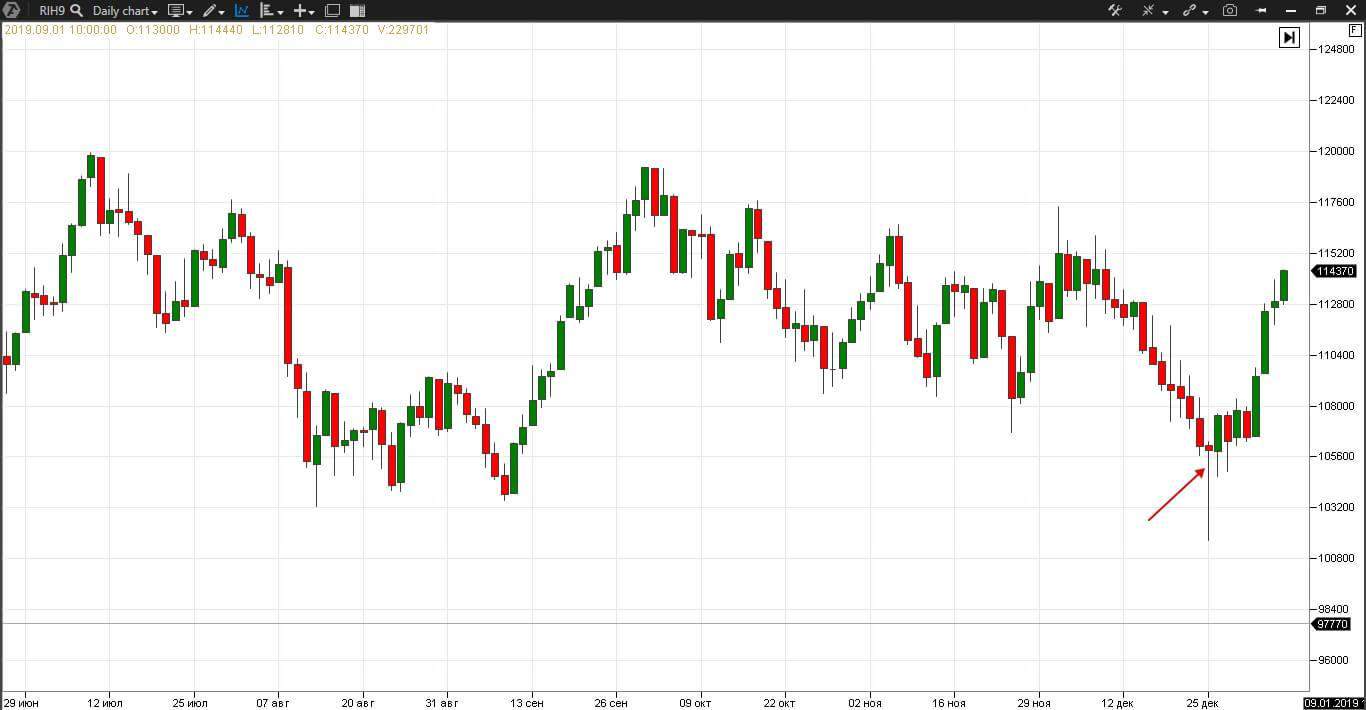
Belt hold bullish – is a bullish reversal pattern with 71% reliability. Look for one white candle without a lower shadow with the closing nearly on the high at the bottom of a bearish trend.
Belt hold bearish – is a bearish reversal pattern with 68% reliability. Look for one black candle without the upper shadow with the closing nearly on the low at the top of a bullish trend.
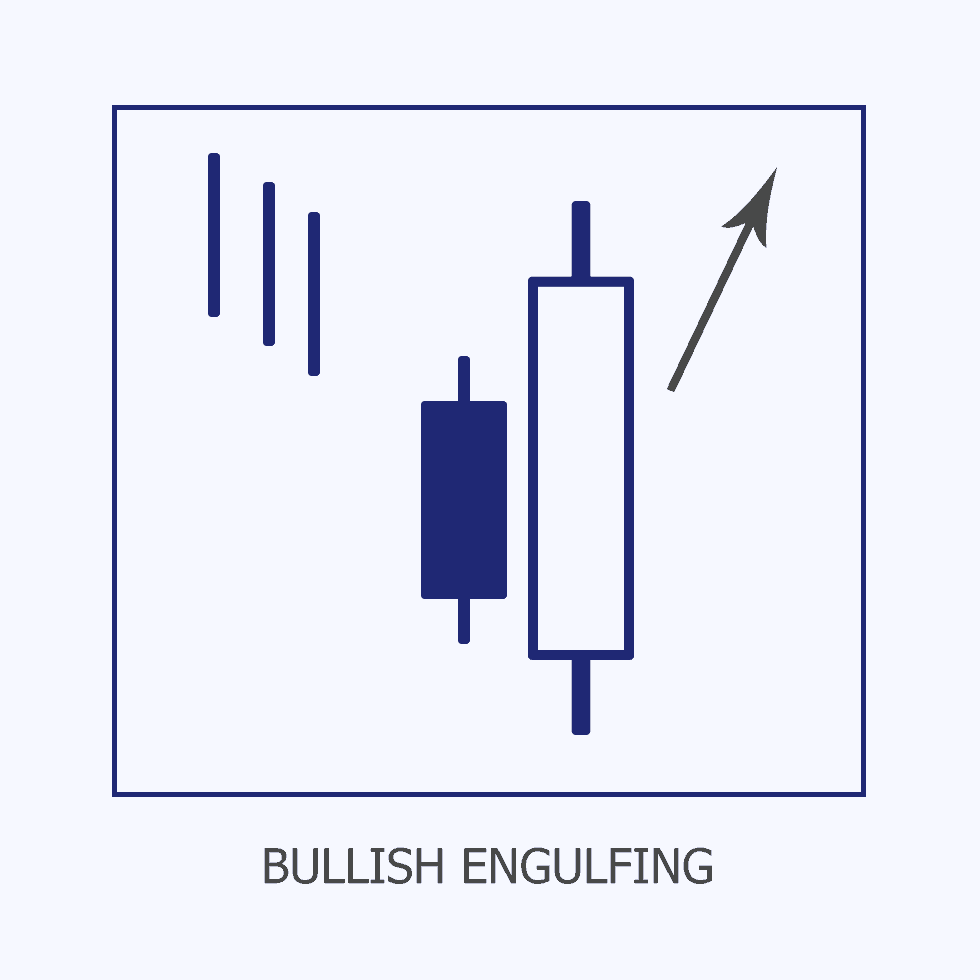
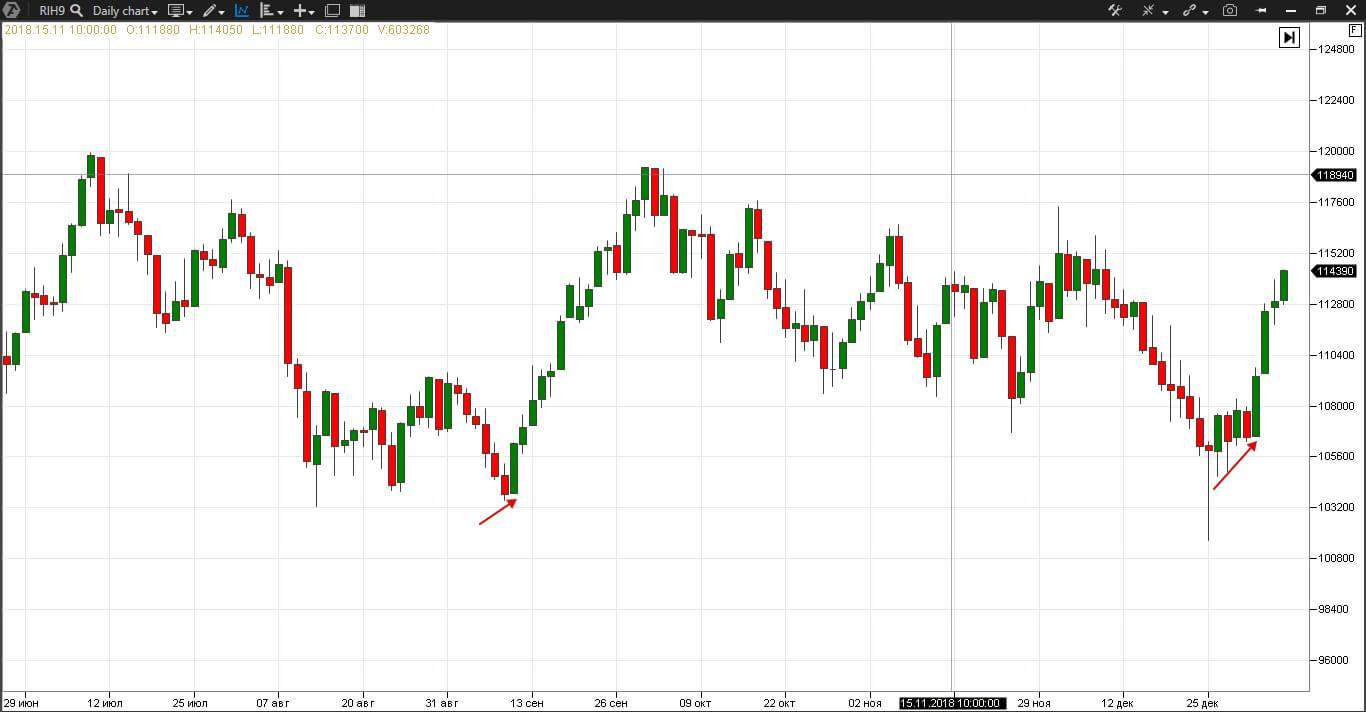
Engulfing bullish – is a bullish reversal pattern with 62% reliability. Look for a pair of candles. The first one is black at the bottom of a bearish trend. The second candle is long white, which completely closes the body of the first one in an ideal pattern.
Pictures show not ideal engulfing patterns.
Engulfing bearish – is a bearish reversal pattern with 79% reliability. Once again, look for a pair of candles. The first one is white on top of a bullish trend. The second candle is long black, which closes the body of the first one in an ideal pattern.
Reliable and frequent continuation patterns
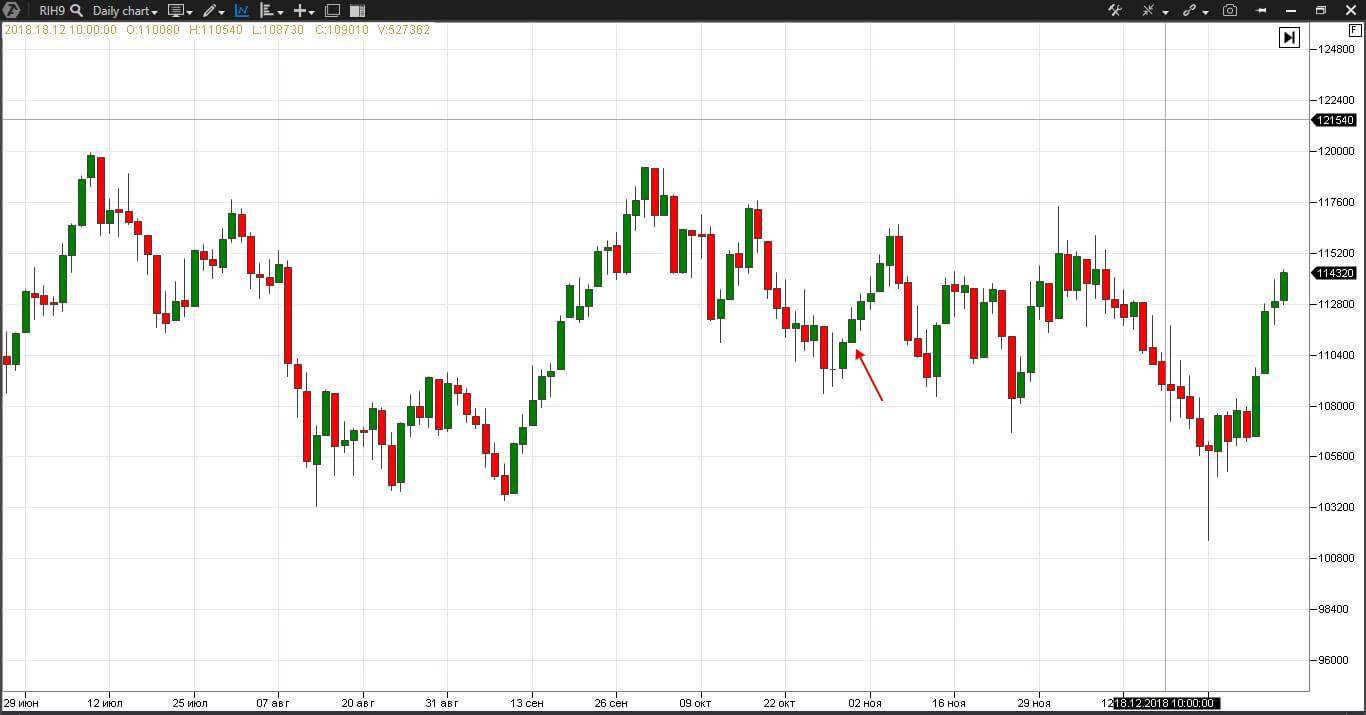
Last engulfing bottom – is a bearish trend continuation pattern with 66% reliability. Two multi-colored candles during the price decrease. The first one is white and the second one is black and closes the body of the first one, while the shadows can be ignored.
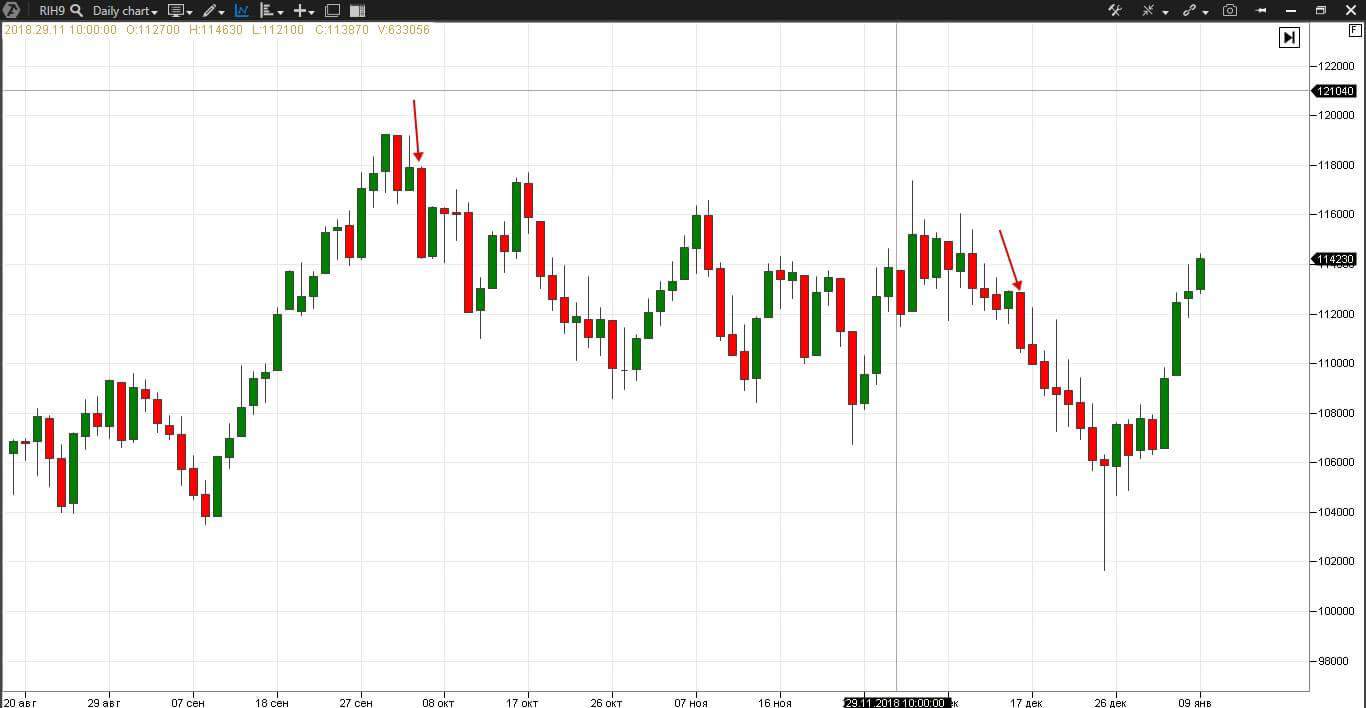
Last engulfing top – is a continuation of a bullish trend with 67% reliability. Two multi-colored candles during the price increase. The first one is black and the second one is white and closes the body of the first one, while the shadows can be ignored.
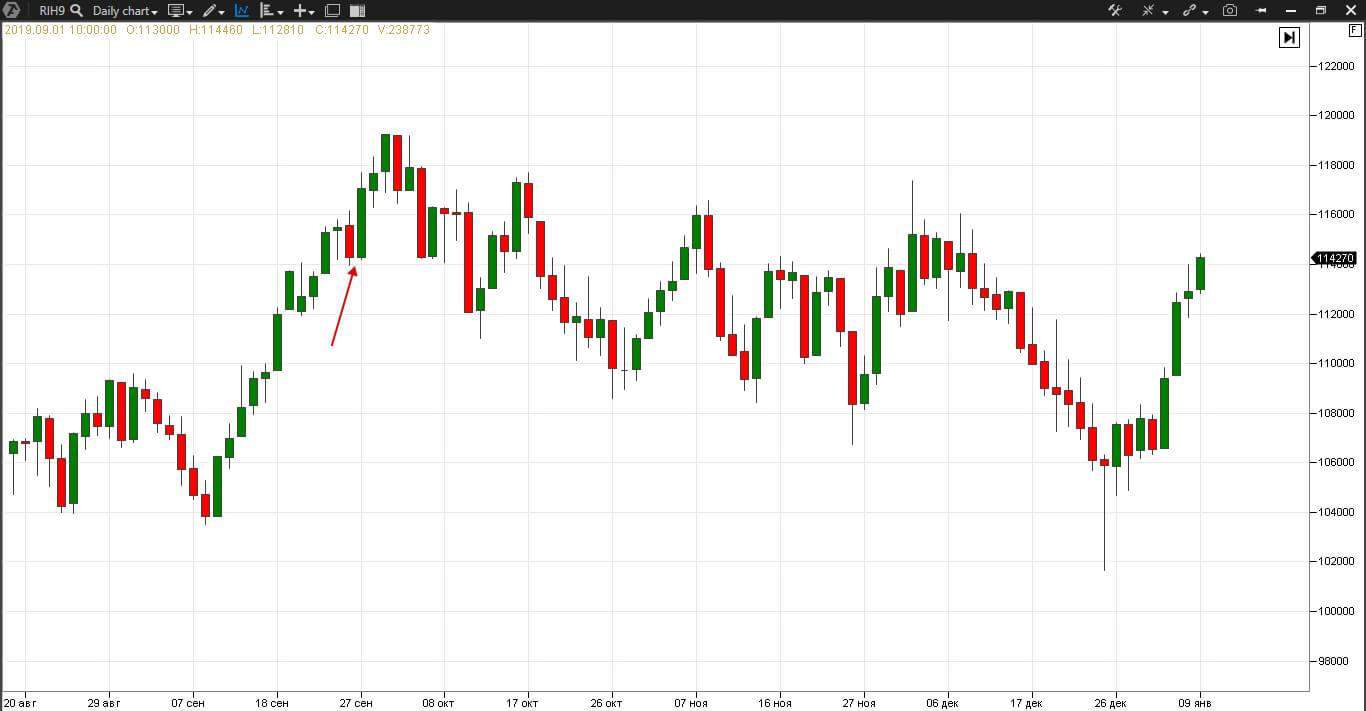
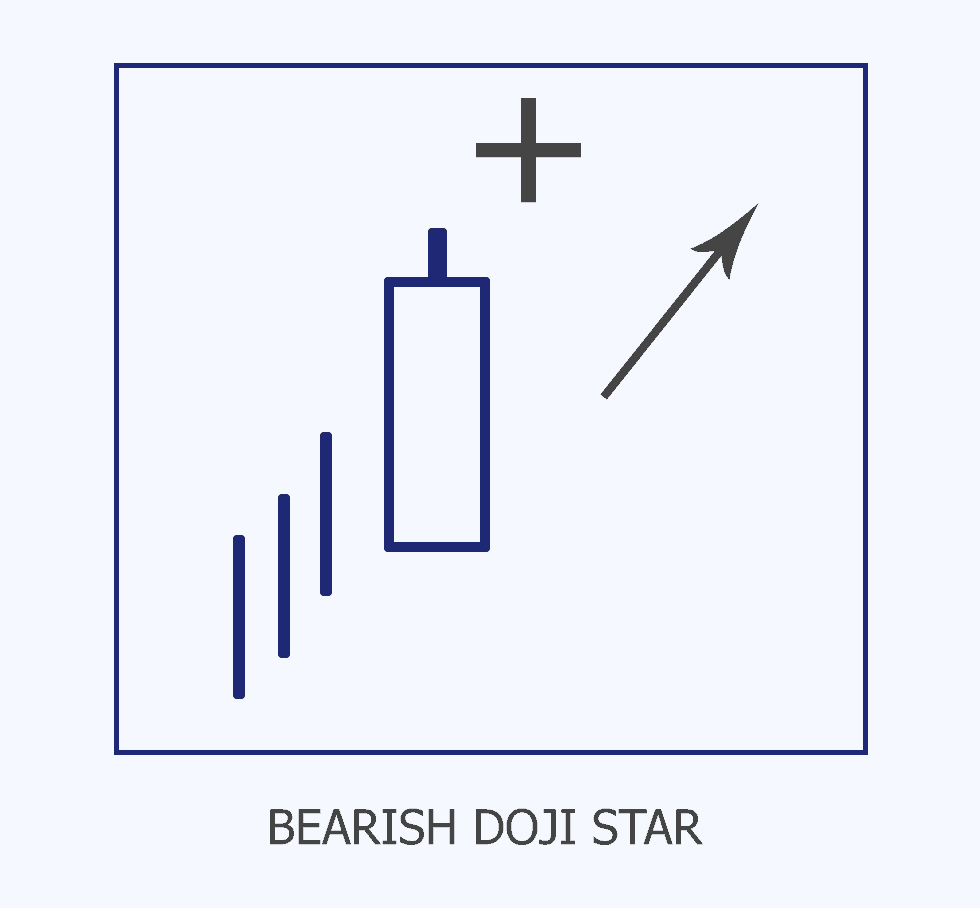
Doji are candles, the opening and closing prices of which coincide. There are many different Doji sub-types: with long one-sided of two-sided shadows and the candle body on high or low. Doji emergence means uncertainty and absence of the market price direction. If Doji emerges after a long white candle and is higher than its body, then Bulkowski thinks that the bullish trend with continue with 68% probability. It is interesting that this pair is often considered as a reversal pattern, that is why it is called a bearish star.
Doji star bullish – is a bearish trend continuation pattern. As well as in the previous example, if Doji emerges below a long black candle during a bearish trend, according to Bulkowski there is 68% probability of continuation of the price decrease. Some sources also consider this pattern to be a reversal one.
Japanese candlesticks and volume analysis
Modern achievements in the field of technical analysis and computing equipment allow finding confirmation for the candlestick patterns, which age is calculated in centuries. It increases efficiency of the classical candlestick patterns. Download the test version of ATAS. Combine the Japanese candlestick patterns with advanced instruments of the technical and volume analysis. Example. Below we see a 5-minute chart of a RTS index futures (RIH9) with the Dynamic Levels Indicator and horizontal profile of the market for the current day.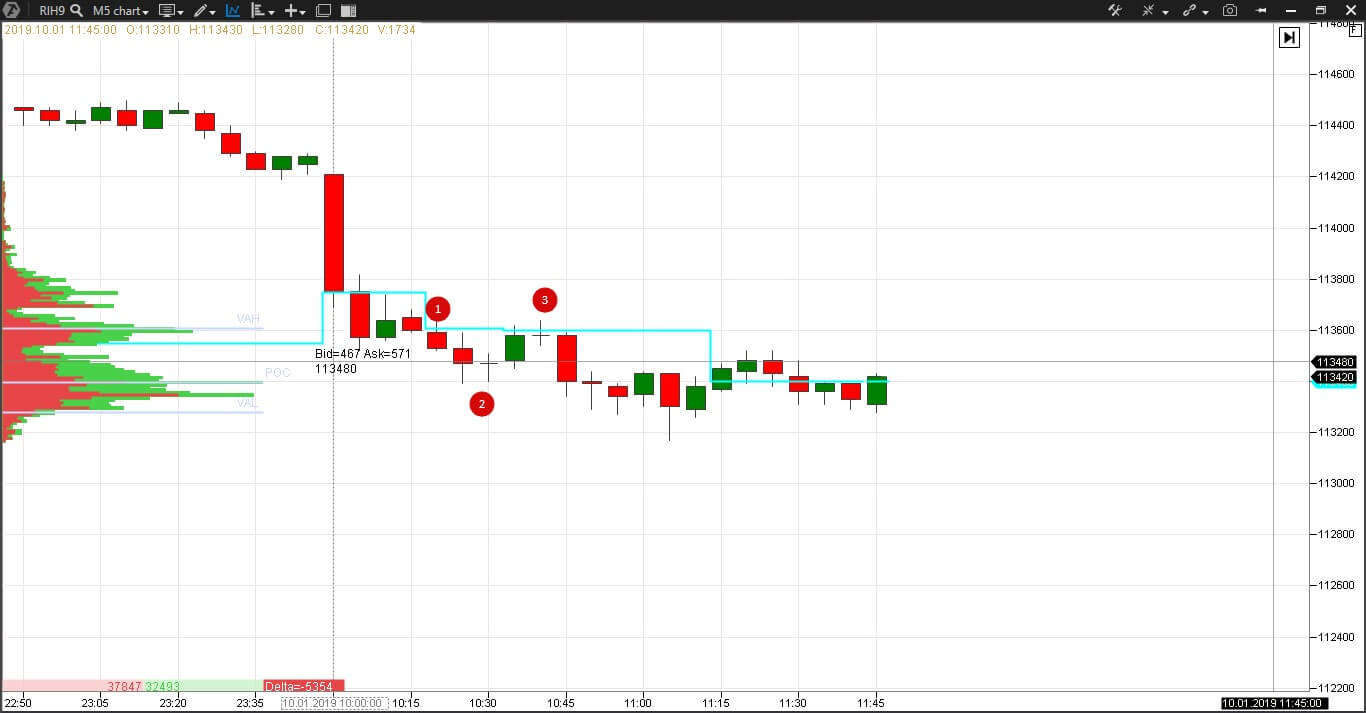
3 – Doji emerges again after the green candle at the maximum volume level. In this case, the maximum volume level became the resistance level. The buyers failed to push the price upward. The next red candle confirms the victory of the sellers.
Now, let us consider the same situation using clusters. The Bid/Ask Imbalance cluster type with 300% overweight and Cluster statistic, Dynamic Levels indicators. We still see candles to the left from clusters.
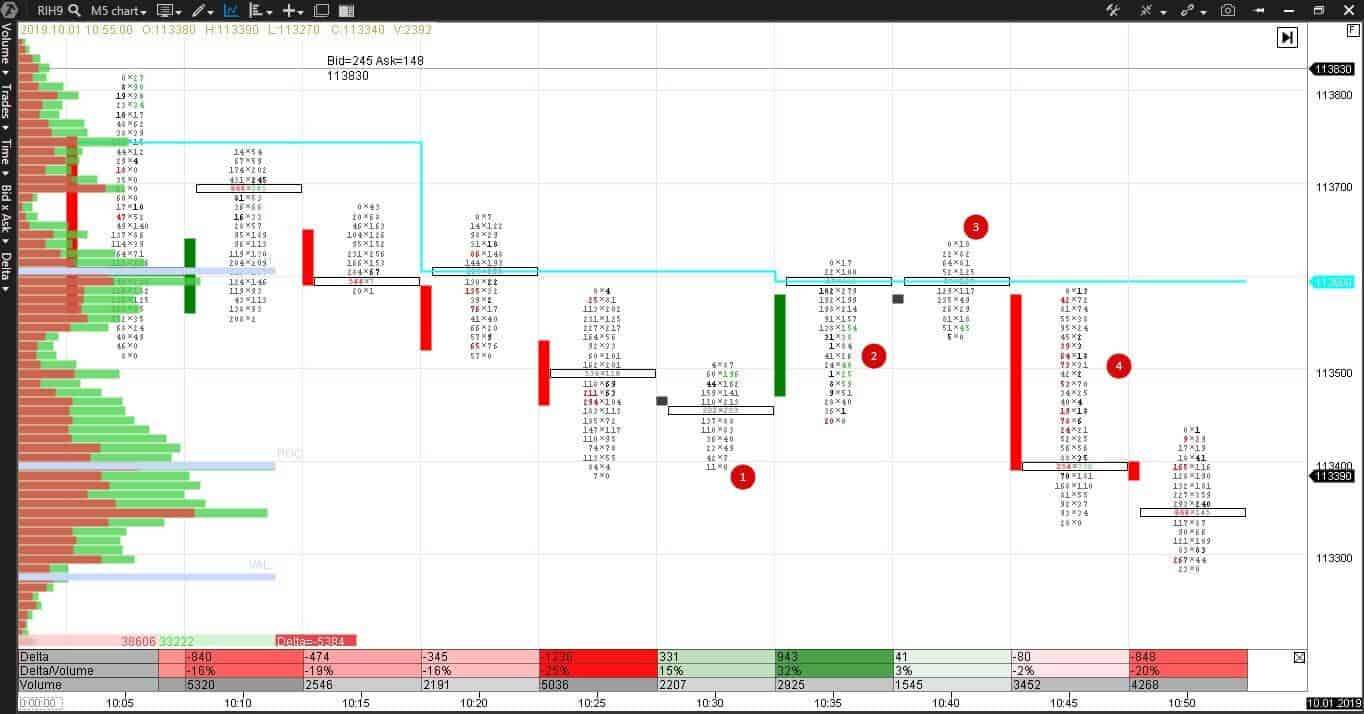
2 – The predominance of buyers is at the maximum volume level at 10:35 and the delta is positive. But the volume is less than it was in the previous bars where sellers were active. It is worth waiting for the next candle to have a clear picture.
3 – Drying out of buys on the doji high at 10:40 immediately after the buyers imbalance warns that they failed to push the price upwards.
4 – The explicit predominance of the sellers at 10:45 confirms the volume growth.


