
What does it mean to catch falling knives on the stock exchange?
Catching a falling knife means trying to open a long position during a rapid drop in the price.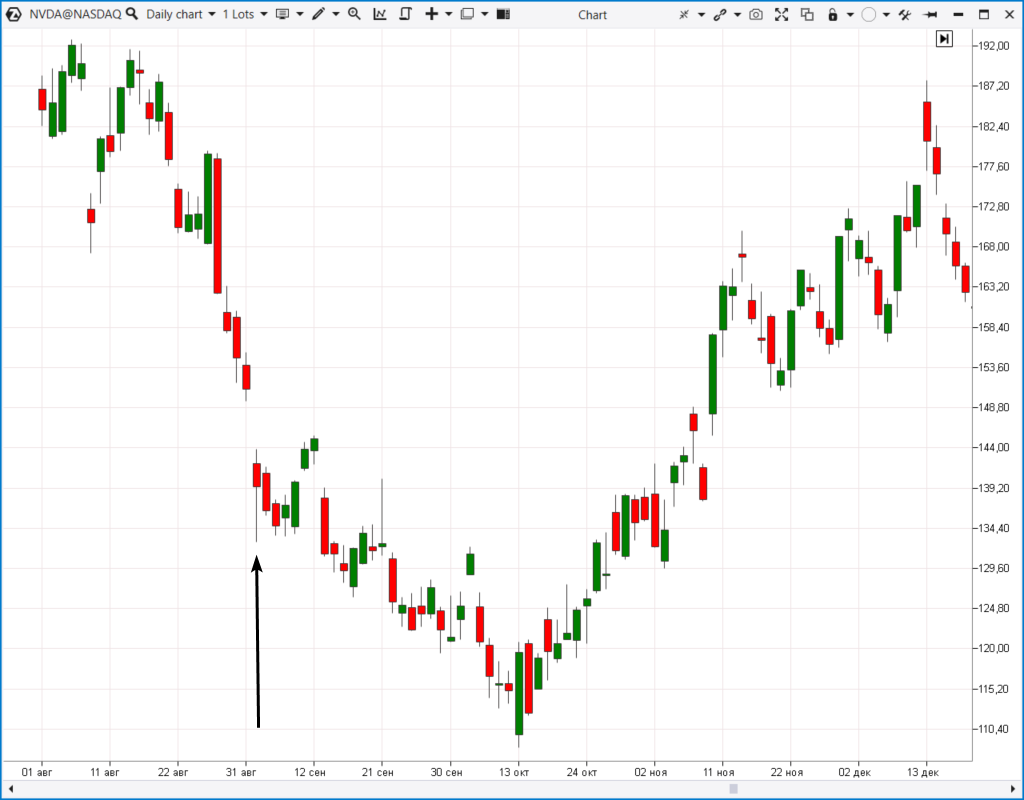
Does catching falling knives make any sense?
Catching falling knives is a great metaphor. It reflects the key features of this trading strategy:- you can be lucky and open a position at the very extremum. Unfortunately, the chances are low;
- you can see how the price continues to plunge, and you lose an increasingly significant amount of your deposit.
Three ideas on how to reduce risks using ATAS
Using the advanced instruments for volume analysis available on the ATAS trading and analytical platform, you can significantly reduce the risks of catching falling knives. You can implement the following ideas:- apply Market Profile;
- monitor round levels and levels of local extremum points;
- study the readings of professional volume analysis indicators.
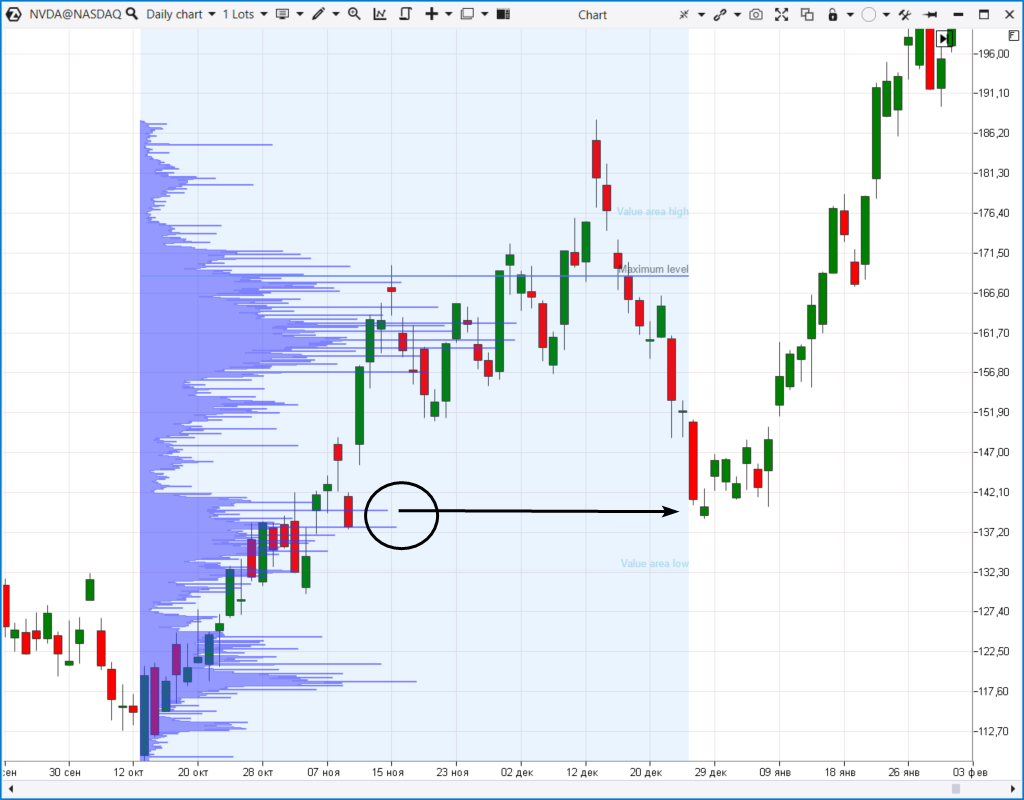
Idea 1. Catching falling knives with Market Profile
Market profile is an important instrument for volume analysis. It displays the trading activity at each price level for the selected time period. Using ATAS, you can analyze the sum of volumes, delta, and apply other settings. You can learn more about Market Profile in:- The Knowledge base;
- A detailed article about the Volume Profile indicator;
- A video on our YouTube channel.
Example 1. A daily chart of NVDA stock
After two wide bearish candles, the price fell to the area around $140 per share within three days. Large volumes were recorded there. A reversal occurred in that zone, which led to growth to new highs. Using this approach, it makes sense to place a stop-loss below the zone of high volume levels while maintaining an acceptable risk:reward ratio.
Example 2. Stock index futures
The cluster chart below helps identify a zone of high volume levels that formed on day 1 and 2. When the price rapidly dropped into this zone (3), it was followed by a reversal and a quite rapid growth.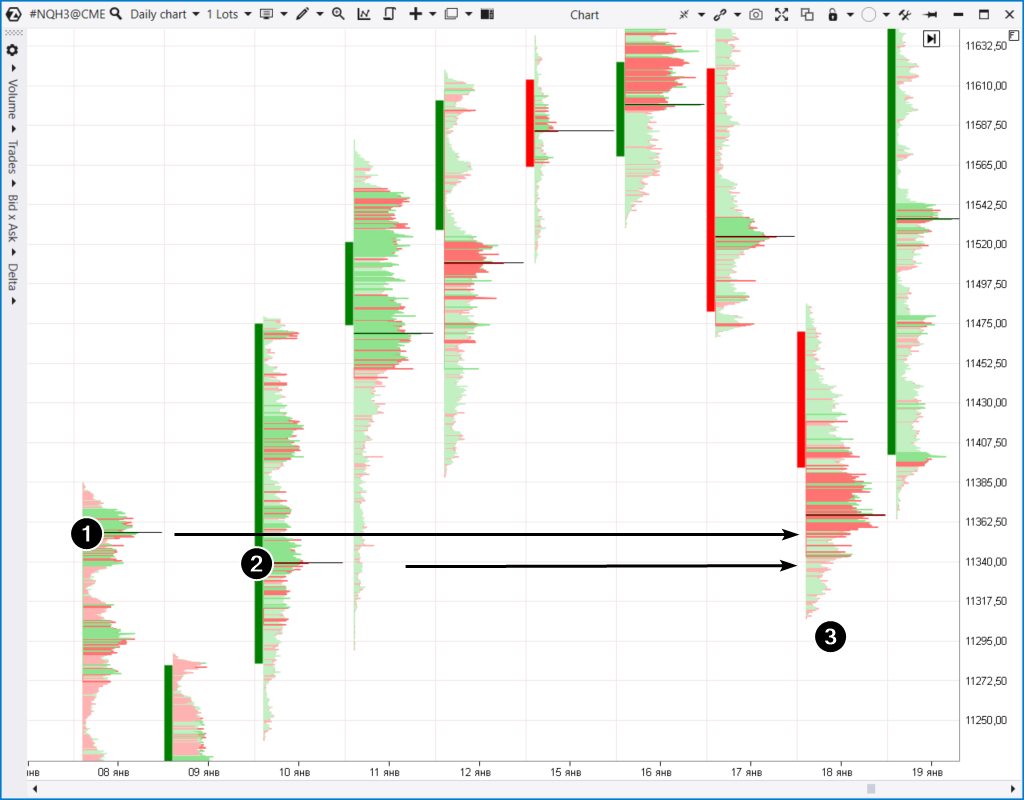
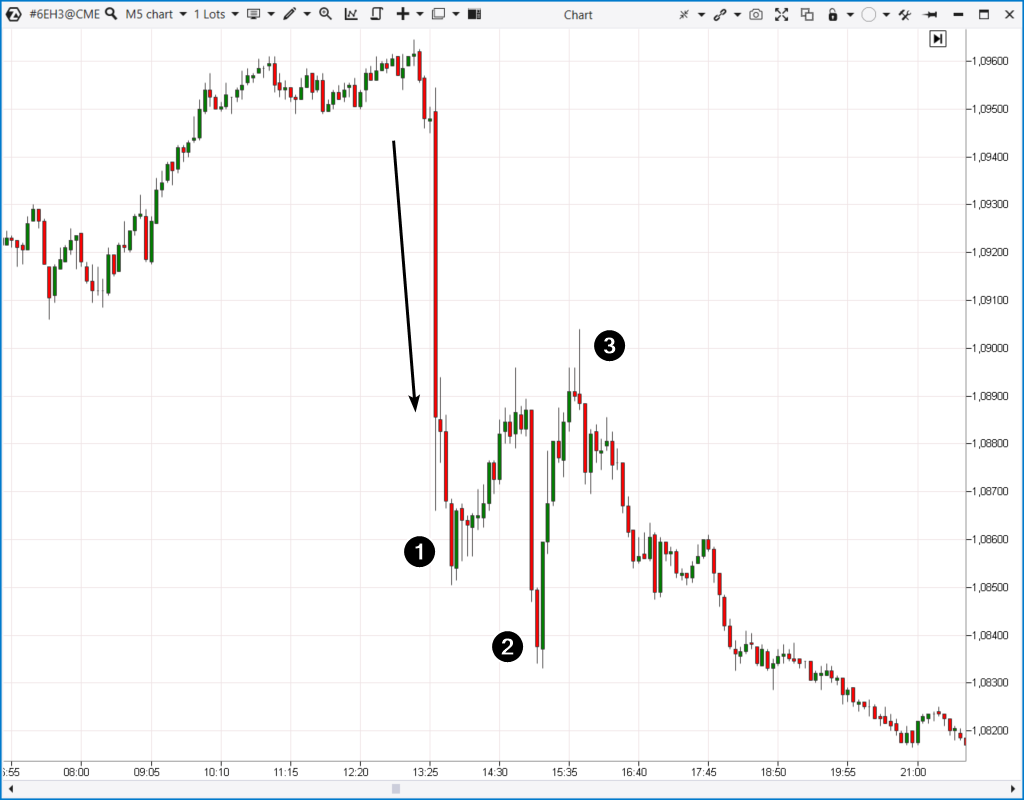
Example 3. Euro futures
After a false breakout of the 1.10 psychological level, the price of the futures plunged down at a rapid pace (1).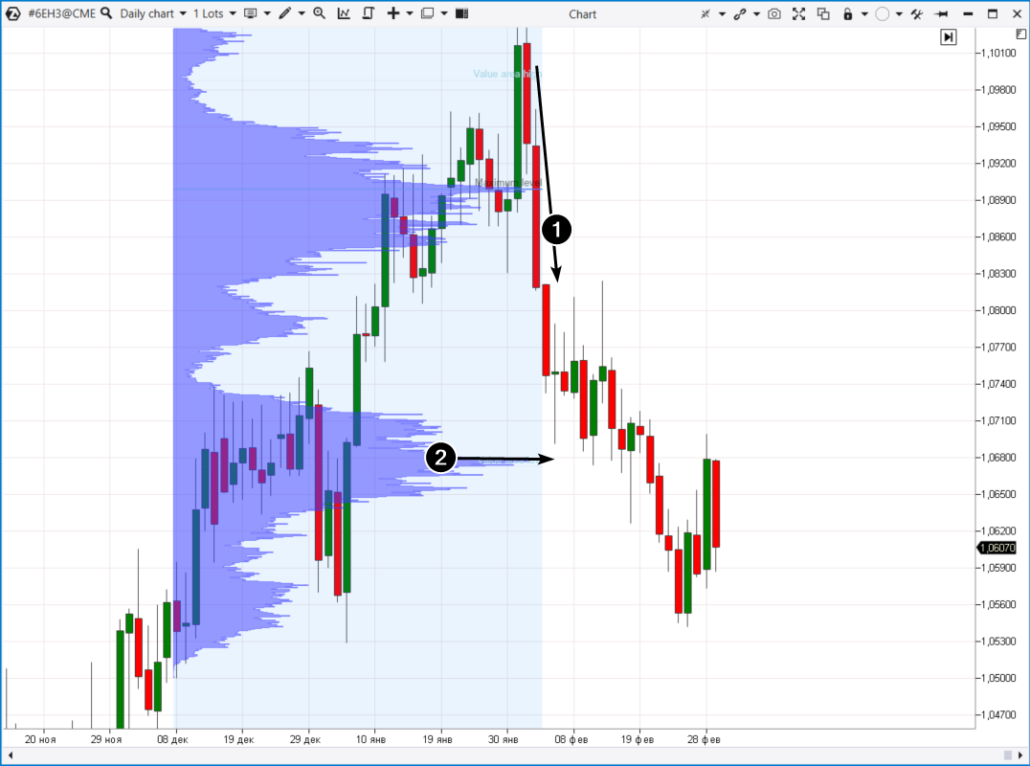
Three wide bearish candles formed on a daily chart. On the fourth day, the price fell to a horizontal level of large volumes. There was a rebound from this level, which could bring profit to those who were catching falling knives.
The example above illustrates the situation when the knife continued to fall after a pause. This danger awaits a trader who is opening a position against the trend. When developing a strategy for catching knives, it is essential to consider a scenario in which the fall may continue. Download the ATAS platform to find and study examples of rebounds from large volume levels on your own.Idea 2. Catching knives near important levels
The important starting levels are:- round levels which are indicated by “beautiful” numbers;
- levels built from noticeable extremum points — both intraday and on higher time frames.
Example 1. A falling knife in the oil futures market, the data was taken from the NYMEX exchange
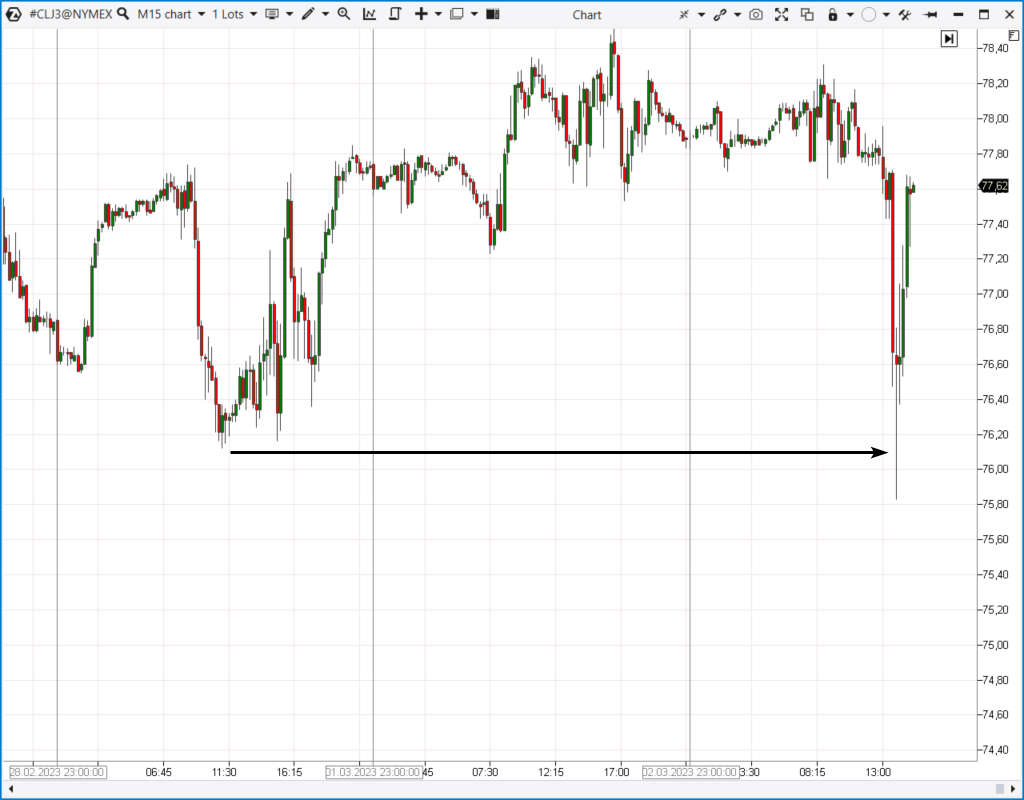
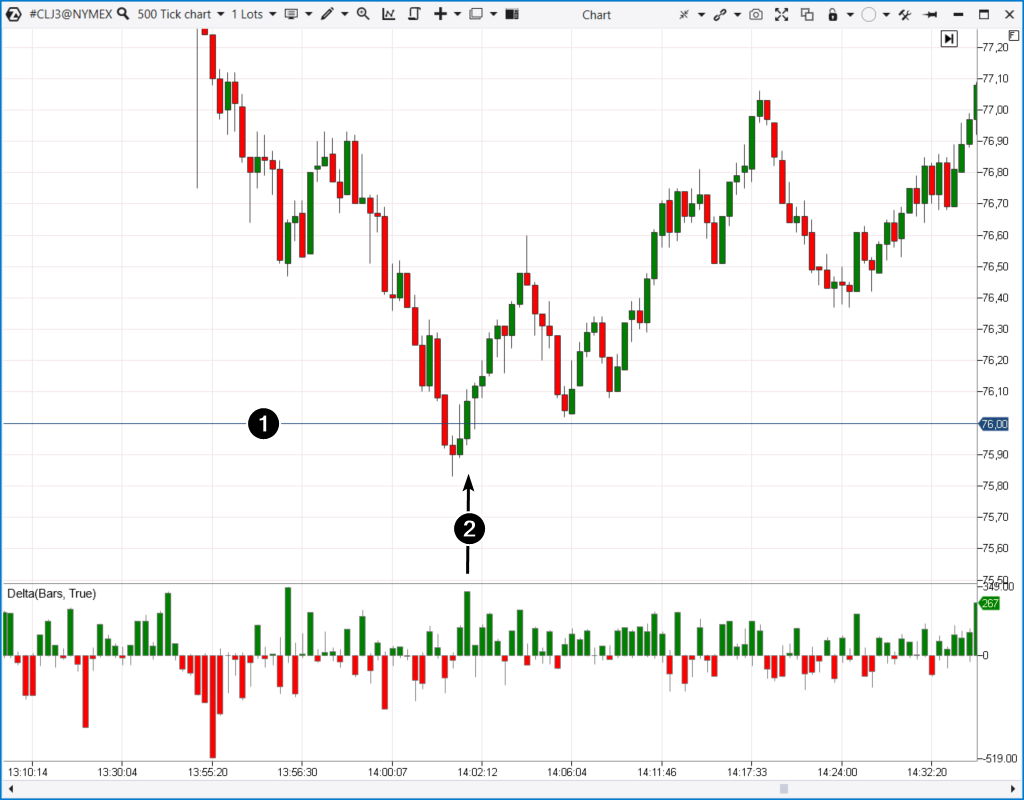
- dropped below the local extremum (marked on the chart above);
- dropped below the round level;
Example 2. XBT futures from the BitMEX exchange
The cluster chart below illustrates the decline in the price of Bitcoin amid the news about the Silvergate crypto bank’s problems. In one hour, the price collapsed by 5%. But when did the rebound happen? And what did the clusters show?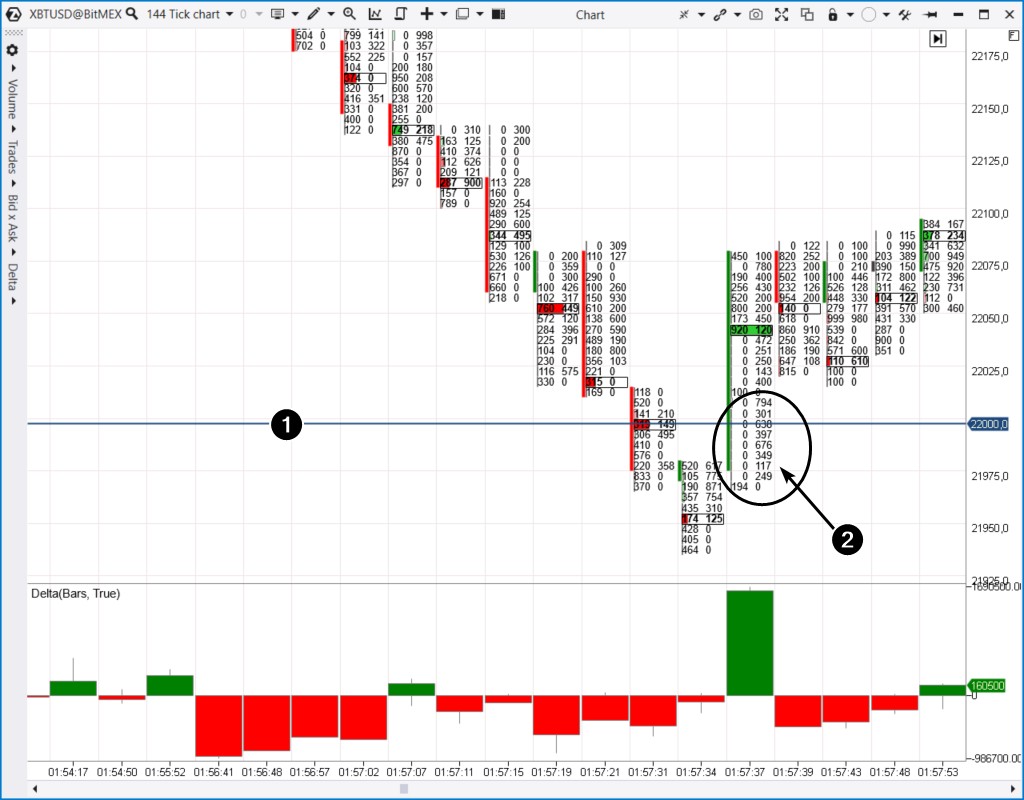
Example 3. Gold futures
This chart shows two falling knives marked with 1 and 2. They looked especially dangerous intraday on the 1-minute or 5-minute time frame. Specifically for dark theme lovers.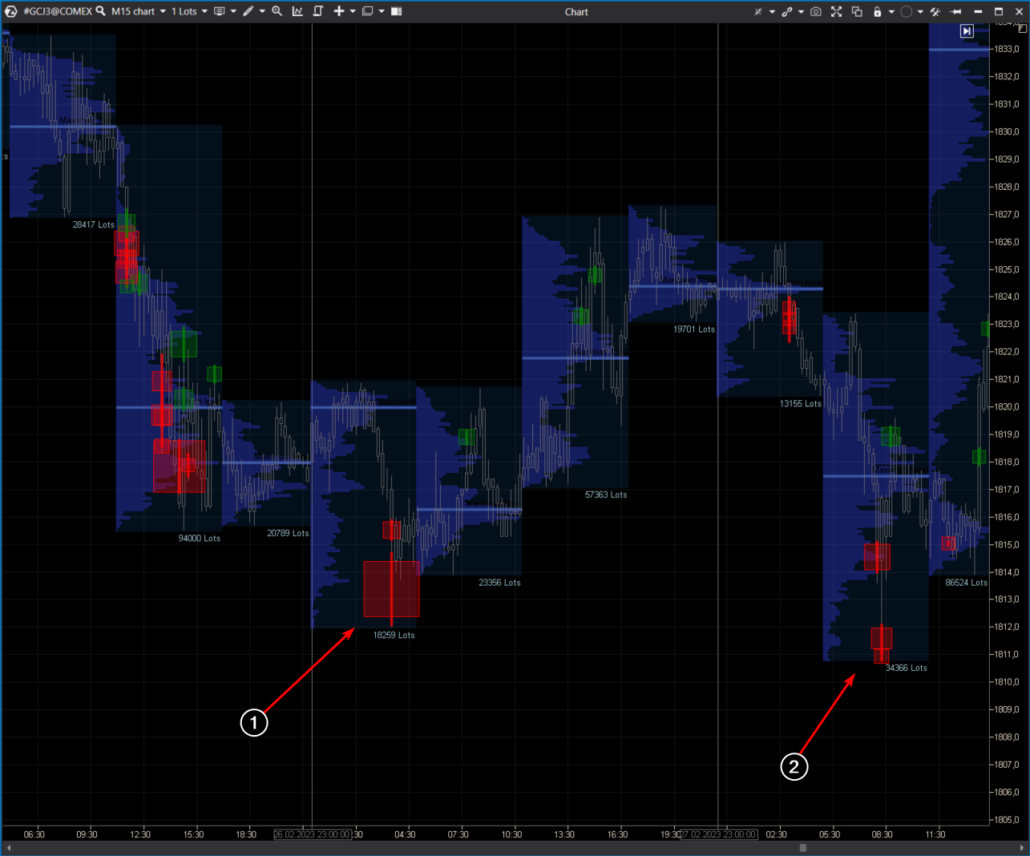
- the price quickly dropped below the previous day’s low;
- the Big Trades indicator signal appeared on the chart, indicating large sales. After that, the price skyrocketed. Surprising? “No,” professional traders will say.
Idea 3. Catching falling knives with professional indicators
In addition to the Big Trades readings on the chart above, you can experiment with the following indicators from the ATAS platform:- Speed of Tape shows the speed at which trades are taking place. The indicator can be configured separately for buys and sells;
- Stacked Imbalance is usually triggered during important reversals;
- DOM Levels shows support and resistance levels by analyzing the volume of limit orders placed in the DOM.
Example 1. DAX index futures
The price quickly dropped below the local minimum and the psychological mark. Then the Stacked Imbalance indicator was triggered. This could be a valid reason to try to catch a falling knife.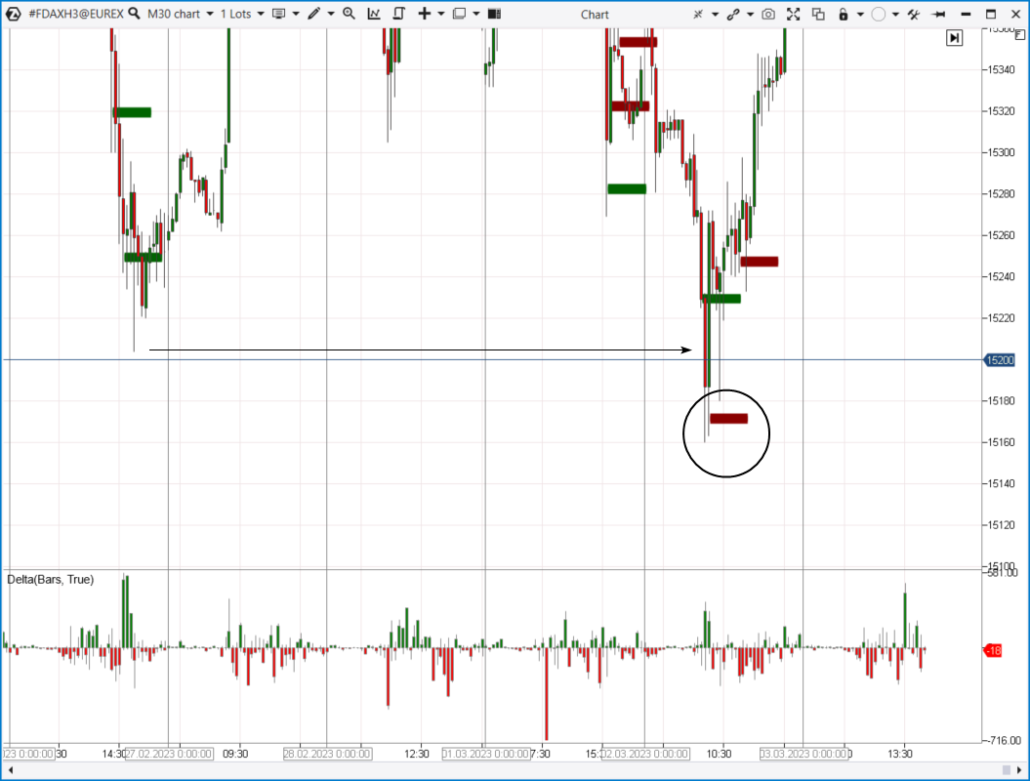
Conclusions
Catching falling knives in trading is a risky practice, as a sharp drop in price can be caused by objective factors, such as negative news. When the price of an asset drops rapidly, a trader may decide to enter a trade (try to catch a falling knife) in anticipation of a rapid price growth — this will potentially enable you to profit from the difference between buying and selling. Hope is the key word in this situation. If the price continues to fall, the trader will face losses. Therefore, catching falling knives is considered a high-risk strategy. Traders who implement it usually have enough experience and a deep understanding of the market to make quick and informed decisions. Catching falling knives is often accompanied by a high emotional burden, as it requires traders to rapidly respond to market conditions. We recommend that you practice catching knives in a safe “space” using the ATAS Market Replay simulator for traders. Download Free Trial of the platform — there are at least four good reasons for that:- It is free. You will get full access to the platform’s instruments during your free trial and will be able to appreciate all their benefits in order to make a purchase decision. Moreover, you will be able to continue using the program even after the 14-day trial period is over, but only for cryptocurrency trading.
- The platform allows you to download tick history from the futures, stock and crypto markets, therefore, you can be sure that catching falling knives does not damage your deposit.
- Market Replay (a history simulator) is built into the ATAS platform, so you will have the opportunity to practice catching falling knives without risking real capital.
- The platform offers many benefits for traders who want to combine bounce trading with easy-to-use cluster charts and useful indicators.
Information in this article cannot be perceived as a call for investing or buying/selling of any asset on the exchange. All situations, discussed in the article, are provided with the purpose of getting acquainted with the functionality and advantages of the ATAS platform.


