Footprint analysis is powerful – but it can also be dense. Cluster Statistic solves that by acting like a dashboard: it organizes key footprint metrics into a separate on-chart table, so you can scan the market faster, spot standout bars, and decide where a deeper cluster-by-cluster review is actually worth your time.
This is Part 1 of 2 in our Trading Methods Using the Cluster Statistic series.
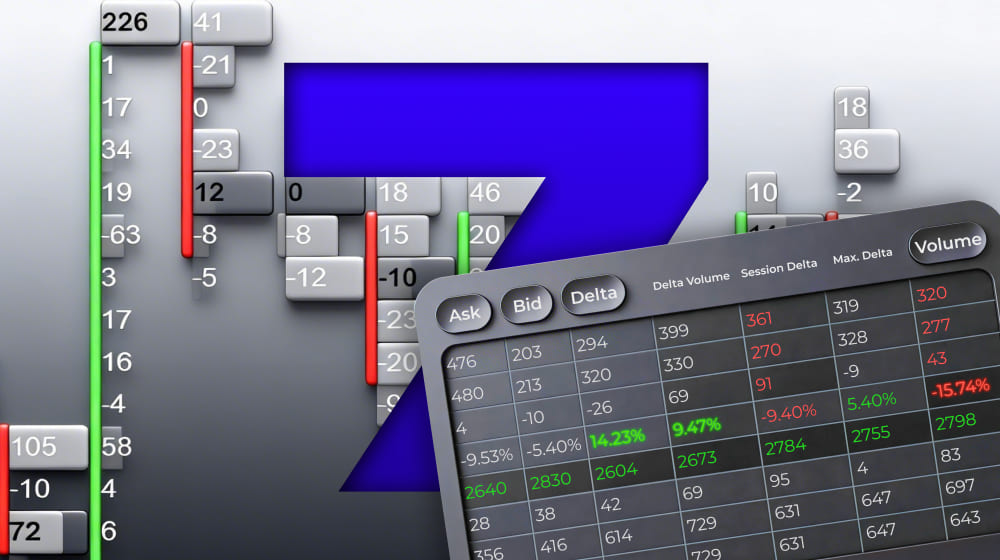
What is a Cluster Statistic
Cluster Statistic provides data on where active volume accumulation occurred and how buy and sell orders were distributed. It’s a helper layer for footprint analysis. The indicator turns raw cluster data into a clean, readable summary – so you can scan the chart faster and still stay close to what’s happening inside the bar.
Instead of manually checking multiple clusters and price levels, you get key footprint context collected in a separate table on the chart: where activity is concentrated, how pressure is shifted within the bar, and whether participation was building or fading. Download our software for free to experience these insights firsthand.
Start now!
Try ATAS free with no time limit
Use it when you want to:
- read footprints quicker without losing detail,
- spot standout bars worth drilling into (high activity, imbalance moments, extremes),
- keep key context visible while you work with levels, profiles, and other order flow tools.
Next, we’ll go through the exact values you can enable in Cluster Statistic and what each one tells you.
Parameters of the Cluster Statistic Tool
Cluster Statistic provides more than 15 parameters for assessing market activity. To control the indicator contents, you can simply tick the required parameters to display them.
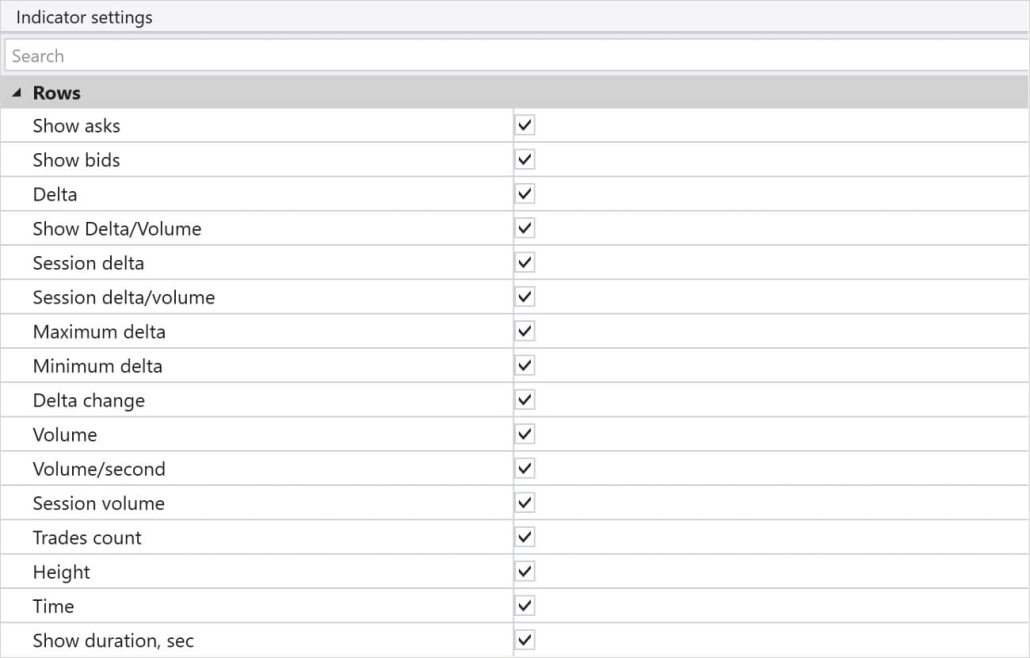
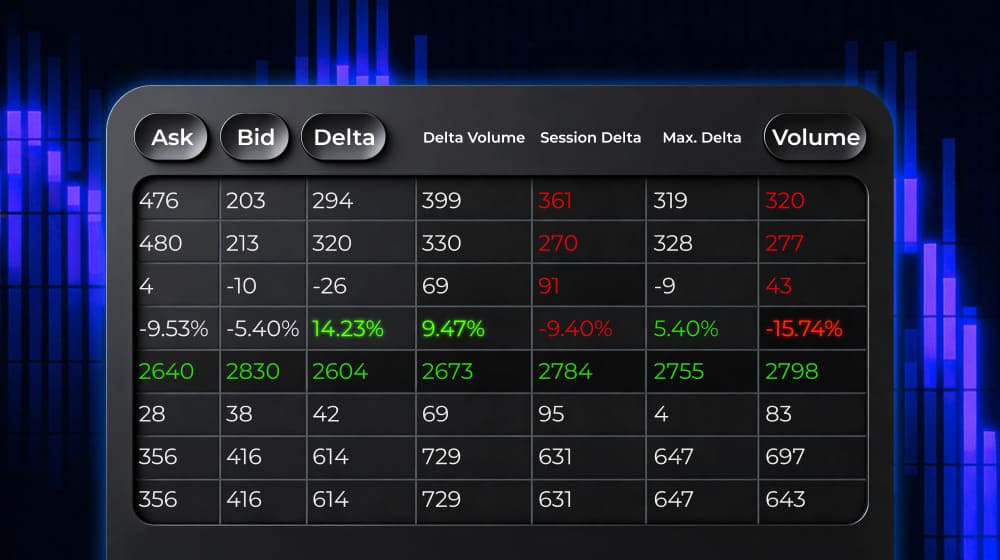
Here are the main parameters available in Cluster Statistic:
- Asks – The number of trades executed at the Ask price.
- Bids – The number of trades executed at the Bid price.
- Delta – The difference between Ask and Bid trades within this bar/candle.
- Delta/Volume (%) – The percentage of delta in relation to the bar’s total volume.
- Session Delta – The cumulative delta for a specific session.
- Session Delta/Volume (%) – The percentage of session delta in relation to the session volume.
- Maximum Delta – The maximum positive delta in the bar.
- Minimum Delta – The maximum negative delta in the bar.
- Delta Change – The change in delta between bars.
- Volume – The total volume (contracts/lots/shares) traded in this bar/candle.
- Volume/Second – The trading volume per second.
- Session Volume – The total accumulated volume per session from its start to the current time.
- Trades Count – The number of trades.
- Height – The height of the bar.
- Time – The current time of the trading session.
Extra Cluster Statistic Settings
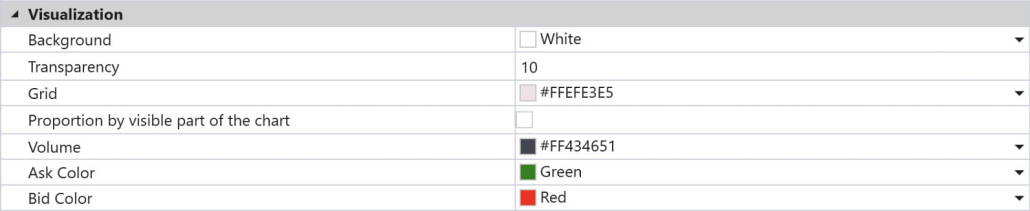
ATAS allows traders to flexibly configure Cluster Statistics to meet their needs. Key adjustable parameters include:
Visualization: You can choose which specific parameters to display on the chart, such as total volumes, delta, number of trades, and other key indicators.
Alerts for Delta and Volume: You can set alerts for specific delta or volume values. For example, if you want to be notified when the volume reaches a certain level or the delta becomes negative/positive, ATAS will trigger an alert when those conditions are met. This allows traders to respond quickly to changing market conditions and make timely trading decisions.
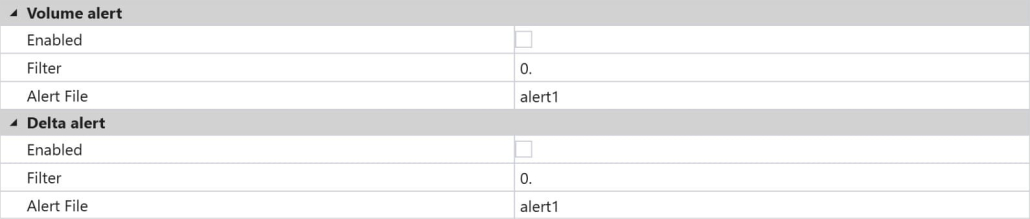
Setting Alerts (Filters) on Delta and Volume
The Cluster Statistic tool on ATAS not only visualizes data but also allows traders to set alerts (filters) on key parameters like Delta and Volume, ensuring that you never miss key market changes. This significantly simplifies market monitoring and helps traders respond promptly to important market events. Try setting up your own alerts by downloading ATAS here.
What is a Delta filter, and why is it needed?
A Delta filter allows you to set a specific threshold or range of values that, when reached, will trigger an alert on ATAS. For example, if you are interested in the moment when the delta reaches a certain level, an alert will help you quickly react to market changes.
Example Setup:
You trade using Cluster Statistic and want to be notified when Delta turns positive above 200 (indicating buyer dominance).
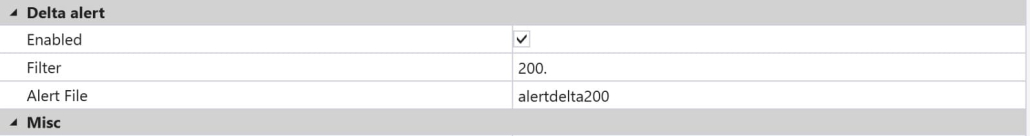
In the Cluster Statistic settings, you can set an alert for exceeding this value so that ATAS notifies you with a sound or pop-up.
How is this useful?
Imagine you are analyzing the market and want to enter a trade only if buyer dominance becomes evident. Setting an alert for positive delta will help you not miss the moment when buyer activity spikes. This helps you make trading decisions faster and reduces the time spent on manual analysis.
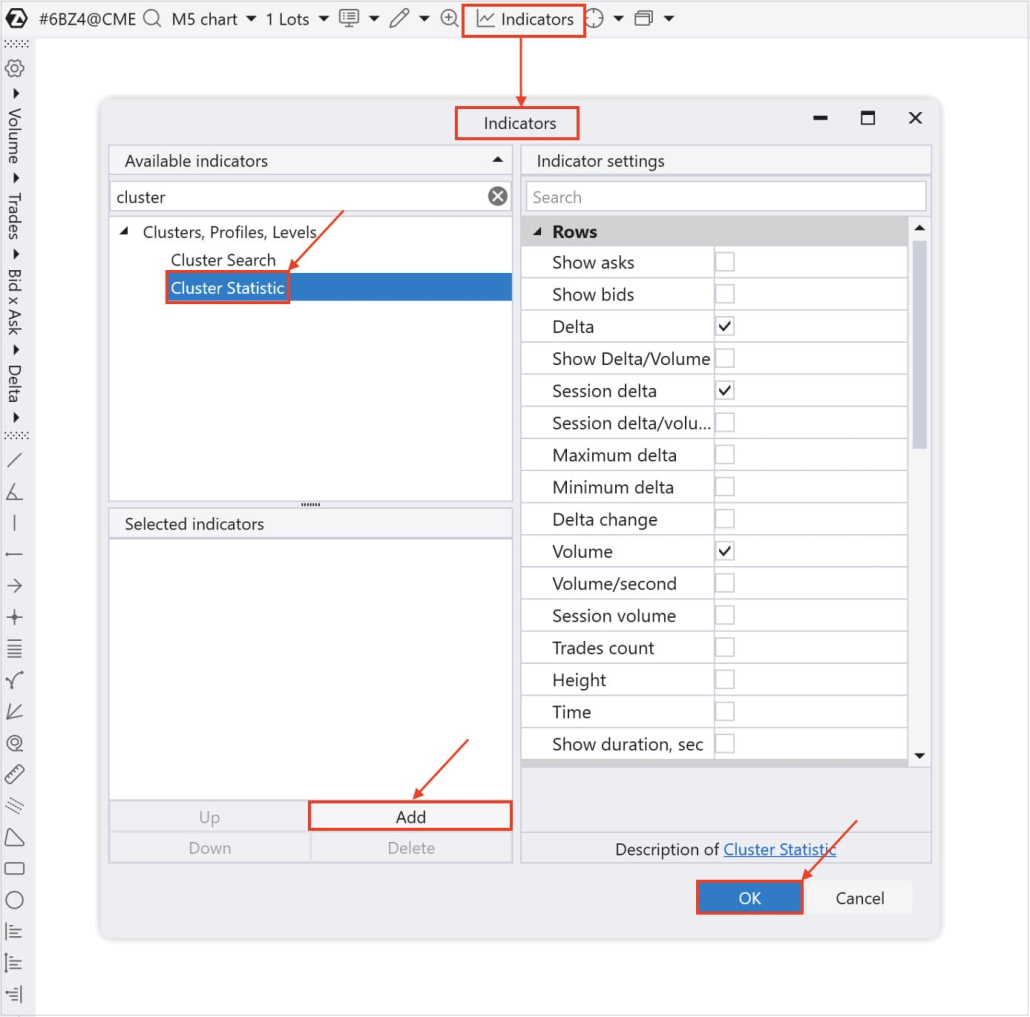
How to Add the Cluster Statistic Indicator to the Chart
You can do it in 7 steps:
- Download ATAS free of charge
- Install and launch the software
- Click “Chart” in the “Home” window
- Select any instrument of your choice: stocks, futures, or cryptocurrencies
- Press Ctrl+I or press the icon for adding an indicator
- Search for “Cluster Statistic” “Indicator” window
- Click Add and OK
How to Scale In Using Cluster Statistic
When traders use the Cluster Statistic tool effectively, they can make more informed decisions about position entry and sizing during price movements. The process of adding to positions is called ‘scaling in’.
Scaling in can potentially amplify results during trending moves, but it also increases exposure and requires careful market analysis, clear criteria for adding volume, and disciplined risk management.
Note: The following examples illustrate how traders might use Cluster Statistic data in their independent analysis. These are educational scenarios, not trading recommendations. All trading decisions, including position sizing and entry/exit points, remain the trader’s responsibility and depend on individual strategy, risk tolerance, and market conditions.
Key Principles of Scaling In:
1. Analyzing Market Sentiment with Delta and Volume
When scaling into a position, it is crucial to confirm that the current direction is holding and being validated by buyers or sellers. Monitor Delta and Volume at key levels. If positive Delta and volume are both increasing, this can indicate the continuation of the trend and provide a potential opportunity to scale in.
Example: You are holding a long position and see the price breaking through a resistance level with positive Delta and rising volume. In this case, adding to your position may be justified as buyers are showing continued dominance.
2. Using Session Delta to Confirm the Trend
Session Delta displays the cumulative delta over a given period and helps assess overall market sentiment. If Session Delta remains high or shows minimal changes during price pullbacks, it can confirm that the main trend is intact, allowing you to safely increase your position size.
Example: Suppose that after your initial trade entry, the price pulls back to a nearby support level, but Session Delta remains at a high level. This may support adding exposure, as buyers still appear to dominate the activity.
3. Analyzing Trades Count to Gauge Participant Activity
The Trades Count metric helps assess overall market activity. When scaling in, it is important to watch for spikes in activity and an increase in the number of trades, especially if this coincides with delta and volume confirmation. A surge in trades during the breach of key levels can indicate that the market is ready to continue its movement.
Example: You are holding a short position and notice that the price breaks through a significant support level with a sharp increase in the number of trades. This could be a moment to add to your position, as sellers are showing their strength.
Conclusion
At this point, the goal is simple: make Cluster Statistic clean, readable, and useful in day-to-day footprint work. Once you’ve selected the right parameters, fine-tuned the extra settings, and set up Delta/Volume alerts, the on-chart table becomes a reliable “dashboard” you can scan in seconds.
In Part 2/2, we’ll move from setup to application: you’ll learn 7 analysis methods using Cluster Statistic — from spotting volume accumulation zones and reading delta pressure to interpreting session context and activity shifts. We’ll also cover how to use Cluster Search to identify potential exit zones based on your footprint criteria. Want to try it on your own charts? Download ATAS and explore Cluster Statistic right now!
Subscribe
Get the latest ATAS news delivered conveniently