
What is a VZO?
The Volume Zone Oscillator indicator was developed by Walid Khalil and David Steckler. They presented a description of the instrument in the “Technical Analysis of Stocks and Commodity Markets” magazine in May 2011. For VZO, two EMA moving averages are calculated taking into account the volume – their percentage ratio is the final result. The Period parameter seems to be the only important setting. All charts in this article use the standard value Period = 10.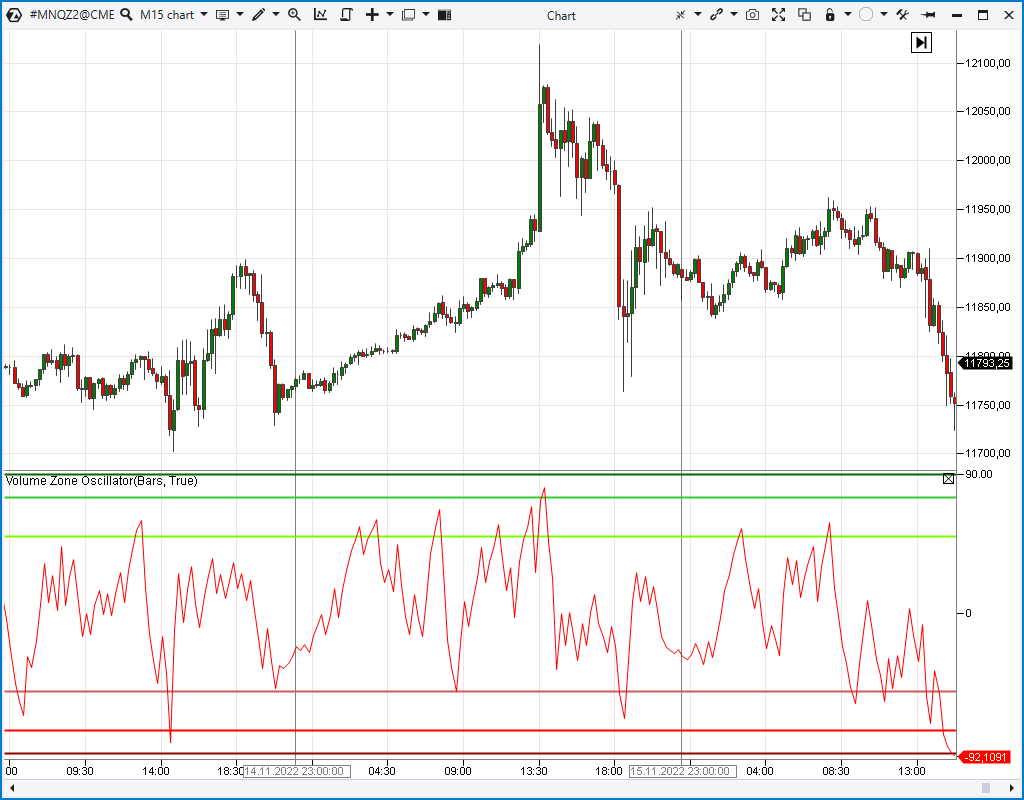
What is Delta Chart?
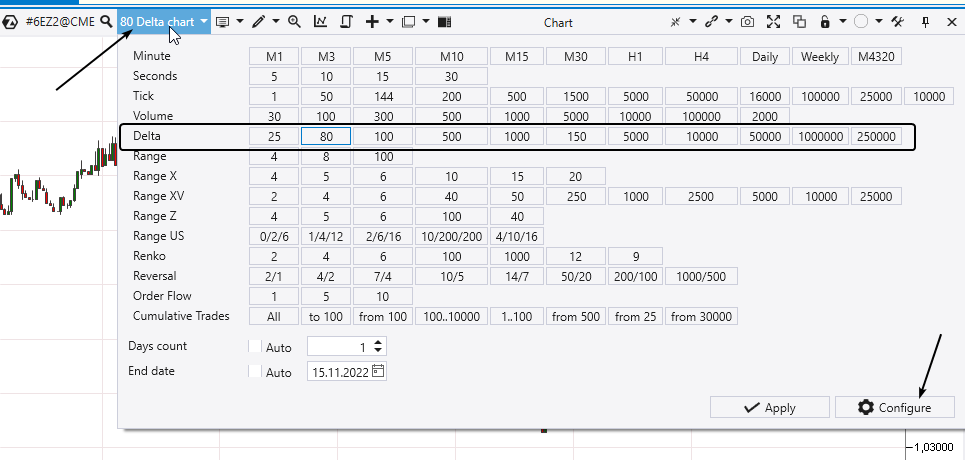
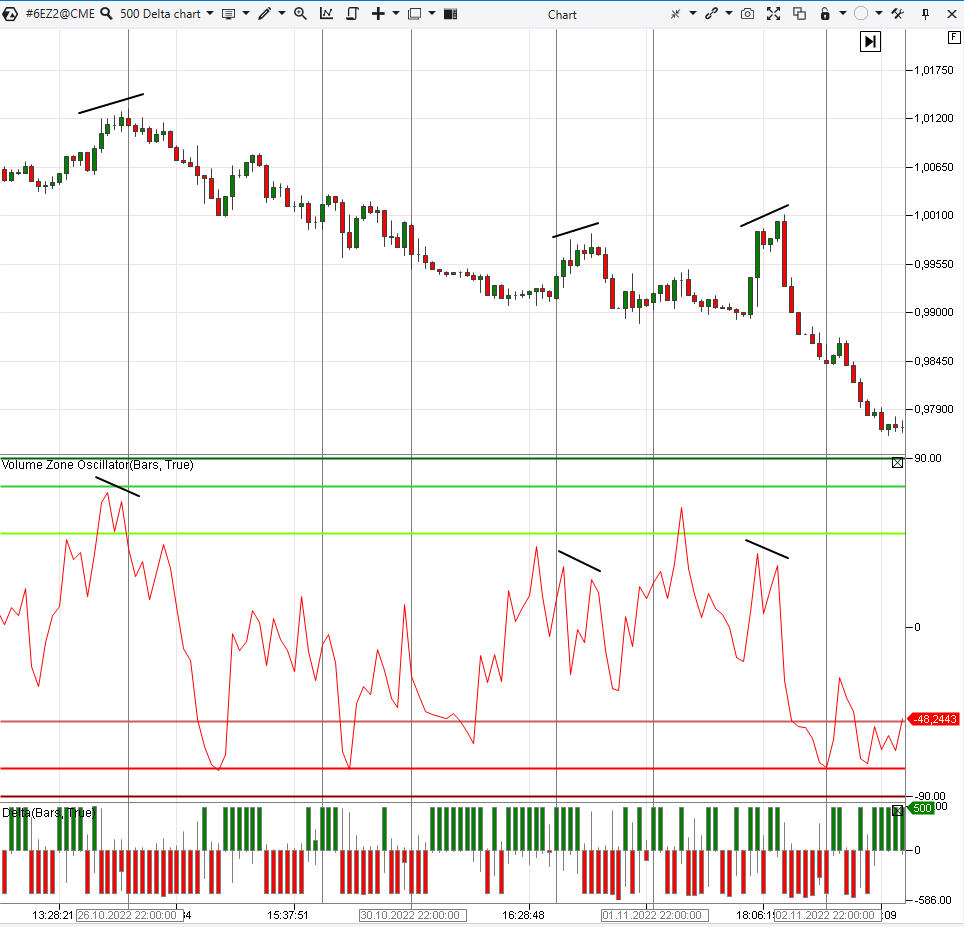
Standard charts are built on the basis of equal periods of time (timeframes) – one candle per hour, per 5 minutes, per day. But other events can be taken as a trigger for opening / closing a candle along the time axis: a certain price action, a volume value. For example, on the Delta-type Charts, the candle closes when the Delta indicator value reaches a predetermined value. To appreciate the difference, we have presented the same Euro futures market on the standard 1 hour timeframe and on the Delta Chart = 500: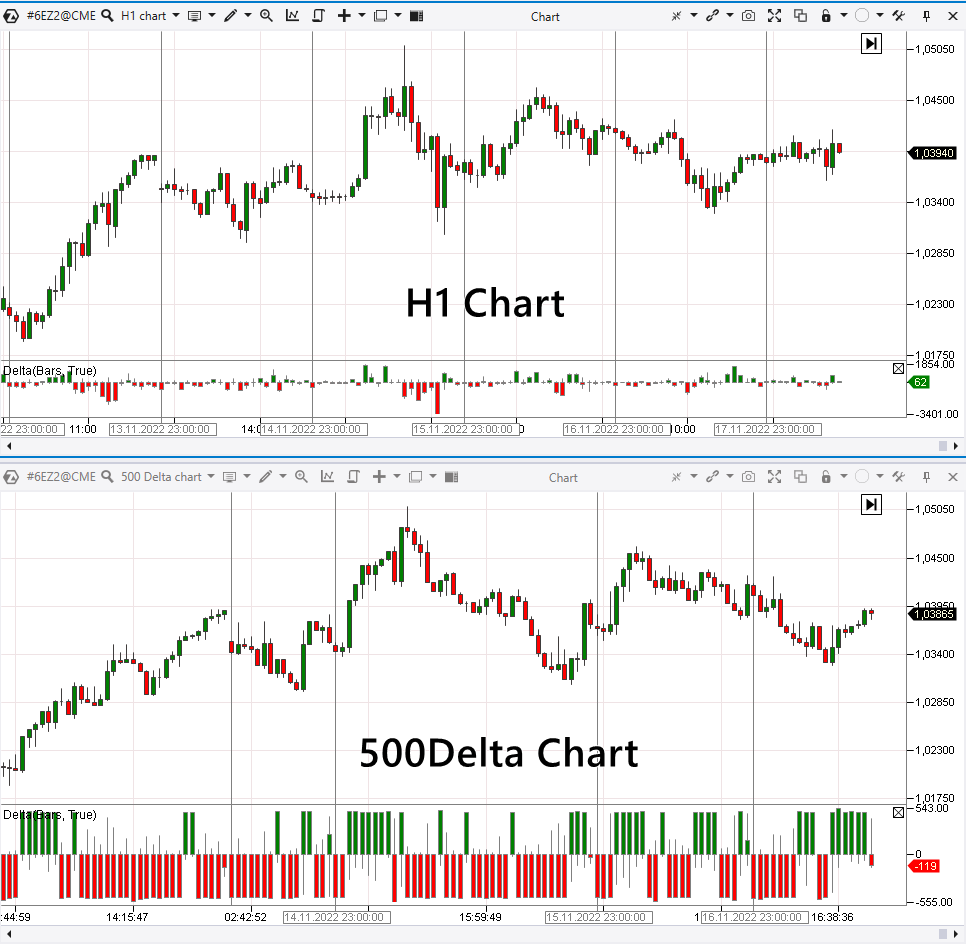
The idea of finding reversals
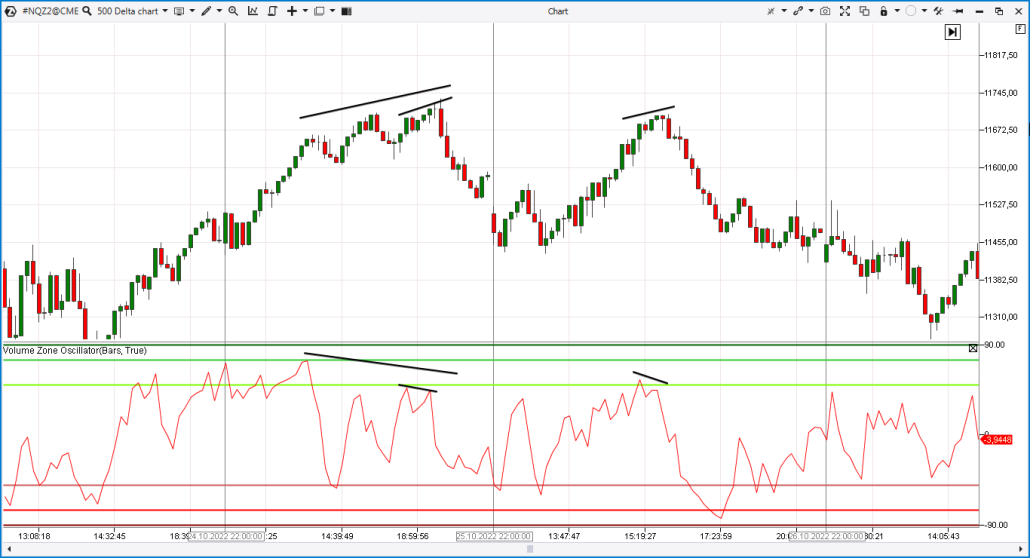
The point is to look for price reversals on the Delta Charts using divergences (what are divergences) on the VZO oscillator. Delta shows the pressure of initiative trades (momentum). And if the initiative weakens, it will most likely lead to the formation of divergences on the VZO. In turn, they will warn of a possible reversal (correction). Divergence illustration – intraday long and short entry signals in the euro futures market are shown below in the chart: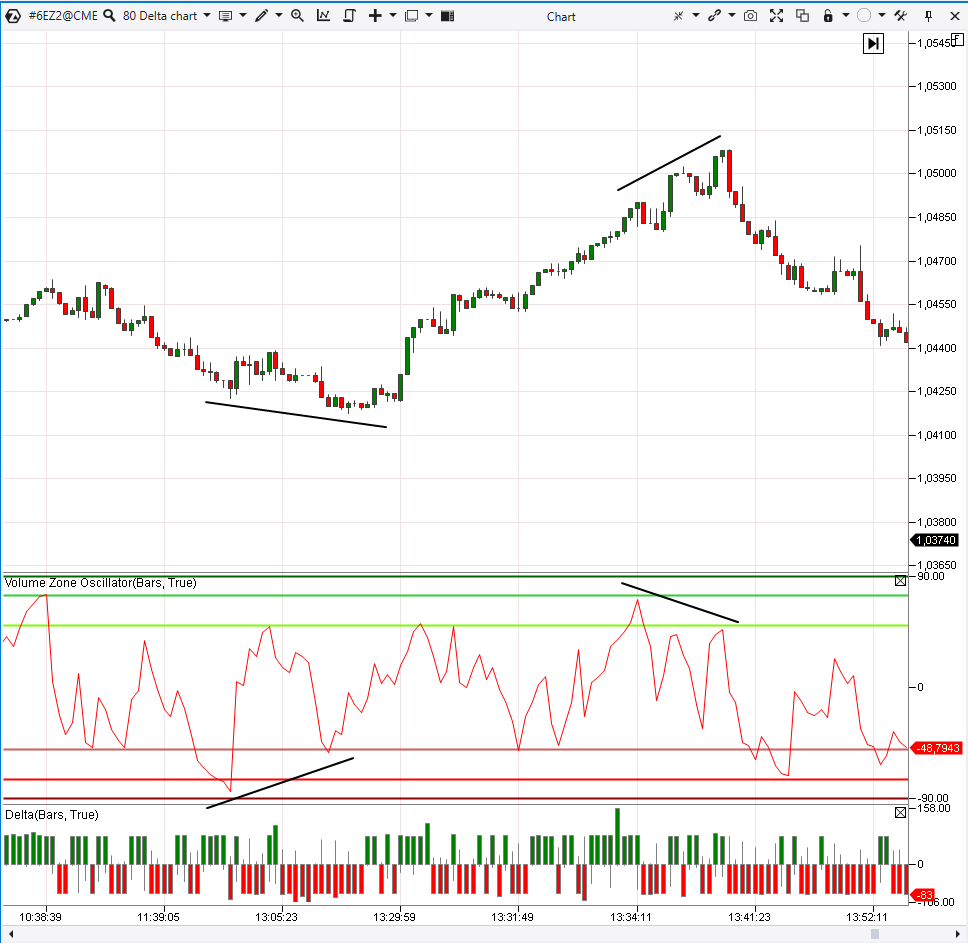
More examples
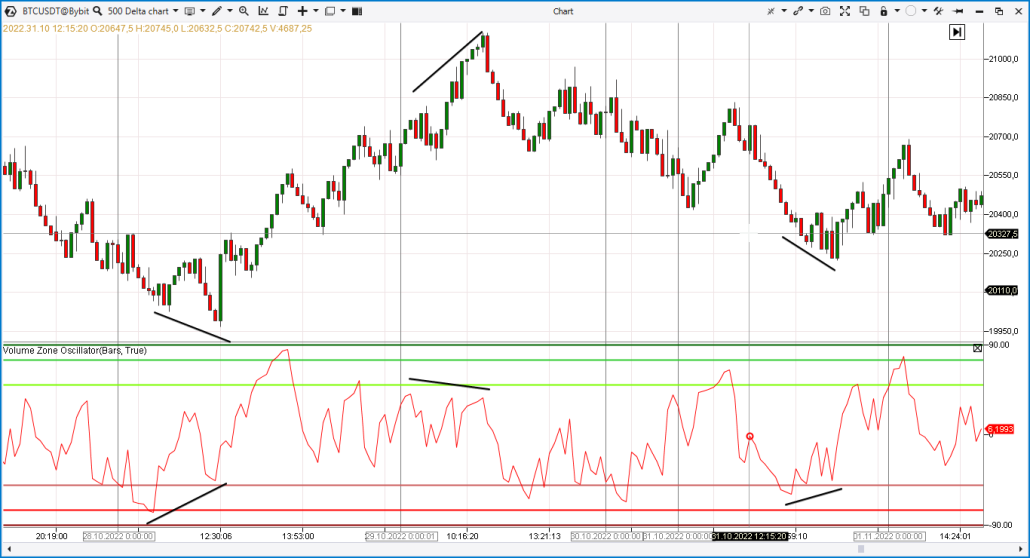
6B Market example. The pound futures price has exceeded the round level of 1.2. However, the divergence in the VZO indicator on the Delta chart indicated that the buying momentum in the market was waning. This could be interpreted as the formation of a false breakdown – a “bull trap”.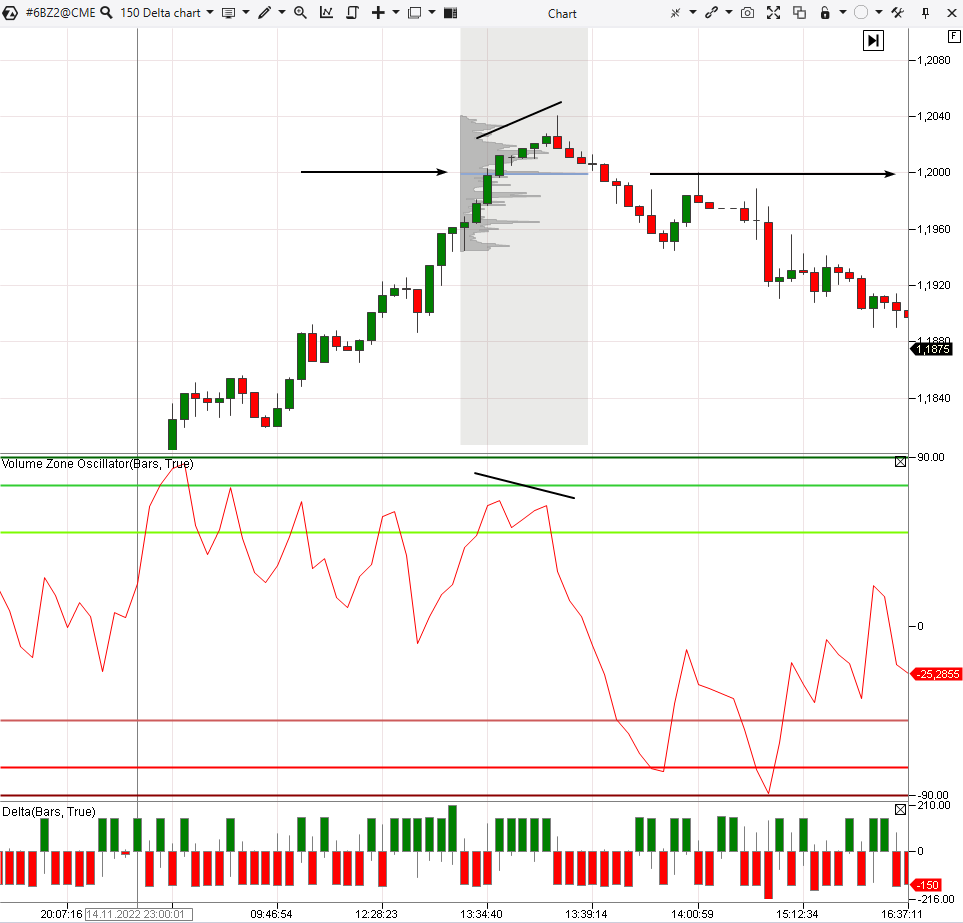
How to get started using VZO divergences on Delta Chart
This idea can hardly be called a full-fledged strategy – it does not set the rules for risk management and does not provide other important details. Nevertheless, it deserves attention. On its basis, you can develop your own strategy or optimize the existing one. Before risking real money, test ideas on a history simulator or demo account, to verify their effectiveness. We recommend taking the following plan as a basis:- Download the ATAS. The platform offers many benefits for futures traders. Find out how to use convenient cluster charts and useful indicators of the ATAS platform.
- Explore the VZO divergence pattern on the Delta Chart in the markets you prefer.
- Practice trading in the ATAS Market Replay.
- Develop a trading plan. Only then switch to a real account using the minimum volumes.
Conclusions
This article shows examples of the VZO indicator on Delta charts. This nontrivial combination allows you to receive signals about reversals. You can keep experimenting:- use non-standard charts to analyze the market “from different angles” in order to see what most other traders do not see;
- explore the behavior of indicators on non-standard charts.
Information in this article cannot be perceived as a call for investing or buying/selling of any asset on the exchange. All situations, discussed in the article, are provided with the purpose of getting acquainted with the functionality and advantages of the ATAS platform.


