
How to Understand The Depth of Market Indicator
The Depth of Market indicator provides information about real-time buy (demand) and sell (supply) orders. By default, the ATAS platform adds the Depth of Market indicator to every newly opened chart. It looks like a two-color histogram on the right-hand side of the chart. As an example, let’s take a look at a screenshot of a one-minute chart for Litecoin futures on the Binance exchange.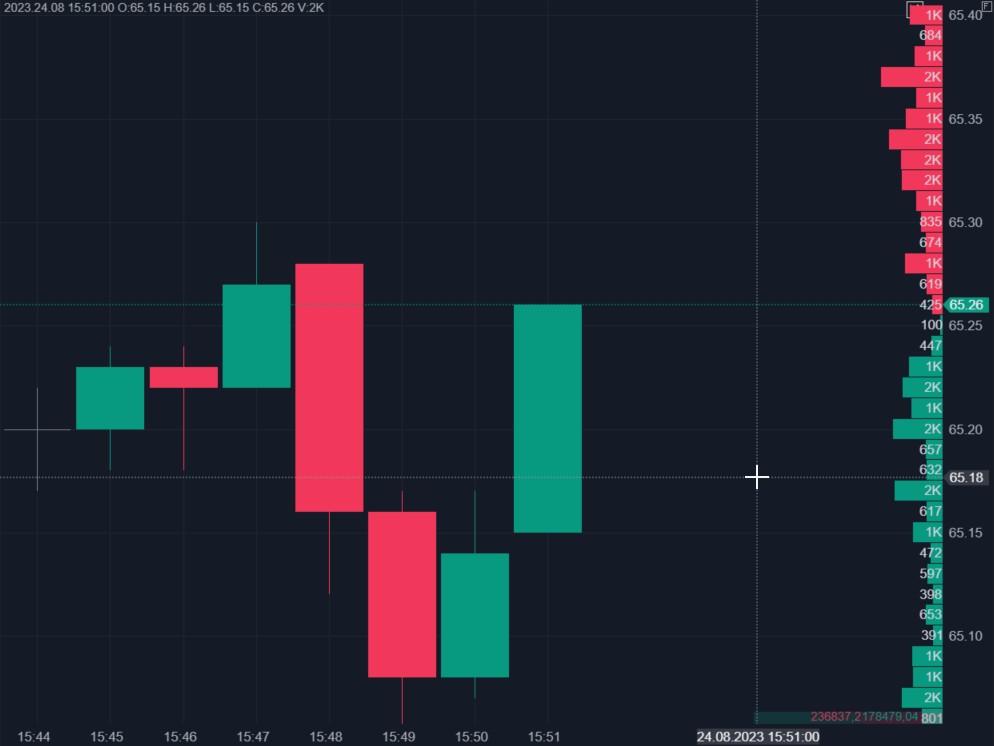
- the last trade occurred at a price of 65.26;
- and at this same 65.26 level, there are 425 contracts listed for sale;
- at the level just below, at a price of 65.25, there are 100 contracts listed for purchase.
Setting Up the Depth of Market Indicator
Important! To use the Depth of Market indicator, an active connection to an exchange that aggregates all incoming orders by levels and broadcasts this data in real-time is required. For instructions on how to configure ATAS to connect to the exchange of your interest, please refer to the relevant section in the Knowledge Base. Here is what the settings menu for the Depth of Market indicator looks like: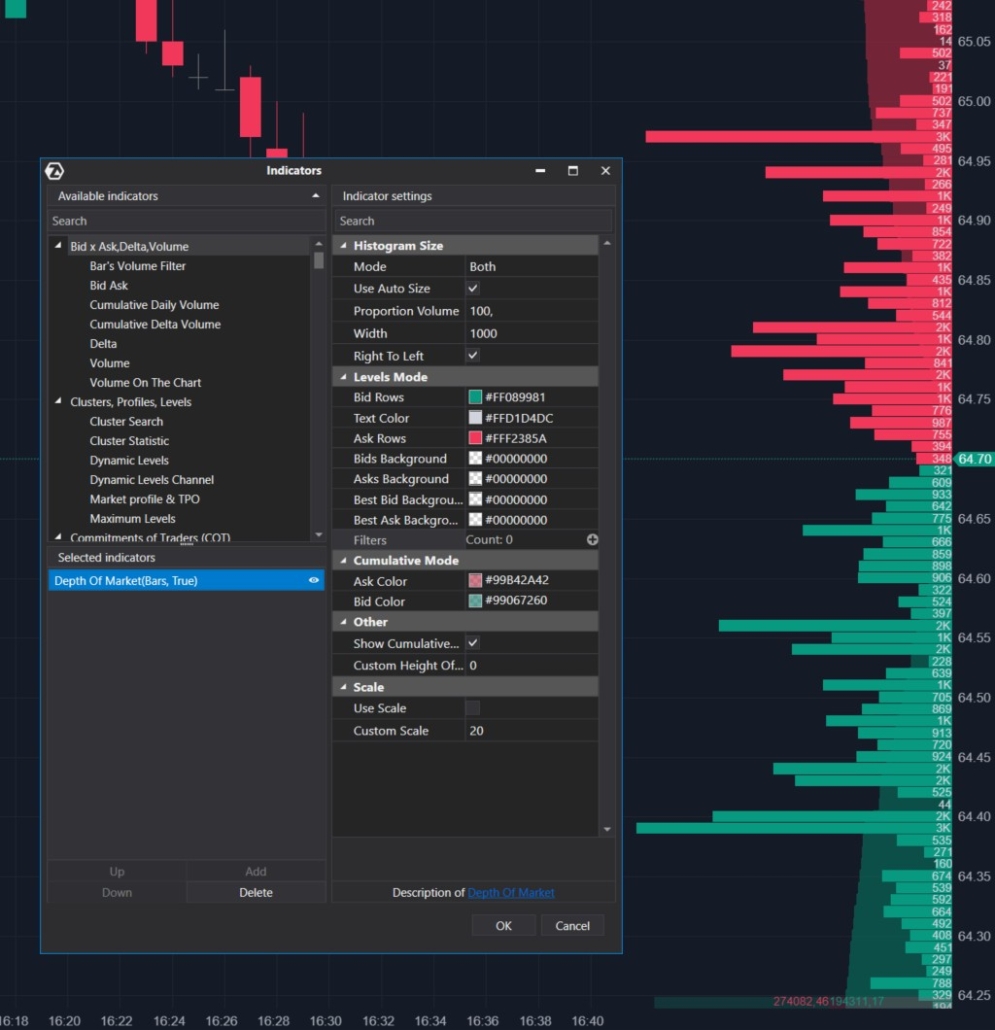
- colors;
- scale;
- enable/disable cumulative market depth — the sum of all buy and sell orders.
How to Use the Depth of Market Indicator
To make trading decisions, basic supply and demand logic is typically applied. The stronger the demand from financially capable traders outweighs the supply, the higher the chances that the price will rise. It is hard to argue with this logic, but exchange trading is full of tricks. It is a “zero-sum game” because your profit is someone else’s loss. The appearance of large orders may aim to stimulate demand from other traders. What for? Imagine you are a major exchange trader, and you need to sell a large long position. Ideally at the highest possible price. To achieve this, you place a large Buy-Limit order in the exchange’s order book. Other market participants spot this order and react by making their purchases. That is exactly what you need. By using a spike in demand, you sell your long position and cancel the Buy-Limit order, causing it to vanish from the order book. This makes those who bought your contracts begin to question their decisions.Nuances of Working With the Depth of Market Indicator
The data flow for the Depth of Market indicator can be:- Paid. As technology advances, Level II information is becoming more accessible. However, in order to receive data in the trading platform, you may have to pay. Especially when it comes to the stock market.
- Free. As a rule, the market depth is broadcast by crypto exchanges for free. You can also register for a demo account to receive free market depth data from a reliable provider on the stock exchange. But be prepared that you will see not the entire order book but, for example, 10 levels up and 10 levels down.
- Continuous. For example, crypto exchanges. You can add your order to the order book or cancel it at any moment.
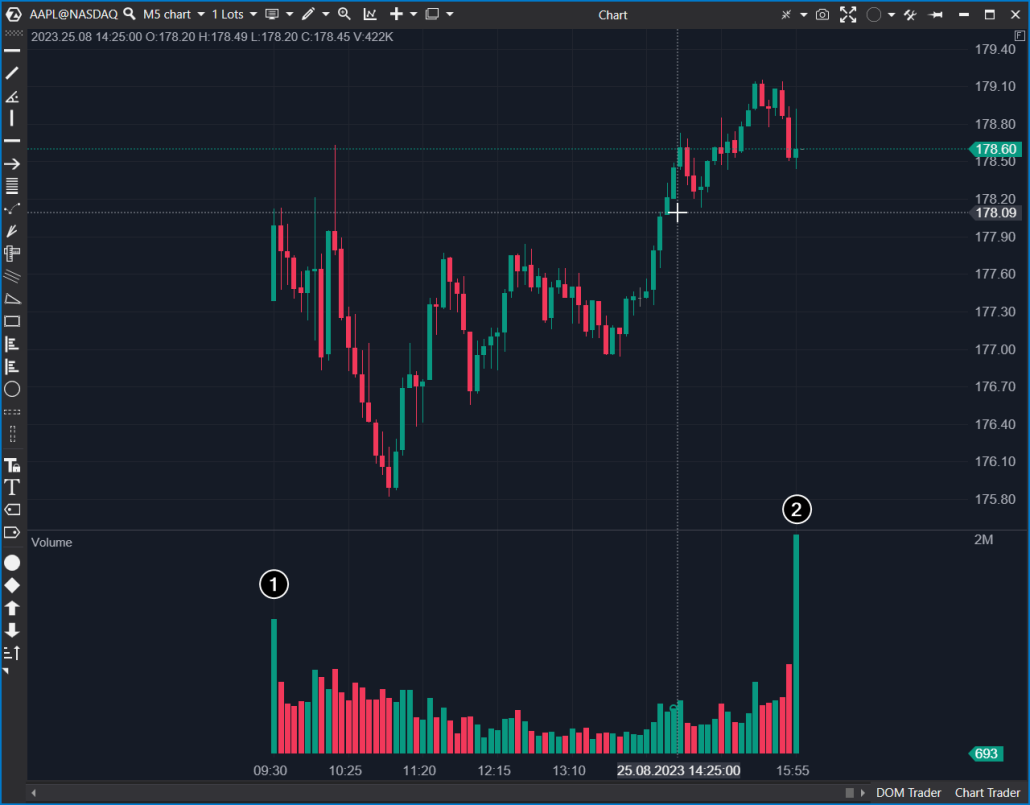
- Executed only at market open/close. This is more typical for the stock exchange. Therefore, during the first (number 1 in the screenshot below) and the last (number 2) minutes of stock trading, you will always see spikes in volume.
- be mandatory for use by scalpers — they can base their strategies on order book dynamics;
- be recommended for intraday traders to optimize entry/exit points;
- have no significant value for position traders and long-term investors.
Pros and cons of the Depth of Market indicator
Avantages
Better understanding of the market. The DOM enables you to see order volumes at different price levels. This is necessary to understand which price levels are crucial for market participants. Metaphorically speaking, the Depth of Market indicator allows you to “peek into the future” because some of the orders will eventually turn into trades. Better execution. Market depth analysis helps in more precise strategy planning and optimizing entry and exit points for trades, relying on information about current support and resistance levels. Competitive advantage. The DOM data provides more information for making decisions based on the actual market situation. Market depth gives you a competitive advantage over traders who do not have this information.Disadvantages
The complexity of the analysis. Effective work with the Depth of Market (DOM) requires a good understanding of the market and experience in analysis. It is essential not only to see the volumes but also to interpret their meaning correctly. Discovering hidden volumes. Some market participants prefer to conceal their orders. We are talking about “icebergs” — orders that are not visible in the order book. They may be fully or partially hidden. Let’s say there were 100 orders placed for sale in the order book, but when the price moved upward, 200 contracts were executed at that level. It is possible that 100 of these contracts were hidden. Dependency on liquidity. In less liquid markets or during periods of low activity, the DOM may provide less reliable information. Sometimes it can be very unpredictable. Having substantial volumes at particular levels does not guarantee that the market will move in that direction. Market manipulation is possible. A manipulator understands that when a large order, such as a buy order, appears in the order book, it is likely that other traders will also join in and make purchases, following the lead of that order. Read more in the article on spoofing.Advantages of the DOM Levels Indicator
Another nuance of working with market depth is that it requires a quick reaction. In liquid markets, changes in the order book occur very dynamically, and tracking them in real-time can be a challenging task that demands high concentration. To assist traders in promptly responding to market depth changes, ATAS offers the DOM Levels indicator (as well as the DOM Trader module) with heatmap functionality. Here is what it looks like: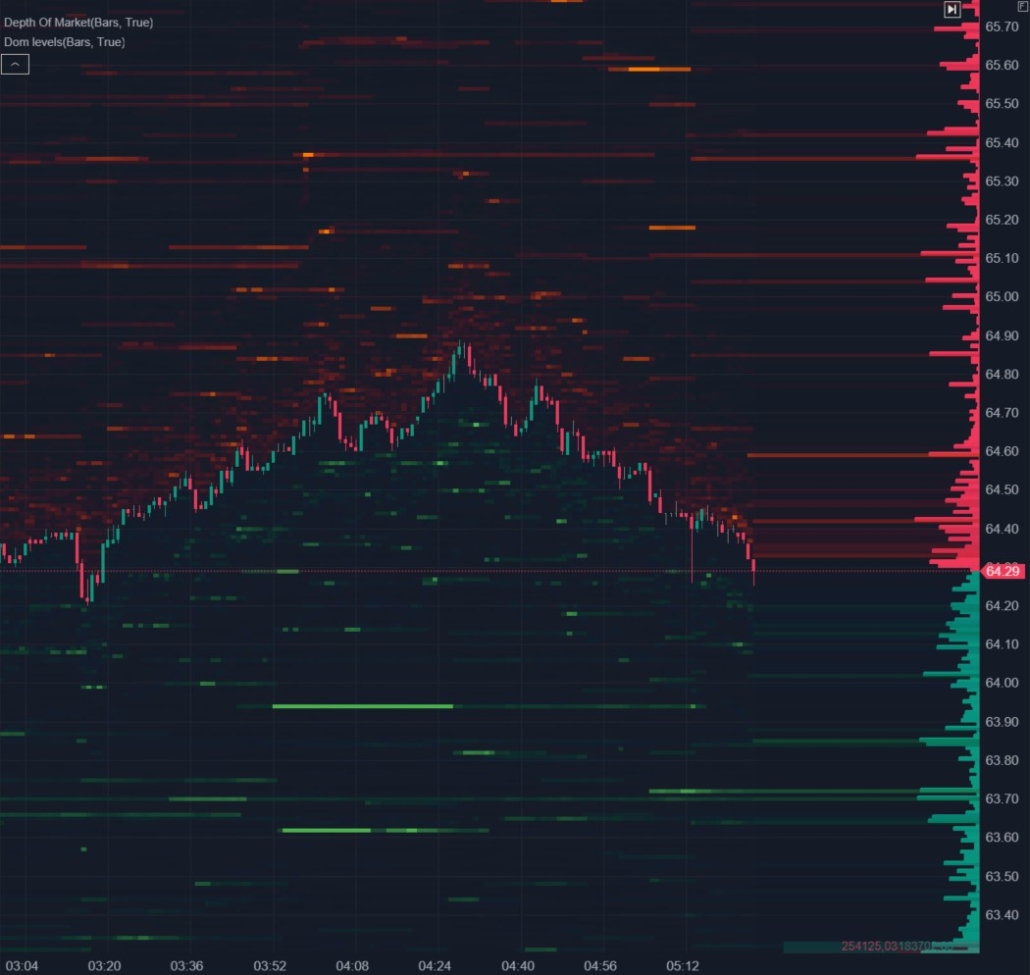
- it is more visual and convenient for tracking;
- you can study patterns of price interaction with significant order levels.
Learn more about the Market Replay functionality for training traders in this article.
Advantages of Using the Smart DOM Module
Within the ATAS platform arsenal, there is a separate module for trading with a particular emphasis on utilizing the order book. This module is especially beneficial for scalping. Here’s how the module may look, using Litecoin futures on the Binance exchange as an example: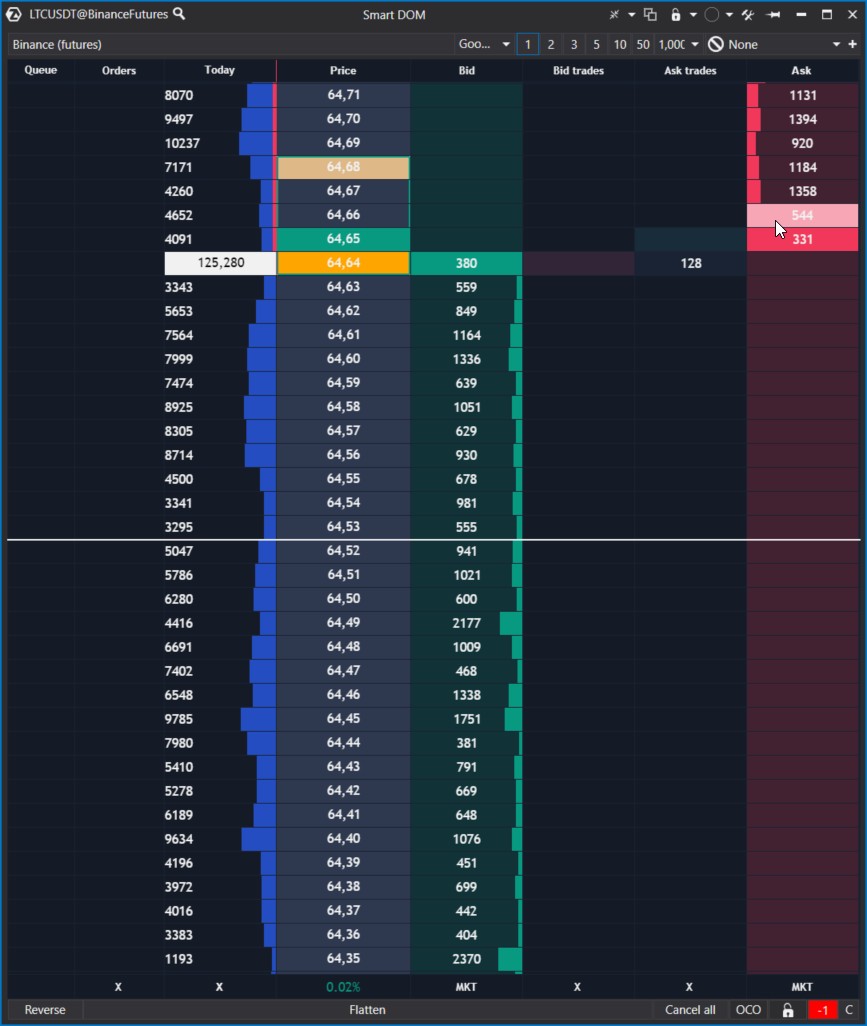
- blue histogram — market profile for the current session;
- Level II data in 2 columns: buy orders (bid) are shown in green, sell orders (ask) are shown in red.
Conclusions
The Depth of Market indicator is a powerful tool for market analysis. It provides information on market depth and order volumes at different price levels. The indicator can be especially valuable for short-term traders who actively respond to price changes. However, to use it effectively, one needs to have a good understanding of the market, trading experience, and also consider the limitations and risks associated with its analysis. To learn how to interpret the market depth indicator, pay attention to the following:- The DOM Levels indicator. It visualizes the change in the order book on the chart. You can focus on the interaction of price and levels with large limit orders.
- The Market Replay simulator which allows you to save time on learning how to trading without risking your capital. When launching the simulator, select the mode with Level II data loading.
- enables you to download tick history from the futures, stocks, and crypto markets so that you can get a detailed picture of the market;
- provides many benefits for traders who want to combine bounce trading with user-friendly cluster charts and useful indicators.
Information in this article cannot be perceived as a call for investing or buying/selling of any asset on the exchange. All situations, discussed in the article, are provided with the purpose of getting acquainted with the functionality and advantages of the ATAS platform.


