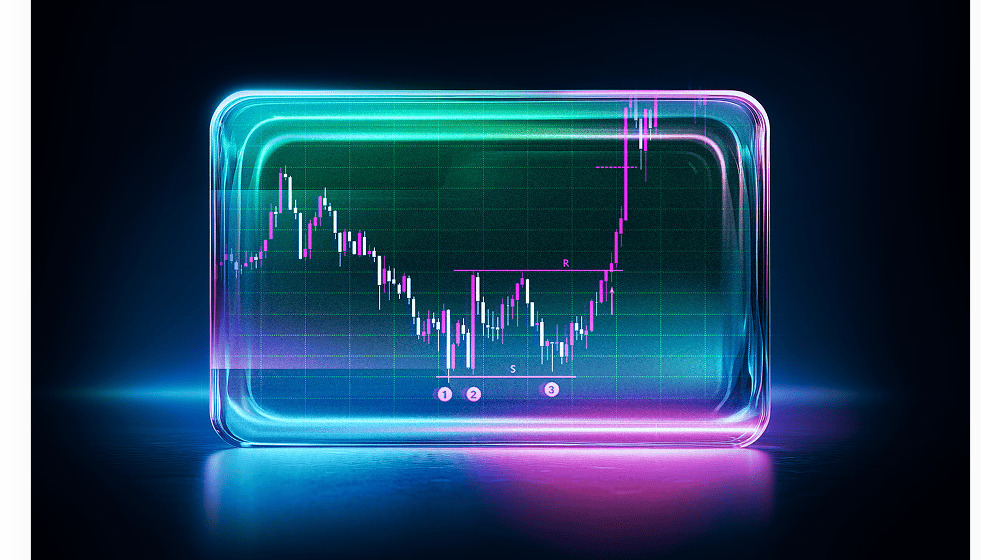
This practical article demonstrates power of the ATAS instruments. To prove their efficiency, we will show you how to find a bitcoin buying setup on the BitMEX cryptocurrency exchange. A simple logic, which is behind the price movement, will be used in the process of the market analysis. It is focused on the buyers and sellers efforts and their trades in their struggle for profit. That is why, the below described methods could be applied in other markets.
To find a setup, we will use:
- footprint, or cluster chart (a chart with white background);
- tape (a chart with black background).
How to set a footprint chart for bitcoin analysis
To analyze the footprint, we will use a 15-minute period. It is not a very small timeframe, where multiple trades are distributed over a big number of candles, and not a very big one, so that we can see details of what is going on. The tape has the Cumulative Trades period, which is based on volume and not on time. This period is one of the multiple possibilities of flexible functionality of the ATAS platform.How to analyze a footprint in the cryptocurrency market
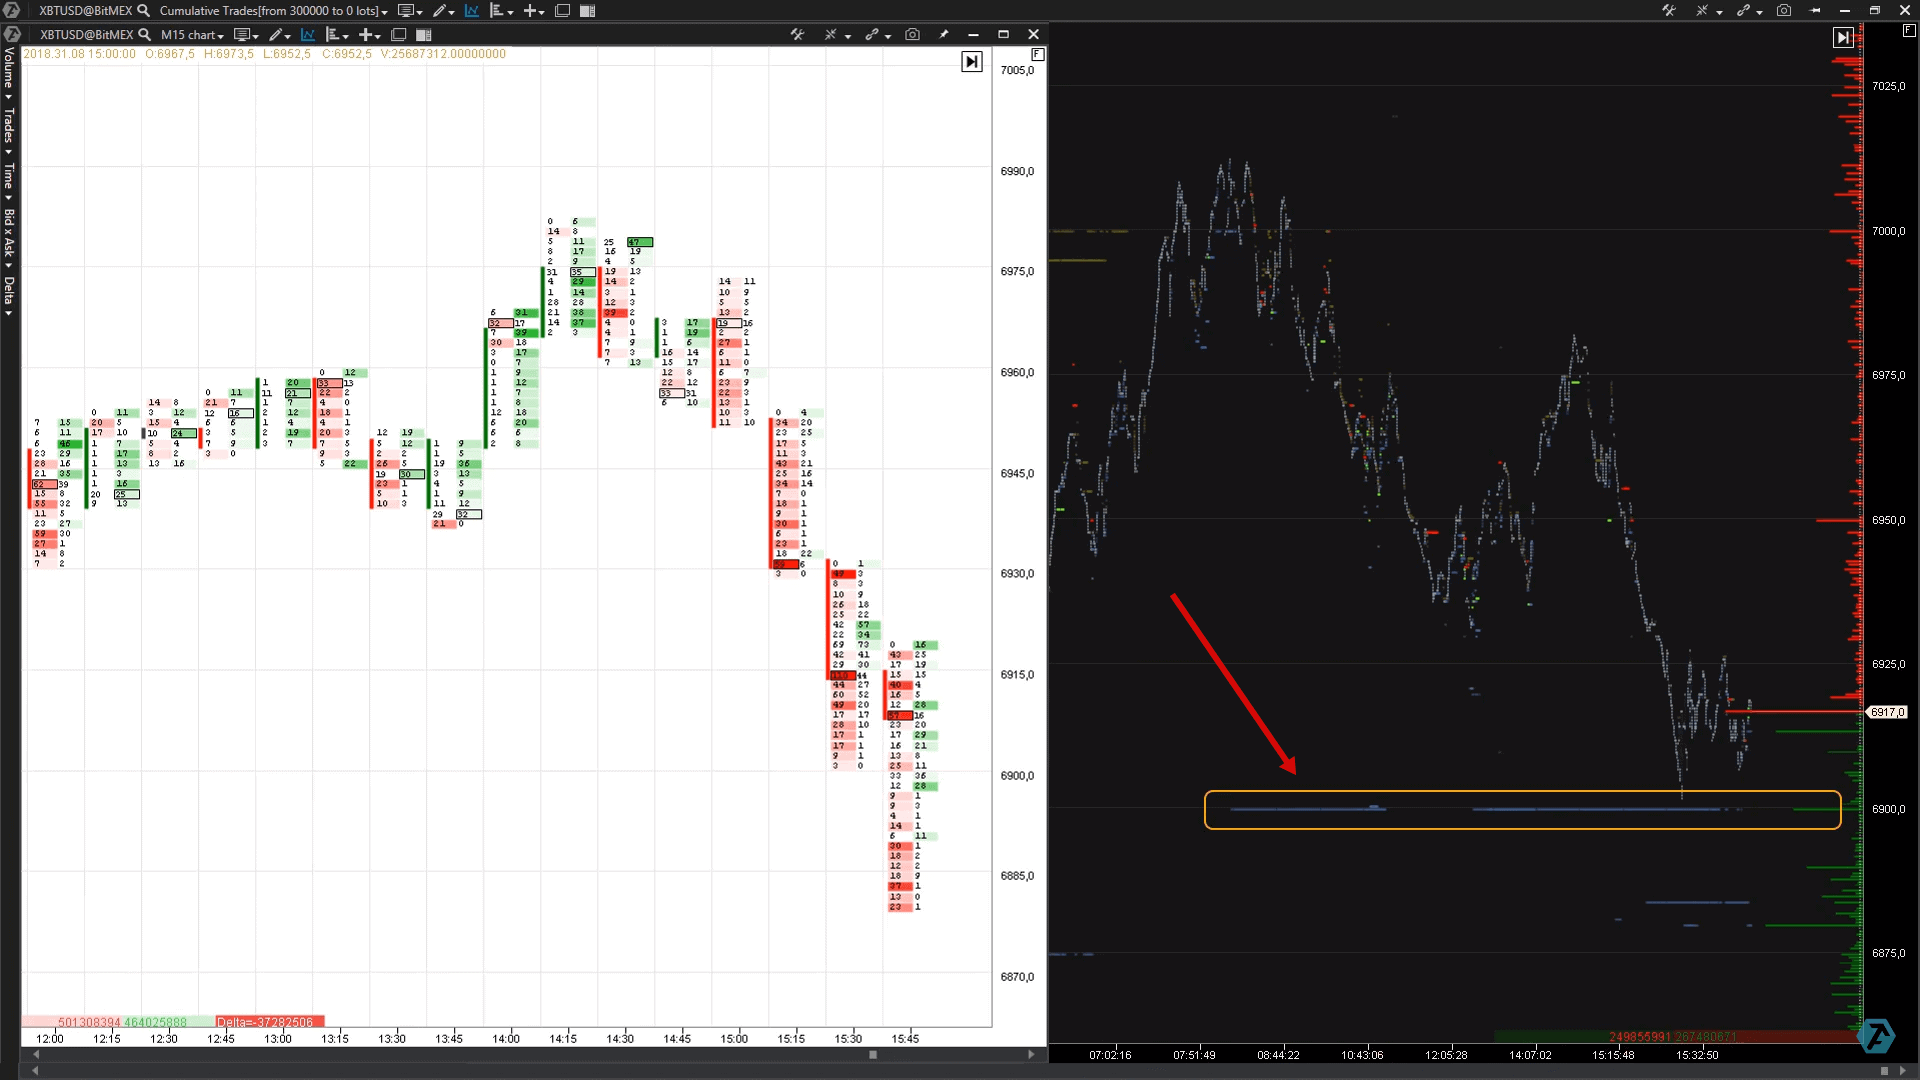
The yellow rectangle shows readings of the DOM Levels Indicator.
That is why it would have been logical to see how initiative passes from the seller’s hands into the buyer’s hands.
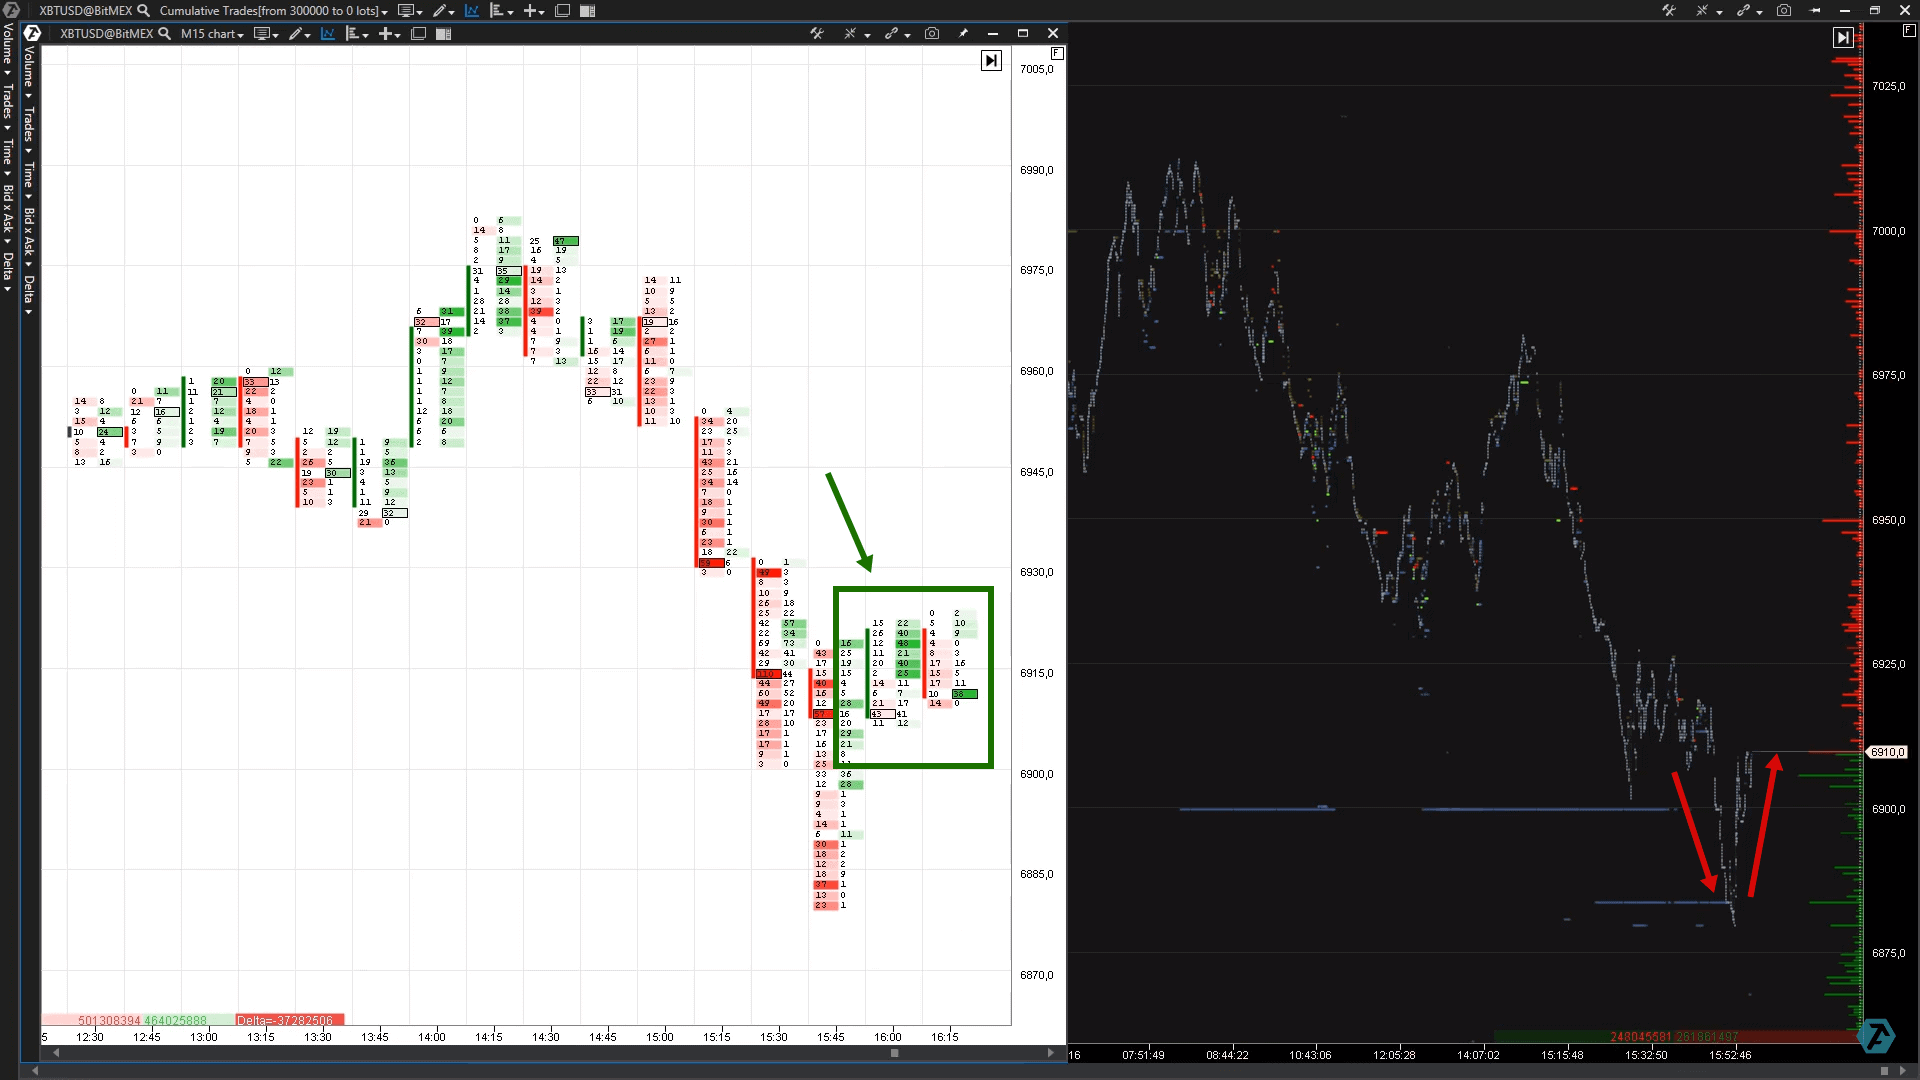
Let us pay attention to the nearest background.
Monitor the price behavior after this breakout on approach to the 6900 level, which is marked with the DOM Levels Indicator. Since limit orders, by virtue of their nature, should stop movement, we want to make sure that the price would not go below that level, at which the sellers wanted to stop it.
How to enter a buying trade
At least, we see signs of a reversal in real time and have a sufficiently low risk for intraday trading.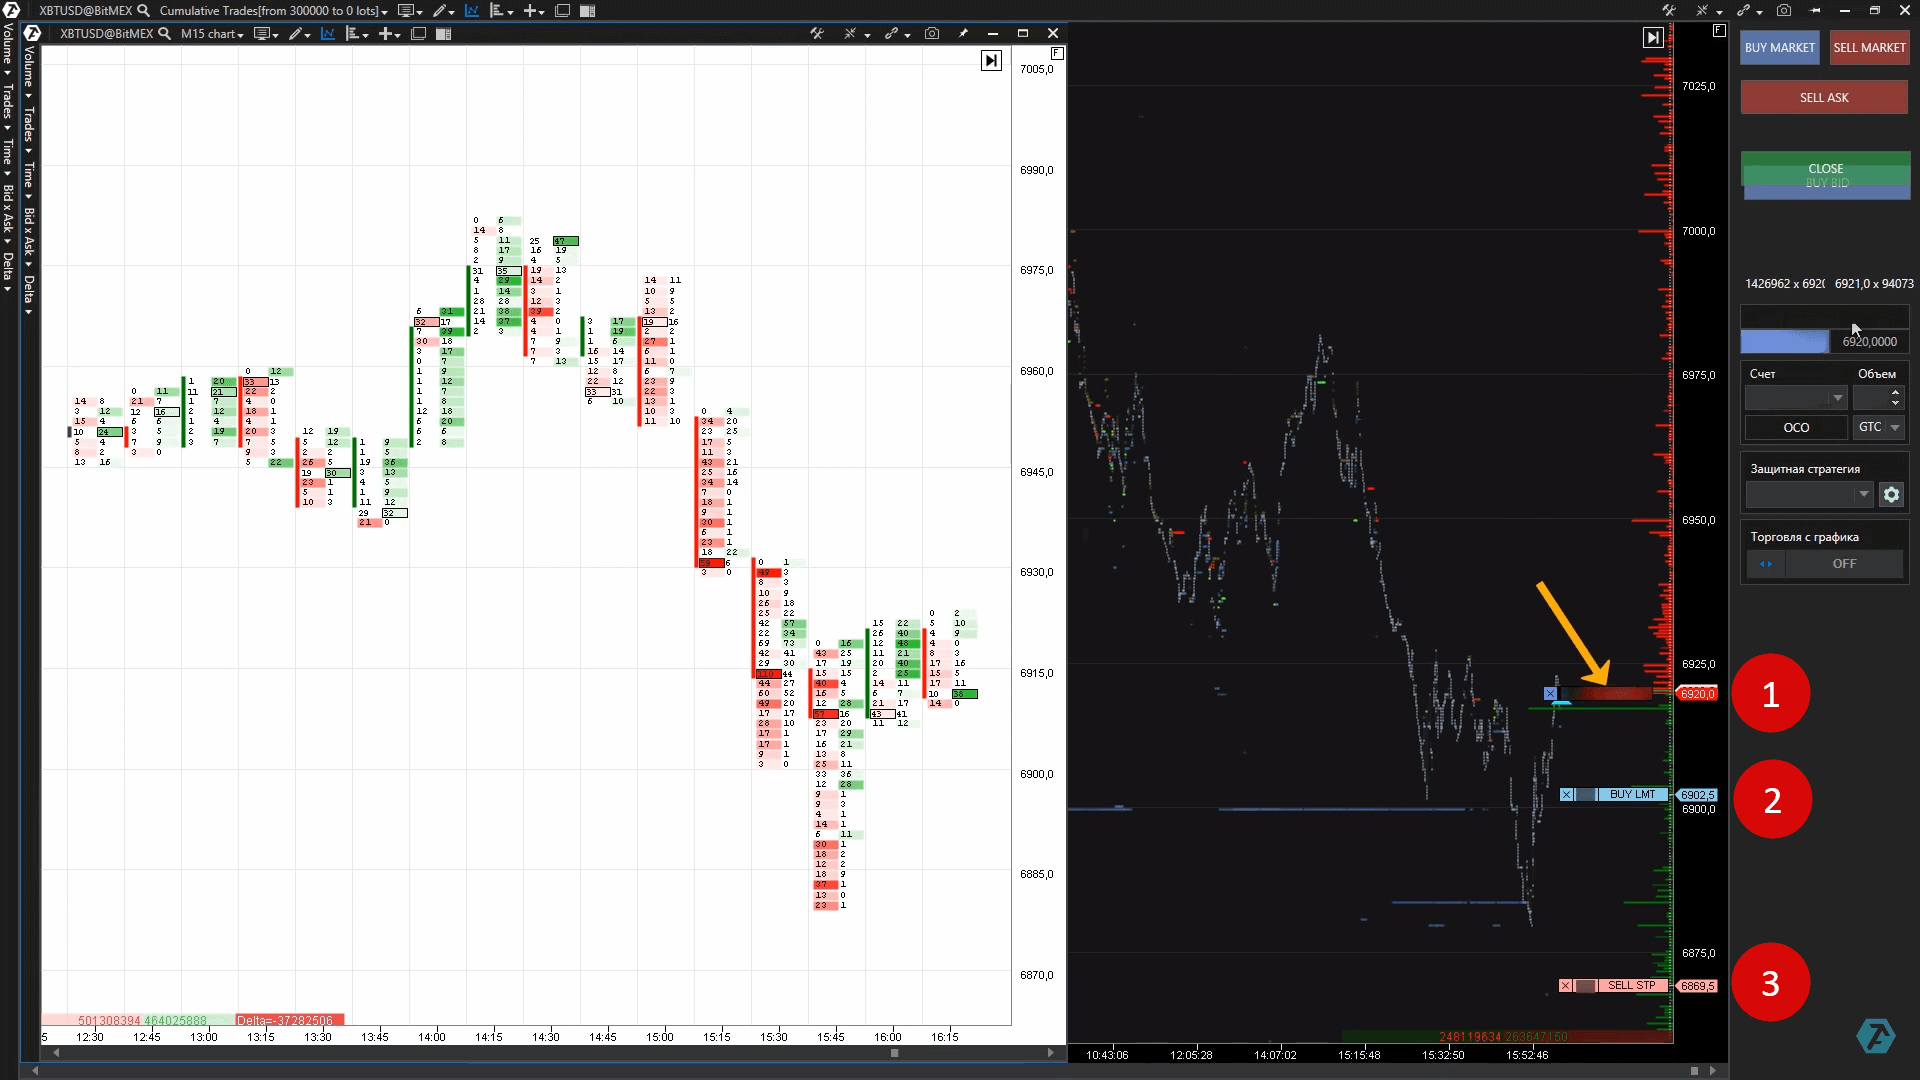
Where to hide a stop? The chart tells us that the DOM Levels support level is under protection, that is why we decide to limit losses behind this level (sell stop order No. 3).
Important note. Our task is not to urge you to buy at each bounce from the DOM Levels order book level or at each its test. Our task is to show how to use the functionality of the ATAS platform efficiently: footprint, order book and tape for search for signs of a price reversal in real time.
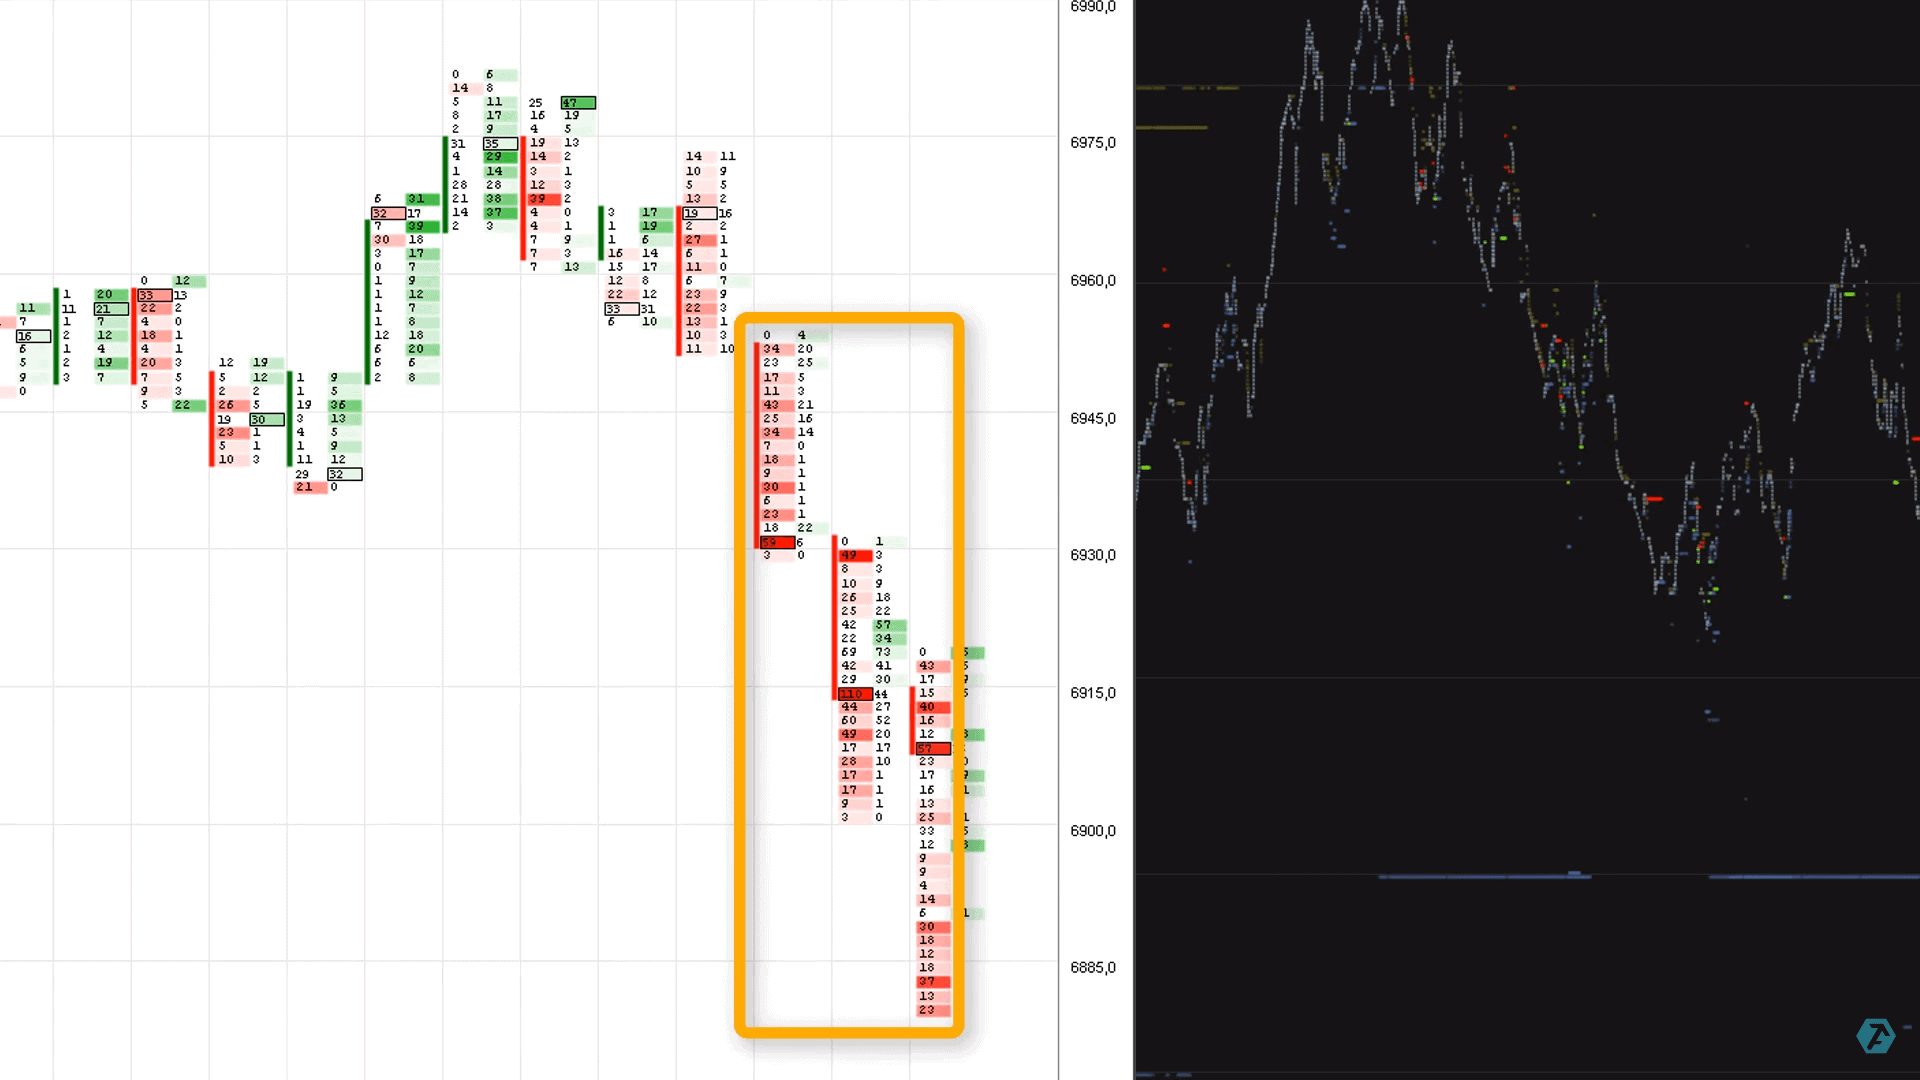
Now we need to understand whether there is a seller in the market who is ready to push the price further down. Look at the footprint.
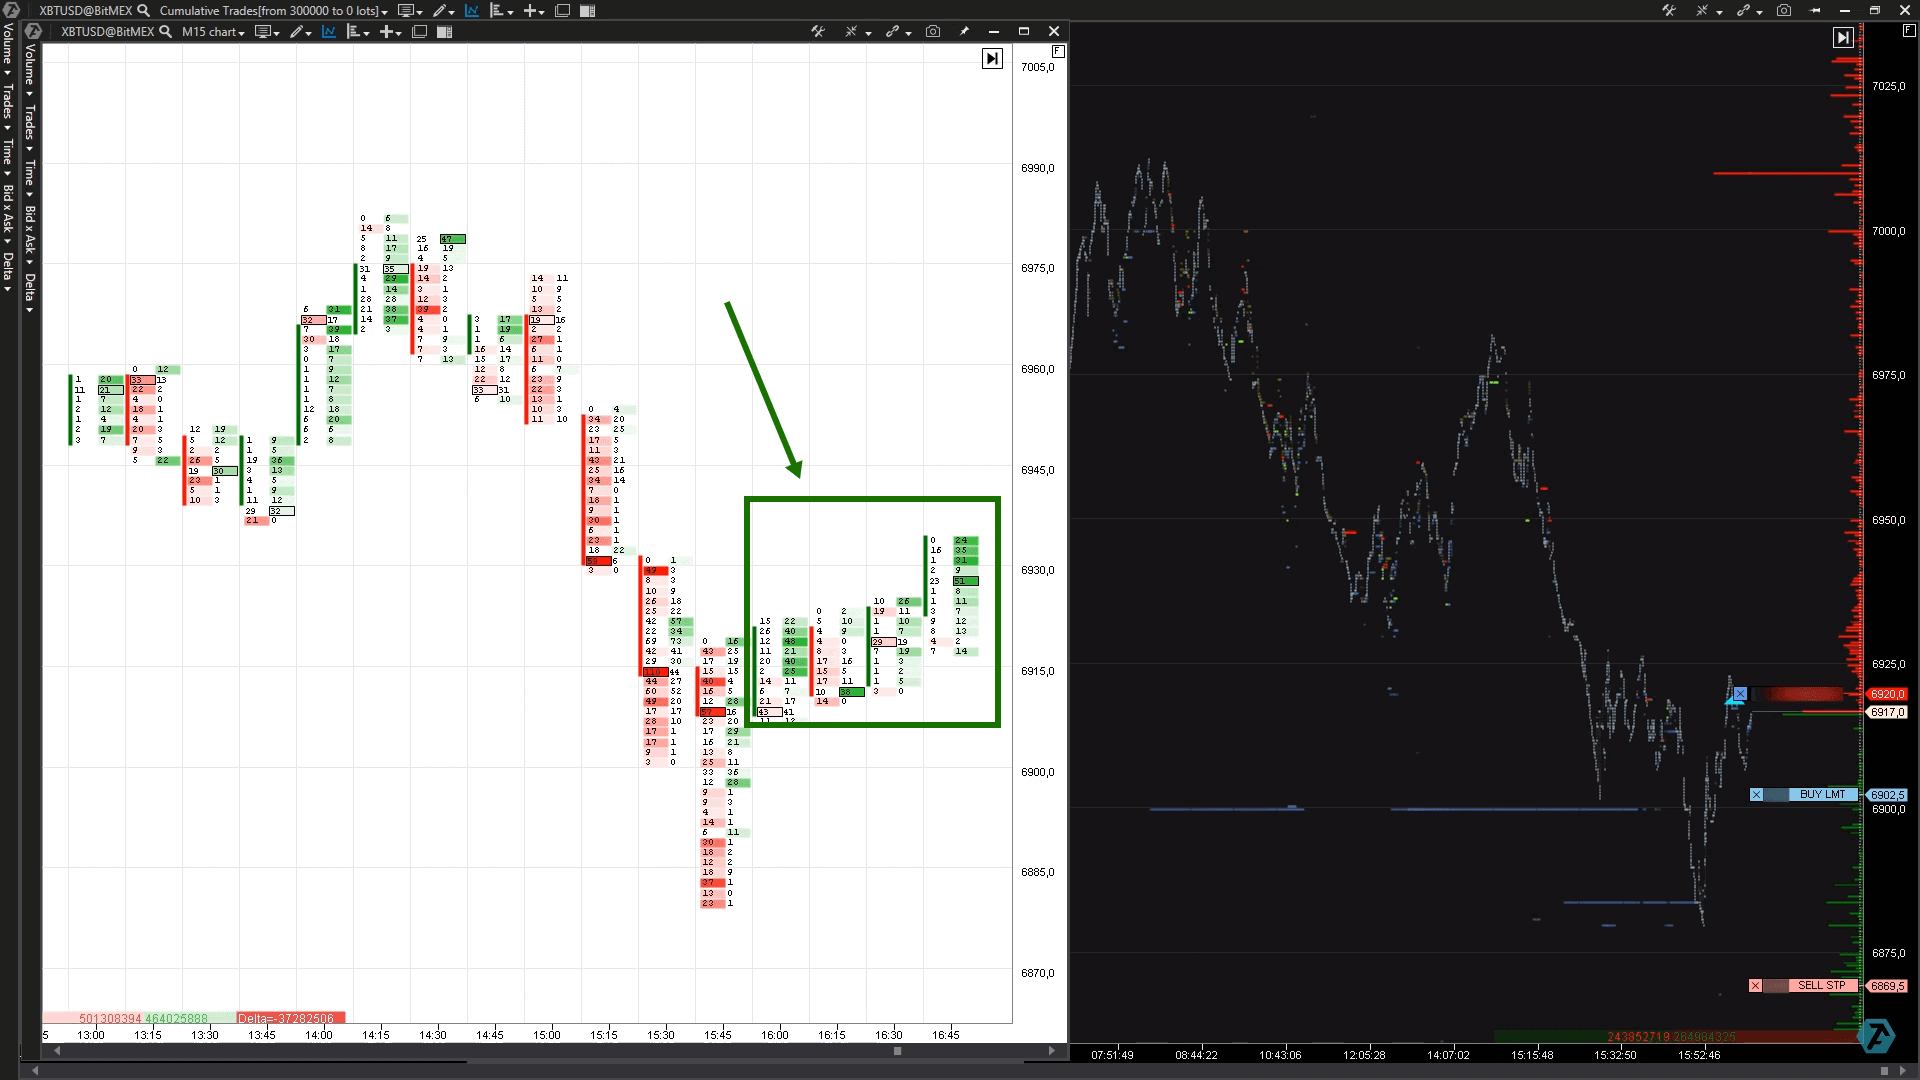
We can see predominance of buyers in the footprint, but, judging by the nature of movement, these could have been mostly sellers that closed their positions making losses (marked with a green rectangle).
Summary
Once again we saw for ourselves that the decisive importance for the search for trades in an intraday trading can be provided by:- powerful functionality of the trading and analytical ATAS platform for monitoring market activity;
- application of basic logic of the auction theory and mechanics of the intraday market and limit orders.
Download ATAS Crypto free of charge and connect to BitMEX and other cryptocurrency exchanges. Get advantage over other traders who trade digital money. How to make money trading cryptocurrencies.