February 15, 2022

How to trade a reverse Head and Shoulders Pattern like a Pro?

Contents

    Share

    Head and Shoulders Pattern in trading. How to trade a reverse pattern like a Pro
    The head and shoulders is a popular pattern in technical analysis and is often used by traders in the forex, cryptocurrencies, stocks, and futures markets. The pattern is quite remarkable because it helps to determine market reversals with relatively high accuracy. In 2002 Thomas Bulkowski analyzed 431 head and shoulders patterns on daily charts of 500 stocks from 1991 to 1996. Only 7% of the head and shoulder patterns he identified were not accompanied by a price decline, the average price decline was 23% and lasted around three months. In this article you will find out:
    • How does the head and shoulders pattern look on a chart?
    • What does it mean?
    • How to trade?
    • Advantages and disadvantages
    • How can you use the head and shoulders pattern to improve your trading?
    This article has a great number of chart examples.

    How does the head and shoulders pattern look on a chart?

    The name “Head and Shoulders” (SHS) represents a visual pattern of three peaks on the chart.
    Голова и Плечи. Фигура на графике
    The head and shoulders pattern consists of three peaks – 1, 2 and 3 on the chart above. Peak number 2 should be the highest, it is the “head”. Peaks 1 and 3 should be lower, they are the “shoulders”.  The line connecting the troughs between peaks 1,2 and 3 is called the “neckline”. This pattern is considered to predict that an upward trend is nearing its end. A breakout of the neckline is a sign to open a short position with an eye to a subsequent price decline. A reverse head and shoulders pattern is a similar formation, only in a mirror image. It consists of 3 troughs, the second one is the lowest.
    Голова и Плечи Перевернутая. Фигура на графике
    A reverse head and shoulders pattern is used to open a long position when a downward trend is about to reverse into an upward trend in the market.

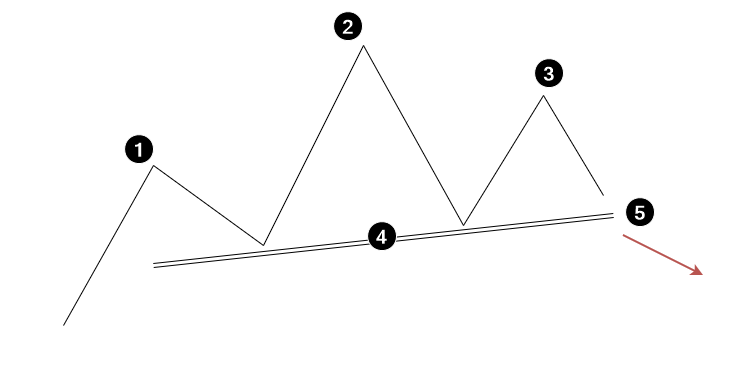
    What does the head and shoulders pattern mean? Examples on a chart.

    Let’s have a look at an example with a real Ethereum price chart, the data was taken from the Bitfinex exchange, timeframe = 4 hours. The ZigZag Pro indicator is added to the chart. This is a useful indicator from the ATAS platform, it automatically splits price data into a sequence of upward and downward waves. The indicator has sensitivity settings and can display statistics for each wave (volume, time, delta and other information).
    Пример фигуры Голова и Плечи.
    The ZigZag Pro indicator helps to see the formation of an important top in May 2021, when the price of Ethereum exceeded 4300. The numbers show:
    Пример фигуры Голова и Плечи Перевернутая.
    The numbers show the reverse:
    When traders discover this setup, they can: 
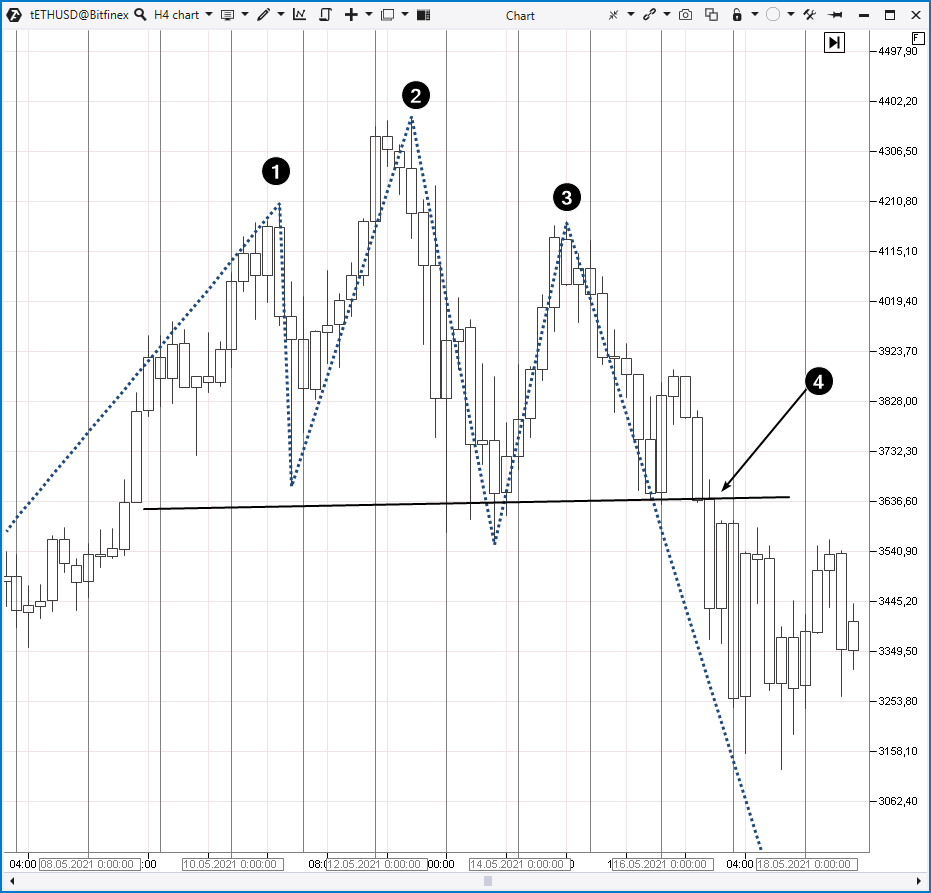
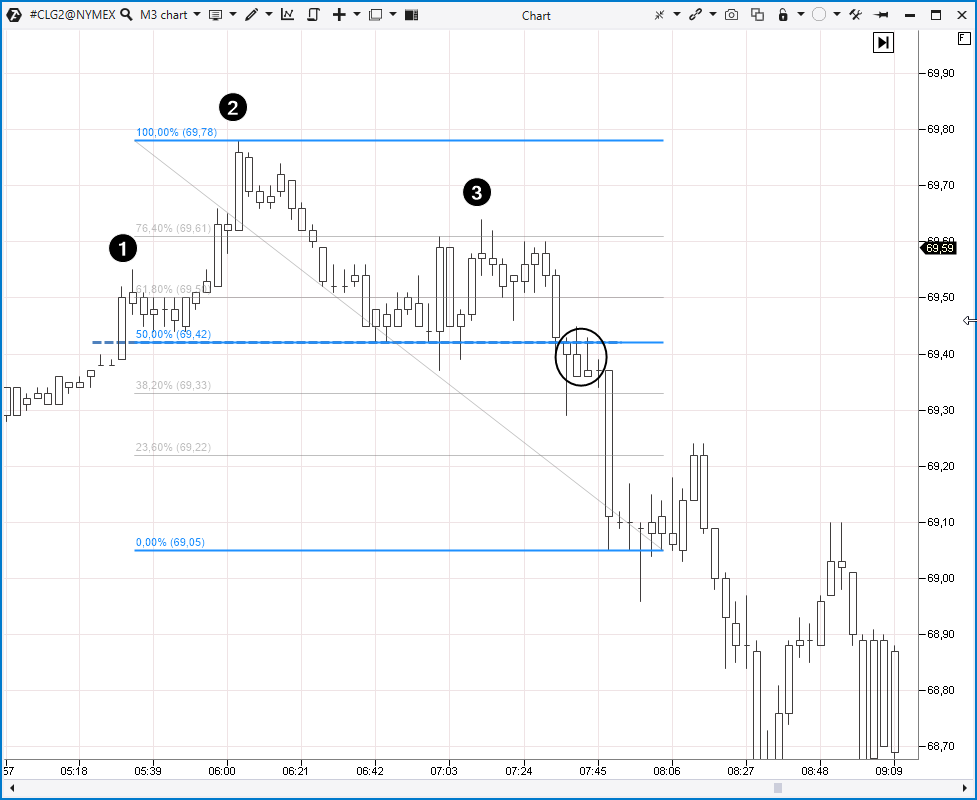
    • open a short position; 
    • set a protective stop loss above top number 3; 
    • set a take profit on the target level, which is laid down from the neckline at a distance equal to the difference between the top number 2 and the neck level. In this example, Target = 69.42-(69.78-69.42) = 69.06.
    To find targets easier use the tools of the ATAS platform: a ruler (Hot Key button F9) and Fibonacci retracements (Hot Key button F8, shown in the example above).

    Advantages and disadvantages of the head and shoulders pattern

    Advantages:
    • Easy to understand. 
    • This pattern can point at levels for setting stop losses and take profits. 
    • It works in any markets, timeframes. 
    • According to various studies, this pattern gives quite accurate reversal signals.
    In addition to Bulkowski’s study, which was mentioned at the beginning of the article, the head and shoulders pattern was analyzed by Gene Savin in 2007. He published his findings in the Journal of Financial Econometrics, and they confirm that the pattern has predictive value, but the author could not provide any theoretical explanation for why the pattern works. Disadvantages of the pattern:
    • It can be subjective. The pattern is difficult to identify because the market consists of many local tops and lows, and ideal patterns rarely appear. Sometimes the head and shoulders become visible when the reversal has already taken place.
    • Not all reversals fit into the shape of the head and shoulders pattern. If the right shoulder slightly exceeds the top of the head (for example, forming an Upthrust), the pattern will look wrong, but the market will not stop showing signs of weakness. To learn how to recognize market reversals, we recommend the article on Accumulations and Distributions.

    How can you use the head and shoulders pattern to improve your trading?

    Tip Number 1. Try using non-standard chart types. For example, Range XV chart below. The numbers 1, 2, 3 show the head and shoulders pattern. Ranges can make it visually easier for you to evaluate local highs and lows.
    Фигура Голова и Плечи.
    Tip Number 2. Use Fibonacci retracements. For example, the 4→5 pullback in the picture above is very close to 50% of the 3→4 move. If you wait for a pullback after the breakout of the neckline, you can reduce your risks (but miss the main movement too).

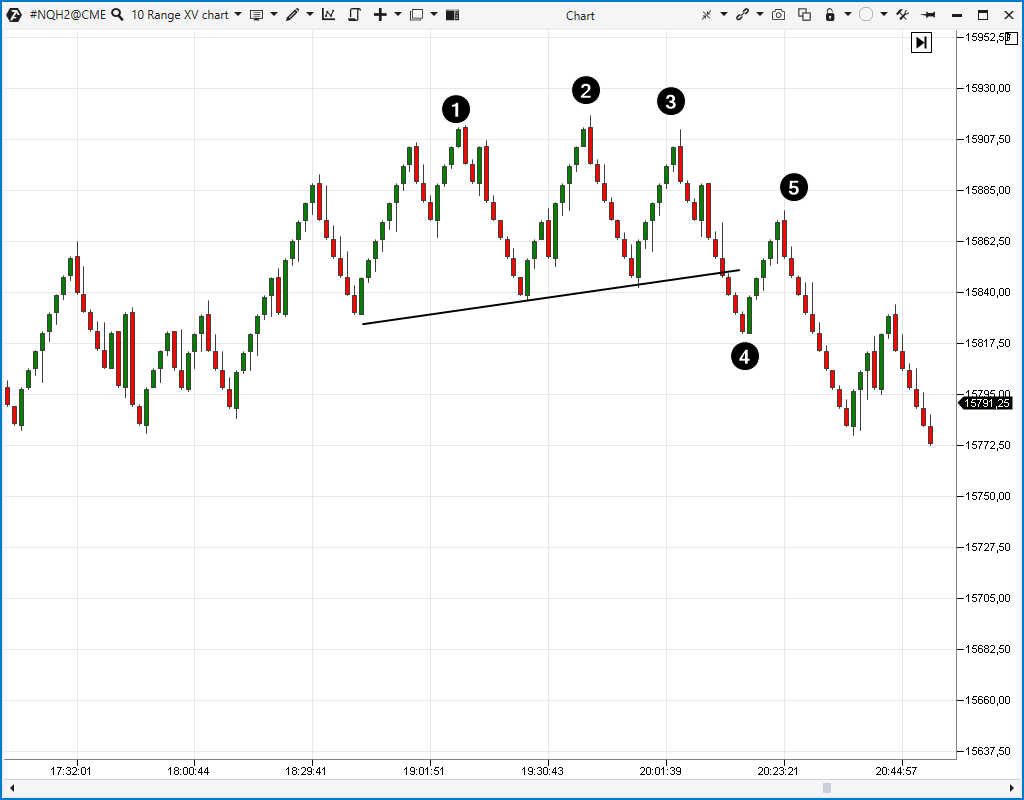
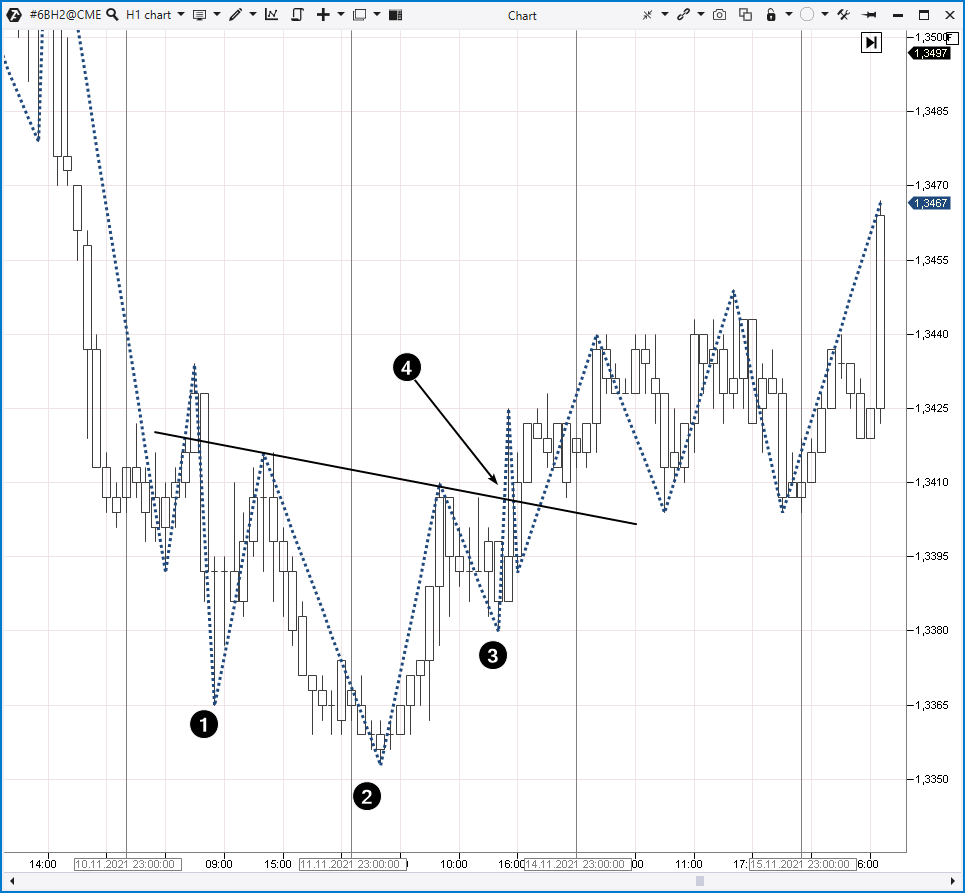
    How to trade the head and shoulders pattern better using the ZigZag indicator?

    The picture below shows the oil futures chart, 4-hour timeframe. The data was taken from the NYMEX exchange (part of the CME Group). The numbers indicate the local peaks and troughs which are found by the ZigZag Pro indicator. The indicator splits price data into a sequence of upward and downward waves. The indicator also shows statistics for each wave. How can it help?
    The numbers 3, 5 and 7 show the formation of the head and shoulders pattern (reverse).  The indicator provides important information which you can use to be sure that the pattern “will work”. Take a look at the statistics on upward waves: 1→2, 3→4, 5→6. Wave 5→6 has the highest numbers in terms of delta, ticks and volume. This is the “strongest” wave, indicating the appearance of demand when the pattern ends. Now take a look at the statistics for downward waves: 2→3, 4→5, 6→7. Wave 6→7 has the lowest volume and duration in ticks. This means that the selling pressure is decreasing. The decrease of sales and the appearance of demand indicate a change in the nature of the market. If a breakout of the neckline happens around 68.40, you will have more arguments for buying. To find out more about wave power read the following articles:

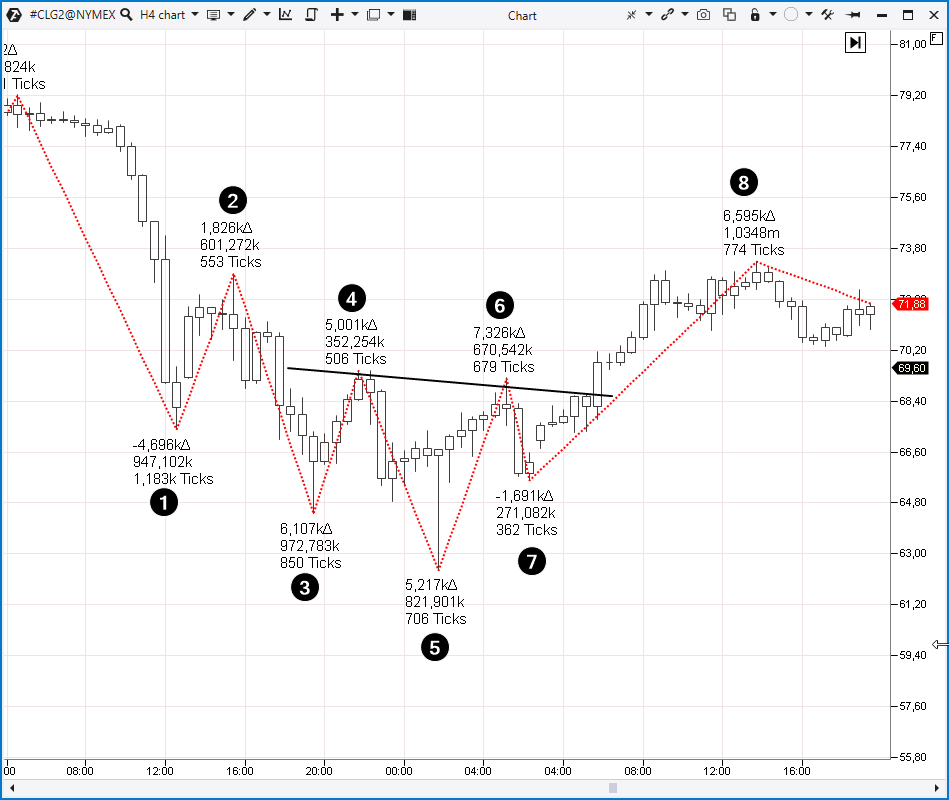
    How to trade the head and shoulders pattern better using cluster charts and profiles?

    The picture below shows a futures chart for the DAX stock index, a daily timeframe. The data was taken from the EUREX exchange. The numbers 1-2-3 indicate the local troughs which form the head and shoulders pattern. The volume histogram clusters allow you to “look inside” the candles and help you understand what is going on.
    What is noteworthy is what happened at the second low (the reverse head). The main trading activity took place in the range of 15000-15100. However, the candle closed above this range, suggesting that the buyers would win. The next day, the futures traded above 15000-15100, which confirmed the existing support. Number 3 indicates the reverse right shoulder. Here we can see the same sign – the candle closes above the bulge on the profile, which was formed on the lower shadow (test 15100). This confirms that the bulls are holding the level. Therefore, having noticed the breakout of the neckline (the buyers’ efforts on the breakout of the line are marked with an arrow) on the 6th, one could more firmly enter a long position or build up existing buys. Let’s have a look at another example from the same market to consolidate the material.

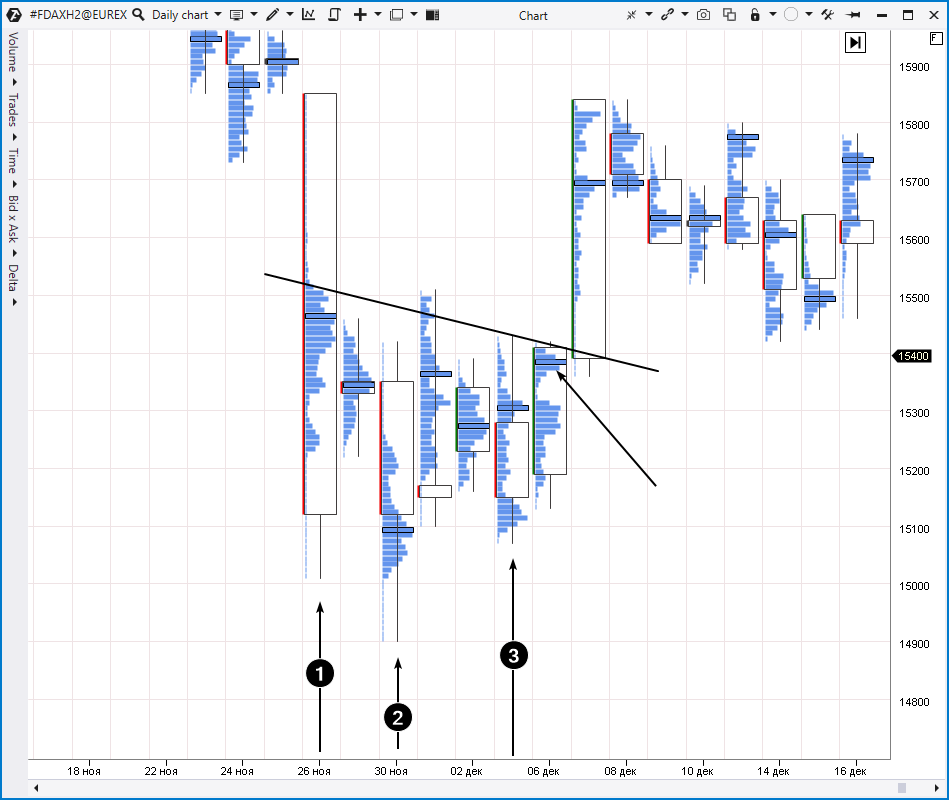
    How to start trading?

    We hope that the examples with the head and shoulders chart pattern presented in the article will be useful for you. If you want to explore the pattern on the charts and see the benefits of volume analysis, download the ATAS platform.
    • You can register and download it for free. You do not need to give your bank card details. You can continue using the program even after the 14-day trial period.
    • You will be able to analyze the head and shoulders pattern in the stock, futures and crypto markets.
    • There is a demo account built into the ATAS platform, so you can practice trading without risking your real capital.
     The platform offers many benefits for traders who want to trade with easy-to-use cluster charts and useful indicators.

    Conclusions

    We hope that the examples with the head and shoulders chart pattern presented in the article will be useful for you. If you want to explore the pattern on the charts and see the benefits of volume analysis, download the ATAS platform.
    • You can register and download it for free. You do not need to give your bank card details. You can continue using the program even after the 14-day trial period.
    • You will be able to analyze the head and shoulders pattern in the stock, futures and crypto markets.
    • There is a demo account built into the ATAS platform, so you can practice trading without risking your real capital.
     The platform offers many benefits for traders who want to trade with easy-to-use cluster charts and useful indicators.

    Information in this article cannot be perceived as a call for investing or buying/selling of any asset on the exchange. All situations, discussed in the article, are provided with the purpose of getting acquainted with the functionality and advantages of the ATAS platform.

    Examine the causes of price fluctuations in the market

    Start using ATAS right now and capitalize.

    Get started for free

    This site is registered on wpml.org as a development site. Switch to a production site key to remove this banner.