In this article, we prepared reviews of some trading strategies, analyzed their components and also considered one of the strategies offered by a user of our platform.
Read today:
- What a trading strategy is;
- What strategies exist;
- We form our own strategy;
- Strategy example on the basis of market marginality.
What a trading strategy is.
Trading strategy is a complete trader’s guide. The goal of the strategy is to make profit on the exchange.As a rule, the following components form the basis of a trading strategy:
- rules of the market analysis (fundamental and/or technical analysis) and search for favourable opportunities;
- rules of entry into a position in case of a favourable forecast;
- rules of holding a position;
- rules of exiting from a position;
- risk management;
- rules of correction of mistakes.
Any trading strategy should correspond with personal qualities and discipline of a trader. How he analyzes information from the market and assesses its nature and how he creates a forecast on the basis of actual data. Whether he is capable of holding profit and cutting losses. A readymade trading strategy looks like a clear action plan, which could be applied to both manual and automatic trading.
What trading strategies exist.
There is a big number of trading strategies. Google finds 563 million strategies in the English language Internet segment.There are universal strategies. There are specialized ones – individual strategies for the markets of bonds, stocks, currency pairs, futures, indices and so on.
By time of position holding, the trading strategies are divided into:
- short-term;
- middle-term;
- long-term.
In general, strategies could be divided into:
– trend;
– counter trend;
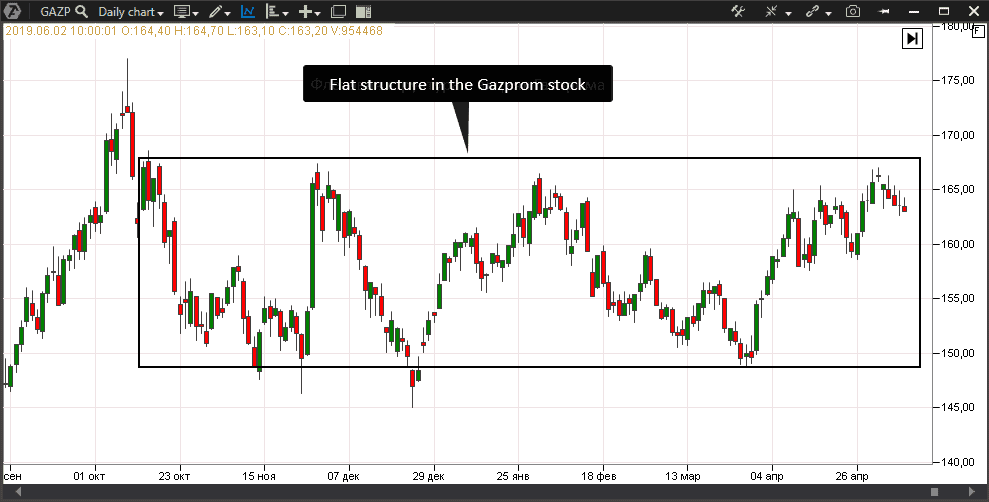
– flat.
There is an assumption in the basis of any trend strategy that the price has more chances to continue focused movement – up or down – than to change it to the opposite one. Trend is a focused price movement, taking into account which the trading is conducted. The ascending trend opens, mostly, longs, while the descending – shorts.
It is believed that the ascending trend continues to the point, while each new price low and high are bigger than previous values.
Unlike trend strategies, counter trend ones usually use more indicators, which tell us about overbuying or overselling a financial asset.
We form an optimum strategy.
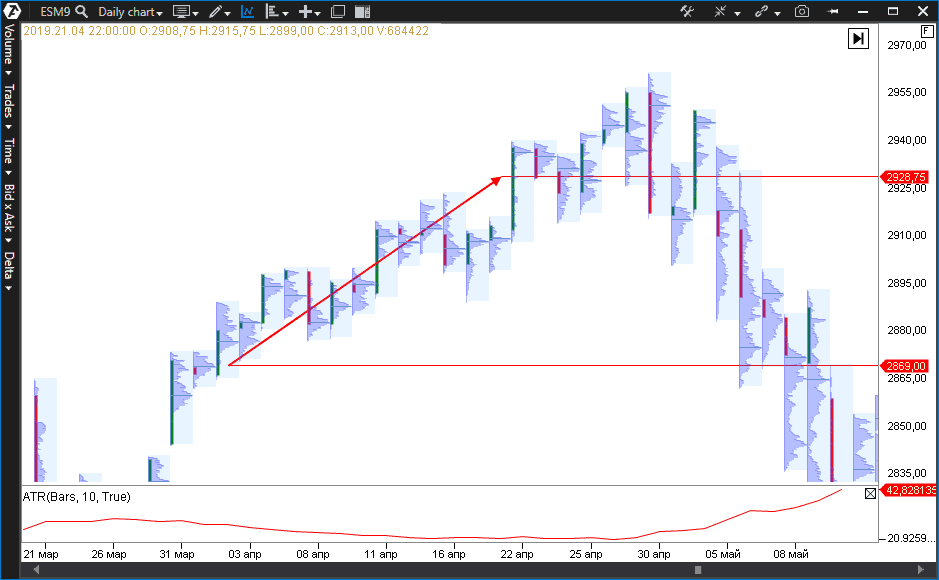
Let’s try to form a trading strategy along the trend, which would send an entry signal when exiting a flat. The functionality of the trading and analytical ATAS platform will help us to do it.We will use the S&P American stock index futures chart with 1-hour period. We load the Market Profiles indicator into the chart. The result would look as follows:

- The flat was formed during 5 days and the price exits it in the upward direction.
- After a breakout, we observe not just increase of the price highs but also a shift of levels with a maximum concentration of volumes. The market profile tells us about it. Increase of levels with the maximum volume confirms the market interest in the price growth. We have a probable beginning of the ascending trend.
In order to enter a long position, it is necessary to calculate an optimum entry point, a profit registration point and a point where we would post a stop loss. These calculations would require the ATR indicator, which shows an average true range.
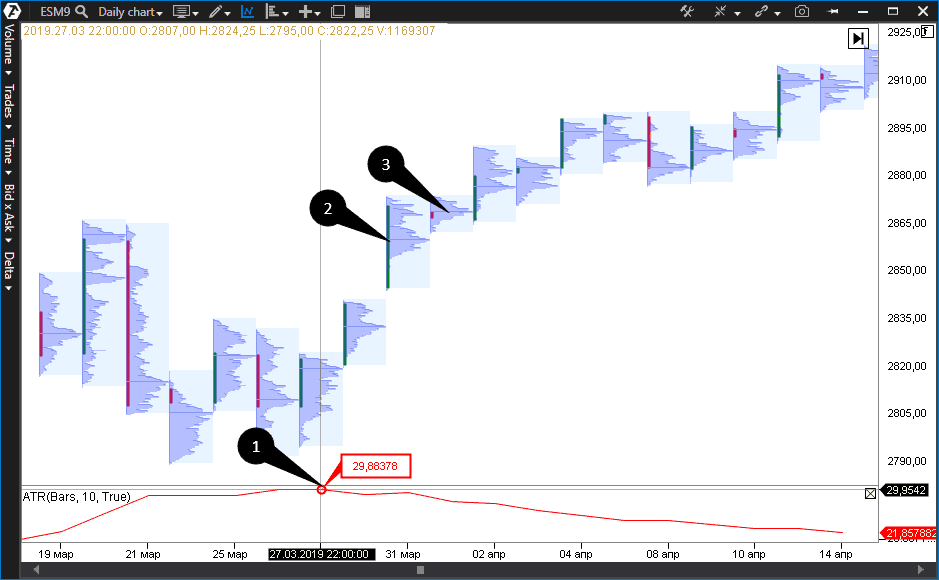
However, the price didn’t activate our order, that is why we shift the entry point to the level of the maximum volume of the next day (point 3).
Activation of our order takes place during the next trading session. It’s high time we posted a stop loss below the ATR level from the entry point. We calculate the take profit as ATR*2=59.76.
The picture below shows the entry point and profit registration point in accordance with the considered strategy:
One more example of trading against a trend.
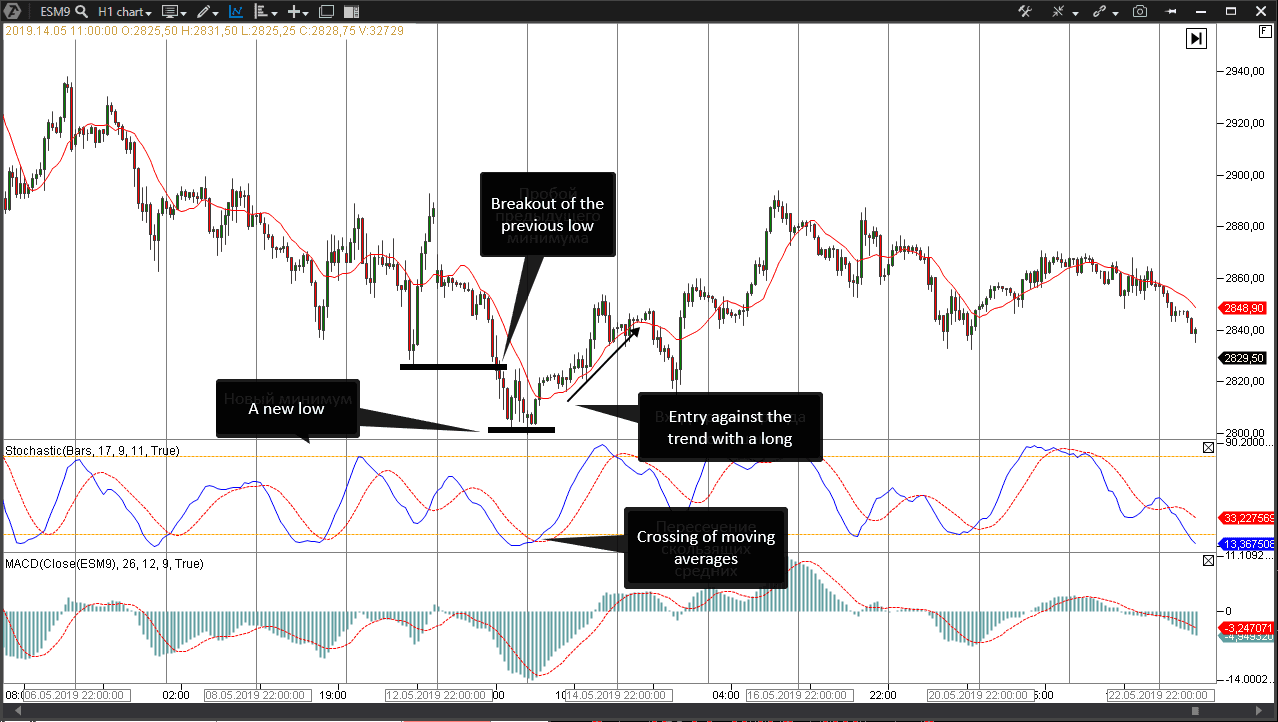
It is vitally important to be able to identify price reversal points when working in accordance with counter trend strategies. Classical indicators will always be late in this case. That is why it is important to look for methods to improve the quality of entry. Volume and Open Interest indicators will help us to do it.Our next example is a 5-minute Si futures contract price chart.
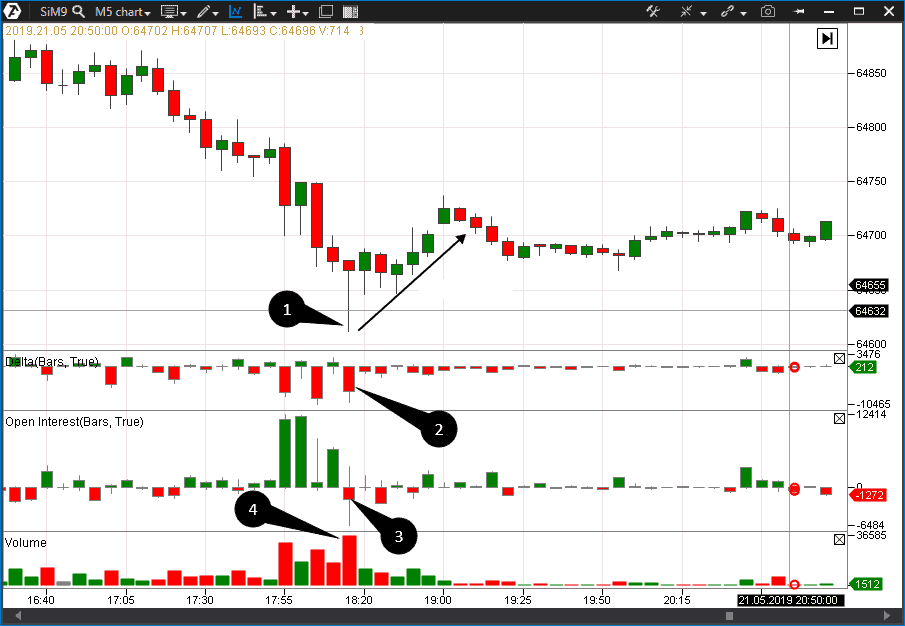
Volume analysis indicators predetermined beginning of the correction movement in the considered case. Let’s discuss this mechanics, which would bring us to understanding the situation that happened.
Note the candle, which closed with a long bottom shadow on a splash of the maximum volume. The Open Interest indicator, first, fell to the mark of -6484, but the open interest again increased by the moment of the candle closing. This tells us that there was a wave of sells, on which a part of long positions left the market. A new buy wave took place immediately and this wave was accompanied with increase of the open interest.
Perhaps, professional market participants (who know the true inner value of the traded instrument) decided that the contract was resold and provided a short-term support in order to make money on the extremely low price.
Stop loss should be maximally short in such strategies. For example, it could be posted behind that low, from which the entry was made, and take profit should be oriented at the closest level with a maximum volume. Such a strategy makes it expedient to shift the stop loss towards the breakeven zone as soon as the price starts to move in your direction.
Buying these oversold zones is very risky, since it is directed against the main trend. You can compare this strategy with an effort to ward off the avalanche, which sweeps away everything on its way. Nevertheless, the risk could be justified.
Here is an example of opening a position against a trend and its consequences.
Trading strategy on the basis of market marginality.
There is an opinion among traders that if a share increased or decreased in price by 25-35%, the correction phase starts. These figures were not taken out of the air. They are defined values, which form boundaries of risk parameters for margin positions. Boundaries of risk parameters could be different for each share, but they lie, as a rule, within the specified range. If the price leaves the boundaries of risk parameters, brokers forcibly close margin positions.What do we mean? Margin stock trading envisages availability of a counter agent, who loans his stock to a client in long or short. As a rule, a broker, who has the right to forcibly close a margin position (margin call) of a client when the price moves in the opposite direction, plays this role.
A great majority of minor clients act synchronously in real trading. Let’s assume they buy stock after a piece of good news was broadcast. Besides, they use trading with leverage. Thus, zones are formed where brokers would close positions of such traders by a margin call in the area of 25-35% and lower from the point of good news broadcast.
It is not possible to get exact information in which market areas the so-called margin volume is formed, however, we can analyze the actions of the stock market and levels with a maximum volume in order to understand how much the strategy is justified.
Let’s show it using the Apple stock example:
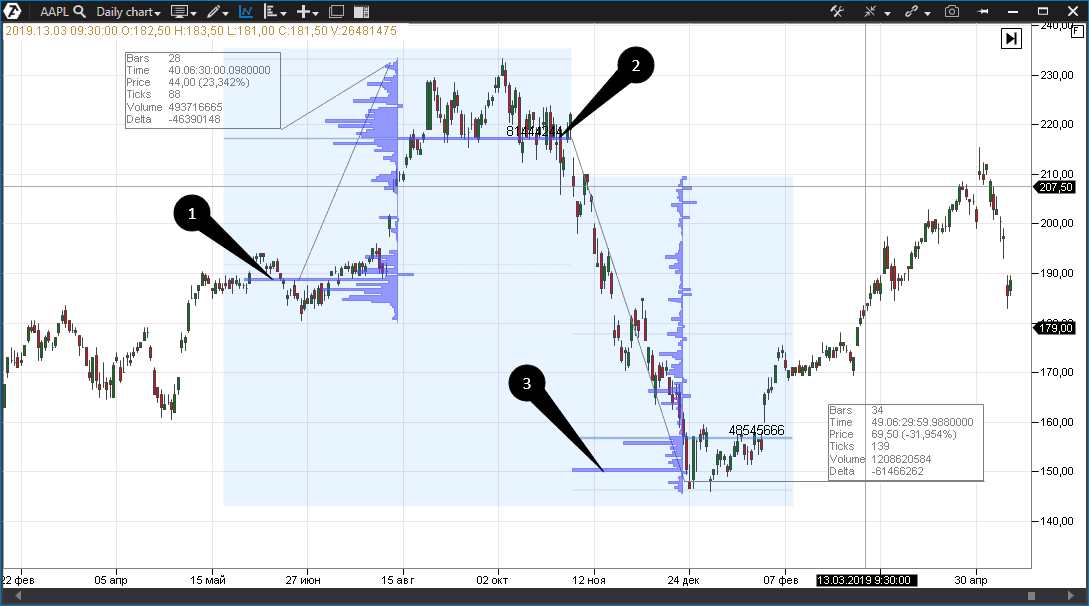
We note the appearance of an extreme volume of buys in point 2, after which the stock took a beating of 31%.
We register appearance of a maximum volume of sells in point 3 again, after which stock goes up by the same 35%.
Assumption about levels where the maximum volume accumulates with margin positions allows planning a bounce and act correspondingly.
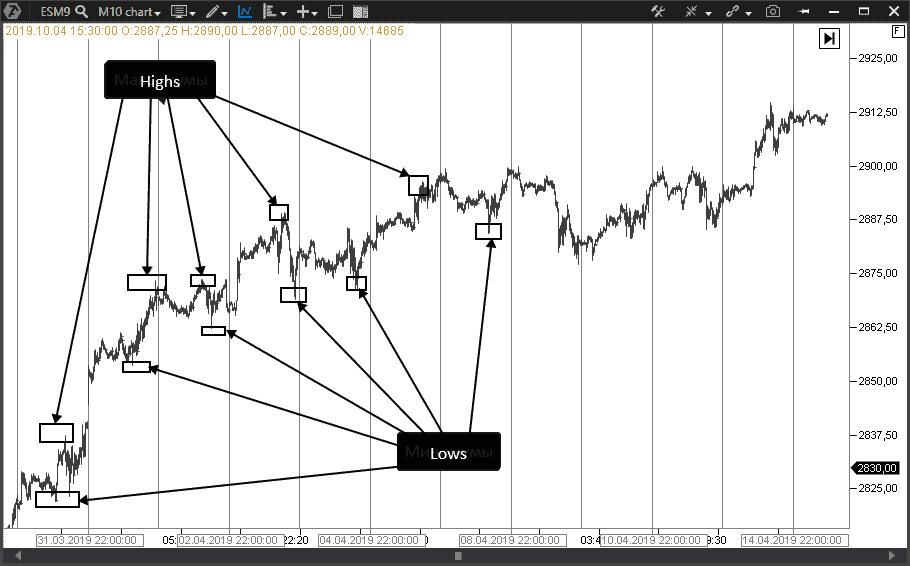
In order to prove our point, let’s consider some more similar cases. Thus, the Gazprom stock overcame a long resistance level at RUB 167 price due to a positive fundamental component and went up to RUB 205 per share.
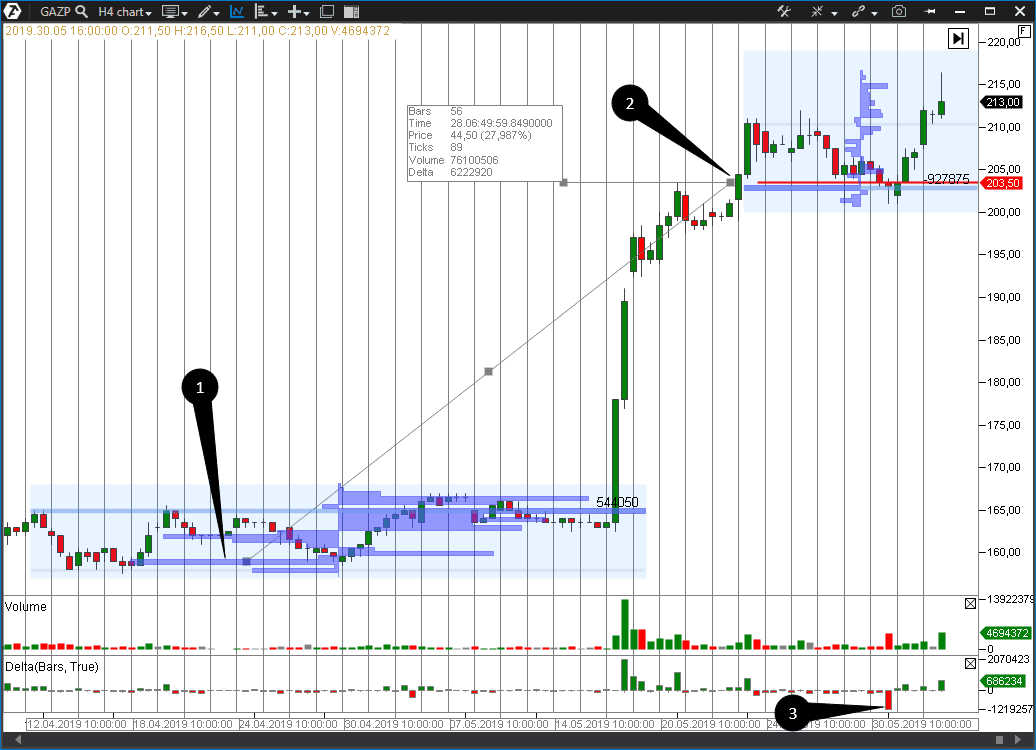
Let’s assume that a big number of these sells is marginal, that is short positions were opened by means of brokers’ funds. Then we can calculate the price, at which such positions will be forcibly closed. According to the Moscow Exchange data, values of boundaries of risk parameters for the Gazprom stock were set in the amount of 17.21 and 28%. A simple calculation (159+28%=203.52) shows that the last boundary for such short positions is at the level of RUB 203.52. Then we note how the price breaks the level of 203.5 in point 2 and see that, further on, the 203.5 level starts to be a serious support.
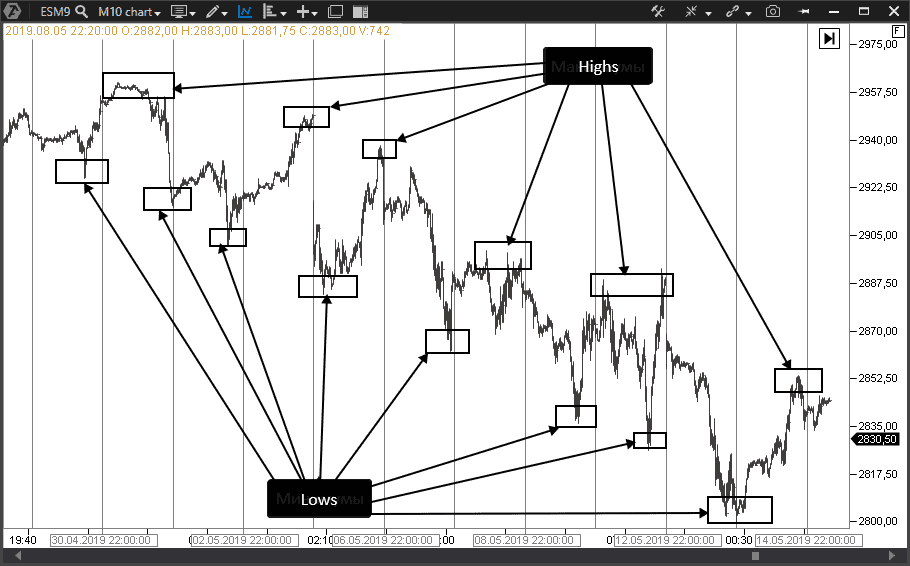
But this is not all! We marked appearance of major sells with point 3, where the volume delta was minus 1,219,257 shares at the price of RUB 203. We apply the system of calculation of boundaries of risk parameters again (203+28%) and get the value of 259.84.
Now, if the price tests the level of RUB 203 again, we would have arguments to consider buying stock with holding it up to RUB 259.84. Stop loss should be posted in the amount of one third of 28%, that is at the level of 9.3% from the entry point, which corresponds to the level of RUB 184.12.
Another example is the Sberbank stock:
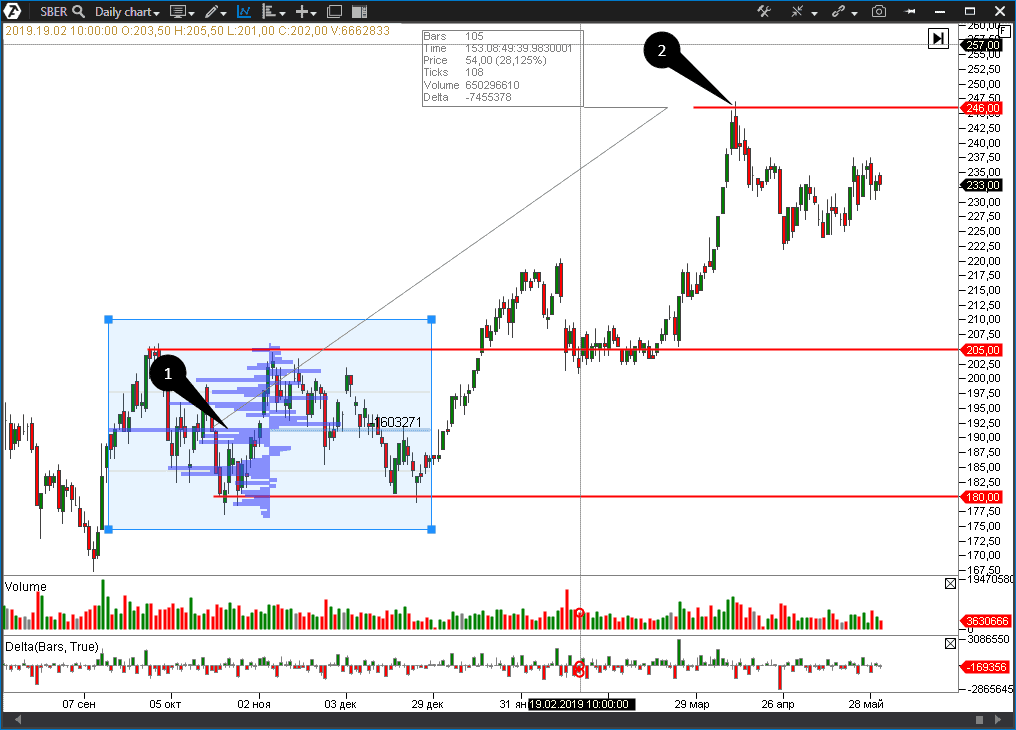
We note that the price tests this level in point 2, which, in accordance with the proposed trading system, should play the role of the position registration point. Stop loss of 9.3% was 191.5-9.3%=173.69 in this case. It stayed untouchable by the price that was above RUB 177 per share.
Following the logic of the current discussion, we should expect that the share would finally break the level of RUB 246, after which a new range, where we could start looking for a new entry point, would start to form.
Do you want to make sure personally that the described strategy is efficient? Download ATAS. More than 500 stocks of American companies from NYSE and Nasdaq markets are presented in the platform. Try to find levels, where brokers forcibly close positions of regular traders.
Summary.
Before you start using a trading strategy, you need to have facts that confirm its profitability. If there are 563 million of strategies in public domain, it does not mean that all of them will make money. Most likely, quite on the opposite. Because it is difficult to imagine that someone would be willing to share his personal Grail.ATAS will help you:
- to make sure that a trading strategy is efficient;
- to follow its signals in a convenient way.
Download the free ATAS version right now!