
Disclaimer: This article aims to demonstrate the capabilities of the ATAS platform, the following descriptions of the ATAS Smart Tape patterns reflect the author’s perspective. The interpretation is based on personal experience and skills. The presented information may appear subjective and should not be considered as the only correct or exhaustive perspective.
What Is the Smart Tape?
The Smart Tape feature in the ATAS platform is a separate module designed for working with the flow of trades (referred to as Time and Sales). One of the main advantages of the ATAS Smart Tape is the aggregation of fragmented trades. To open the Smart Tape, click the corresponding button (1) or use the context menu (2), as shown in the screenshot below.
- Time – the time when the trade was made.
- Price – the price of the trade.
- +/- Direction – the price reaction (UpTick & DownTick) to the prices of the previous trades.
- Avg – the average volume of the print in the trade.
How to Set up the Historical View Mode
To identify a reversal pattern, you need to open the price chart, activate the linked Smart Tape module from the context menu, and then switch to the historical view mode.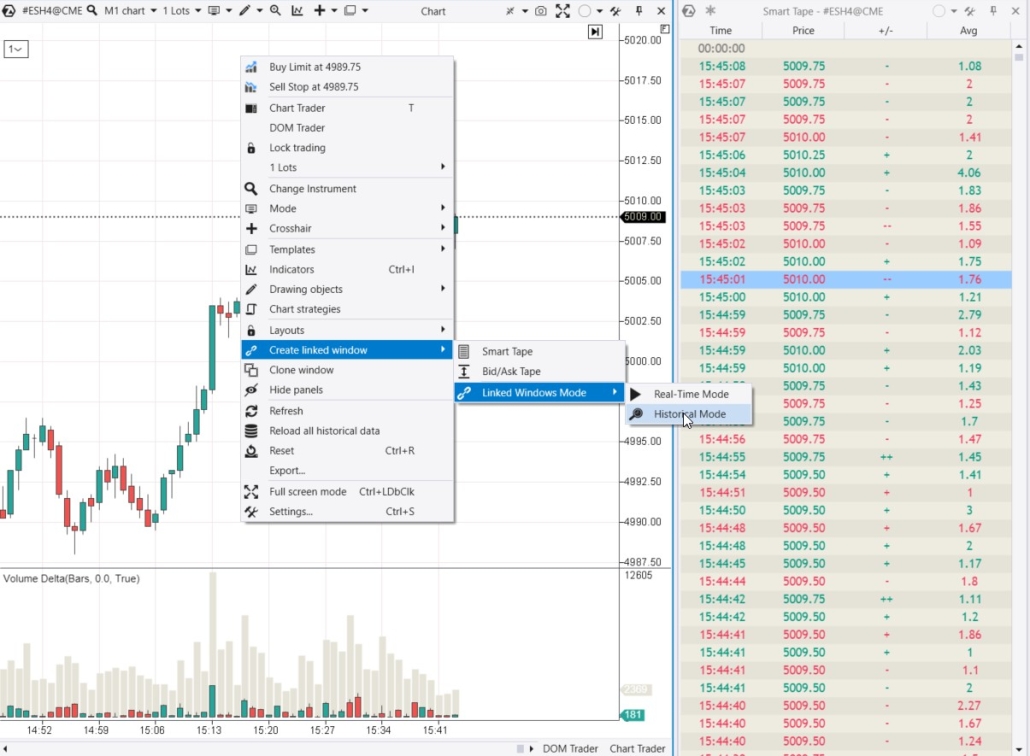
In the historical mode of the Smart Tape, you can select any area on the chart with your mouse (it will be highlighted in blue), and then the Smart Tape will display all the data only for that area.
How to Identify a Reversal Pattern. Examples
A reversal pattern on the Smart Tape consists of 2 components:- a visually identifiable triangle in the uptick and downtick columns that presumably signifies the culmination of the preceding movement.
- confirming prints that may indicate the beginning of a movement in the opposite direction.
Example 1. Stock Market Futures
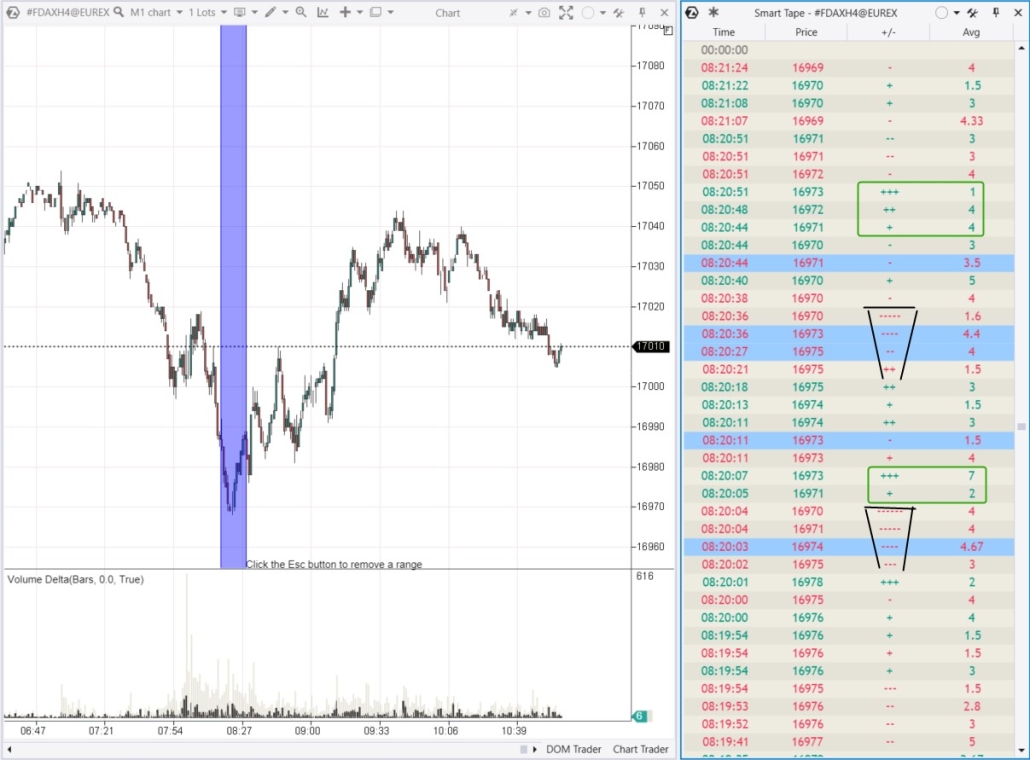
In this example, we will use the ES futures chart. The blue area highlights a bearish reversal. What does the Smart Tape tape show?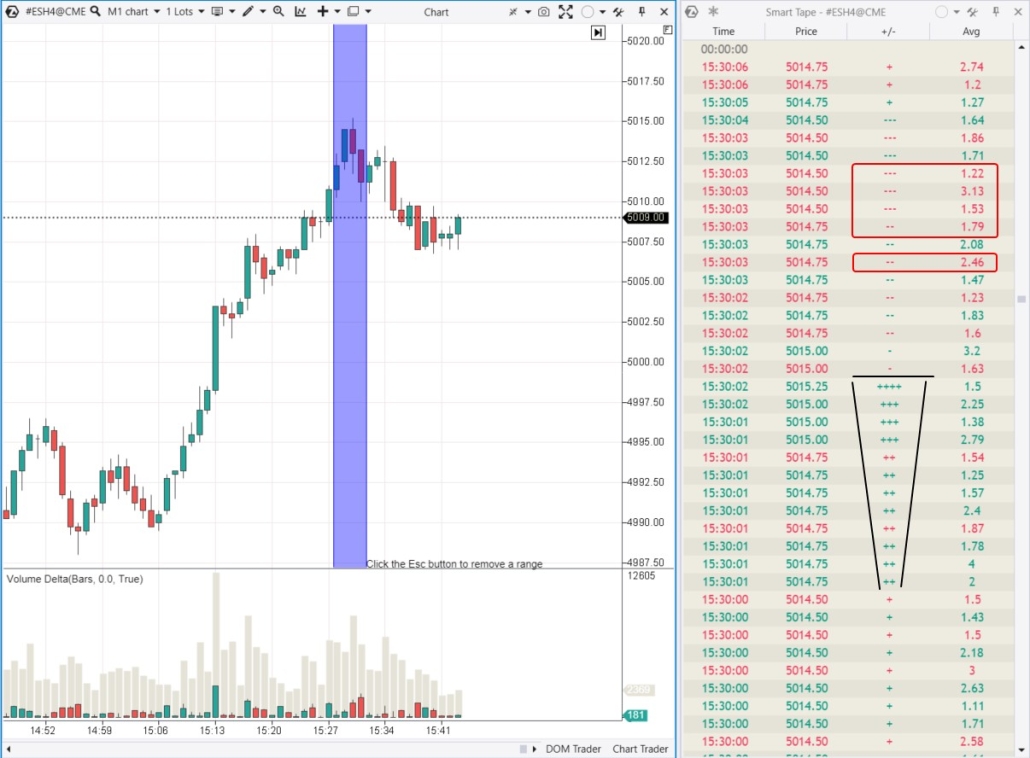
- in black – a triangle that can indicate a potential culmination of the preceding upward price movement near the 5015 level.
- in red – prints that confirm the emergence of sellers’ activity, indicating the start of a new downward impulse. The consecutive number of downticks and the average volume support this observation.
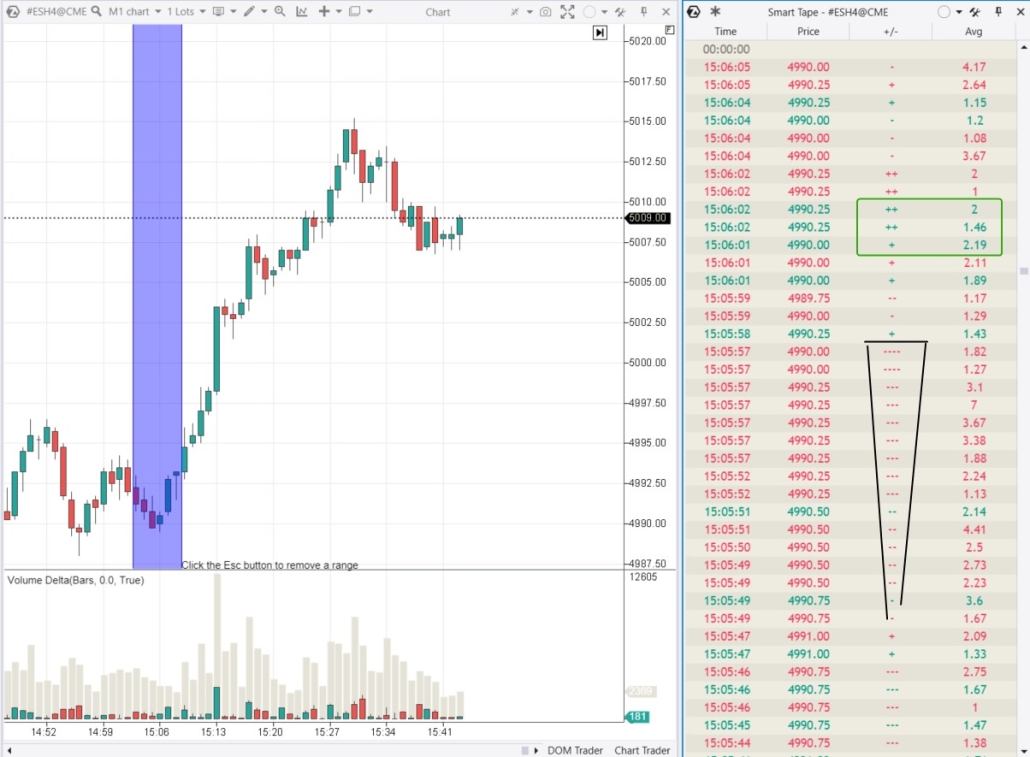
- in black – a triangle signaling the culmination of the downward price movement near the previous support level at 4990. Now we observe downticks in the triangle.
- in green – prints confirming that buyers have become more active. The consecutive number of upticks and the average volume reinforce this observation.
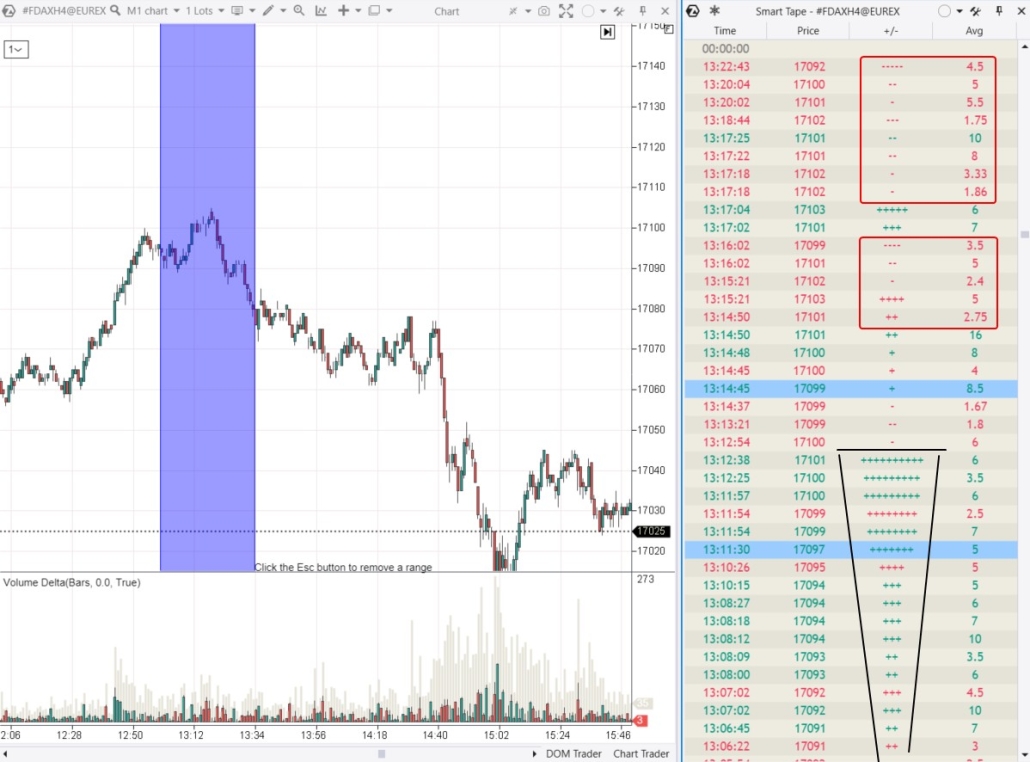
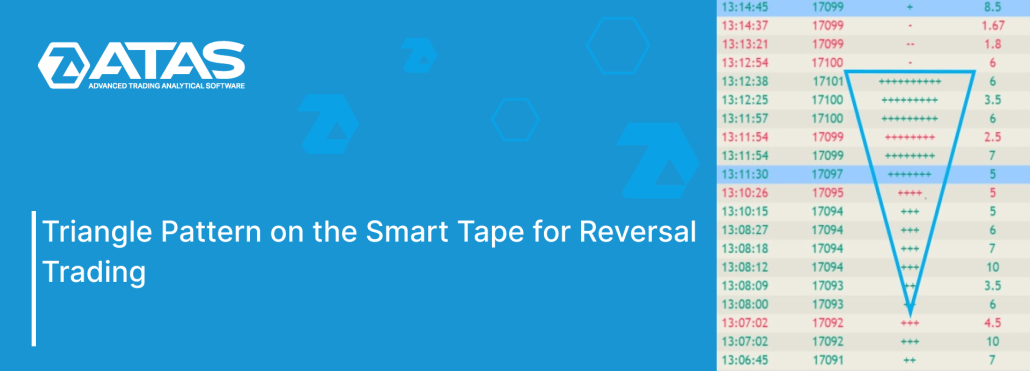
- the triangle ‘broke down’ against the 17100 level,
- this was followed by an activation of sellers.
Example 2. Futures on the Foreign Exchange Market
Data is sourced from the CME exchange, Euro futures. The Minimum Volume parameter in the tape filter is set to 6.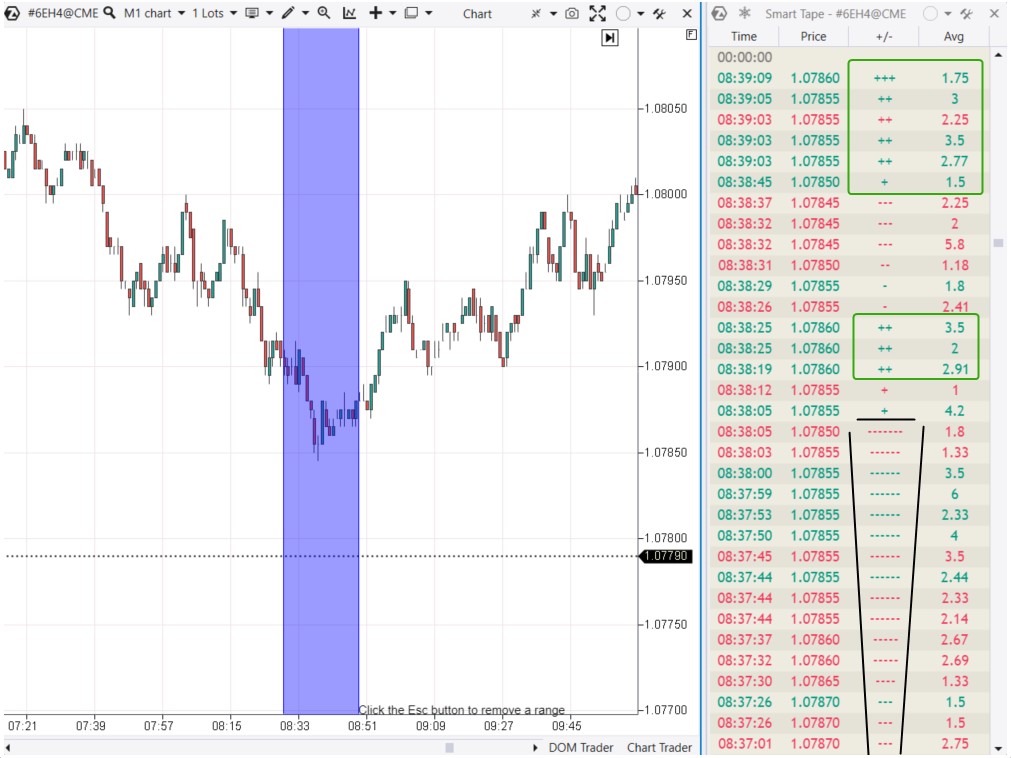
The entire triangle did not fit into the screenshot because sellers did not become active immediately. However, the core principles remained unchanged.
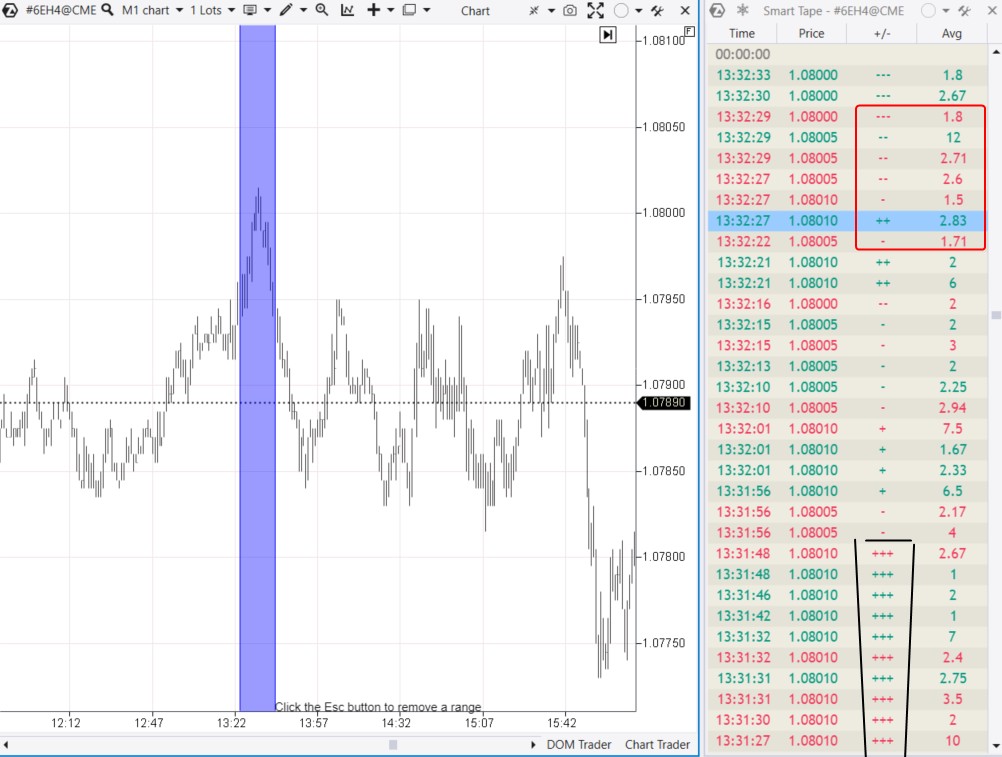
Example 3. Futures on the Commodity Market
Let’s examine how the pattern works in commodity markets using gold prices. Data is sourced from the COMEX exchange, with a Minimum Volume set to 5.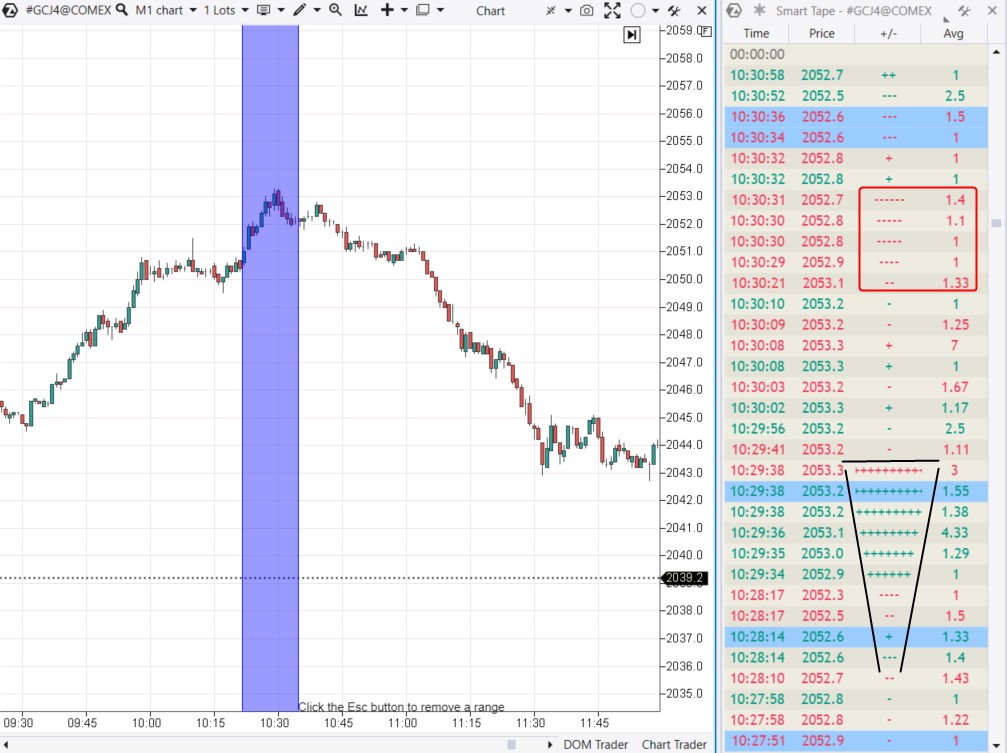
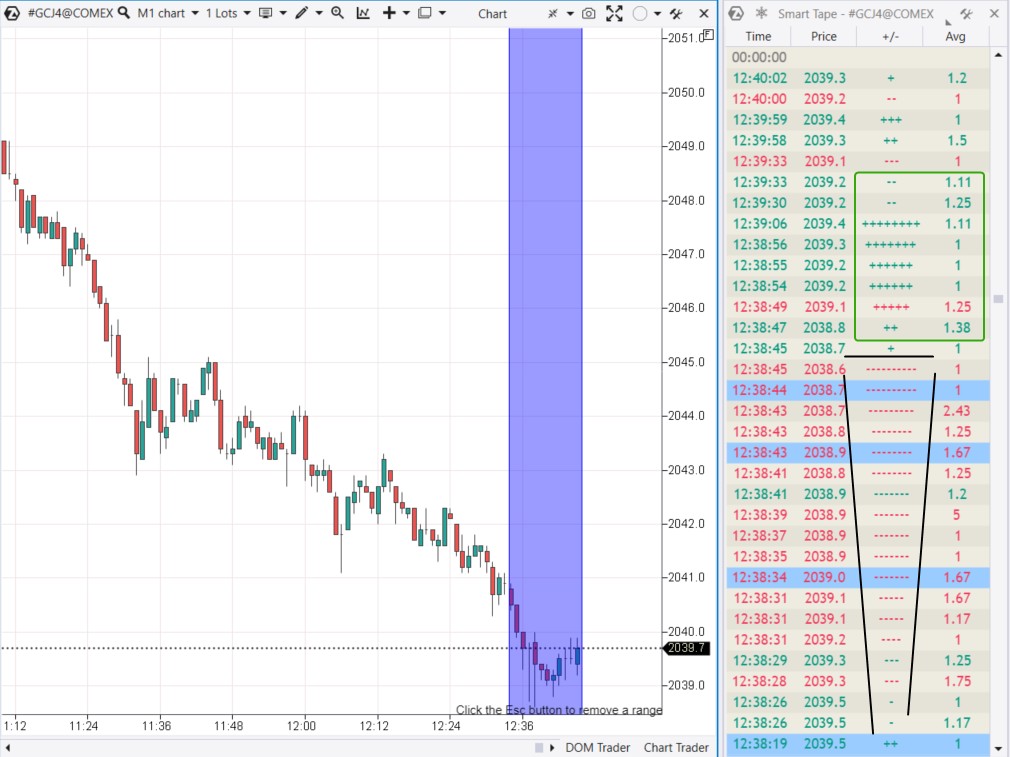
As time showed, the attempt proved unsuccessful and only led to a temporary halt in the downward trend.
How to Trade Using the Pattern on the Smart Tape:
1. Identify key levels and resistances. 2. Wait for the price to approach them. 3. Look at the Smart Tape, search for the triangle. 4. Enter the trade on the confirmation signal. 5. Set a stop outside the level at which the triangle formation ended. You can set your take profit based on mathematical calculations or market context. Feel free to adjust your approach based on your risk tolerance, personal circumstances, and initial market conditions.Pros and Cons of the Pattern
Like any trading approach, the ‘triangle on the Smart Tape’ pattern has its pros and cons.Pros
- It is easy to understand and interpret.
- It is well-suited for selecting entry and exit points.
- It can be combined with other approaches, especially with support and resistance levels.
- Trading in sync with market dynamics. The pattern suggests buying when selling pressure has exhausted, potentially leading to a new rally. You buy based on facts, anticipating that your long position will be at the beginning of increased demand.
- It does not lag. It is not redrawn. The pattern is formed based on raw exchange data.
Cons
- Not all patterns work. Even if you believe you’ve identified a perfect pattern, a reversal may not occur.
- Patterns depend on quote providers. On historical data, the Smart Tape captures all trades for display, so the pattern appears attractive. In real time, when trade data comes in one after another, the pattern may not form as clearly.
- It is not suitable for all markets. For example, the Smart Tape exhibits excessively volatile behavior on Binance exchange futures. When switching from market to market, you will probably need to adjust Smart Tape settings.
- Risk of overtrading. The pattern can form near minor support and resistance levels. Close monitoring of the Smart Tape is associated with additional workload and is suitable only for patient traders able to maintain concentration.
- It is not suitable for everyone. Swing traders and position traders are less likely to find the pattern appealing compared to scalpers and day traders.
How to Start Applying the Strategy
First of all, you need to download and install the ATAS platform. Learn how to configure the Smart Tape. After this:- Study the behavior of the pattern. Use various historical market stages, spikes, and volatility drops. Enable getting real-time quotes and, if possible, compare data from different providers.
- Try Market Replay — a market simulator that enables you to replay historical data as if trading was happening in real time. This way, you can practice identifying patterns and trading using various strategies, including those based on the Smart Tape. Analyze trading statistics and eliminate errors.
- Enhance your chances. Try gaining more advantages over other traders by using footprint charts. Or non-standard timeframes. Or professional indicators like DOM Levels, Big Trades, Volume Profile, and others.
- Keep learning. Our blog, YouTube channel, and ATAS Knowledge Base provide detailed instructions on setting up the platform and using its features for market analysis and trading. Additionally, platform users can count on responsive support from ATAS.
Conclusions
The Smart Tape is a powerful tool that can significantly enhance the effectiveness of your intraday trading strategy. The ‘triangle on the tape’ pattern will help you more accurately identify entry points, especially from important support and resistance levels. If you have not tried using the Smart Tape module yet, we strongly recommend getting acquainted with it. Download ATAS. It is free. Once you install the platform, you will automatically get the free START plan, which includes cryptocurrency trading and basic features. You can use this plan for as long as you like before deciding to upgrade to a more advanced plan for additional ATAS tools. You can also activate the Free Trial at any time, giving you 14 days of full access to all the platform’s features. This trial allows you to explore the benefits of higher-tier plans and make a well-informed decision about purchasing. Do not miss the next article on our blog. Subscribe to our YouTube channel, follow us on Facebook, Instagram, Telegram or X, where we publish the latest ATAS news. Share life hacks and seek advice from other traders in the Telegram group @ATAS_Discussions.Information in this article cannot be perceived as a call for investing or buying/selling of any asset on the exchange. All situations, discussed in the article, are provided with the purpose of getting acquainted with the functionality and advantages of the ATAS platform.


