
What is the 50% retracement
Let’s suppose that some factors made the price rise from 100 to 110 dollars, for example, it happened due to a release of positive reporting. This is an impulsive move. The 50% retracement is a subsequent price decline to $105 from a $110 peak. That is half the impulse. A trend is likely to resume after the 50% retracement. Usually it works like this:- volumes decrease during a decline;
- the price decreases more slowly during the retracement compared to the increase.
How to use the 50% level to make a profit
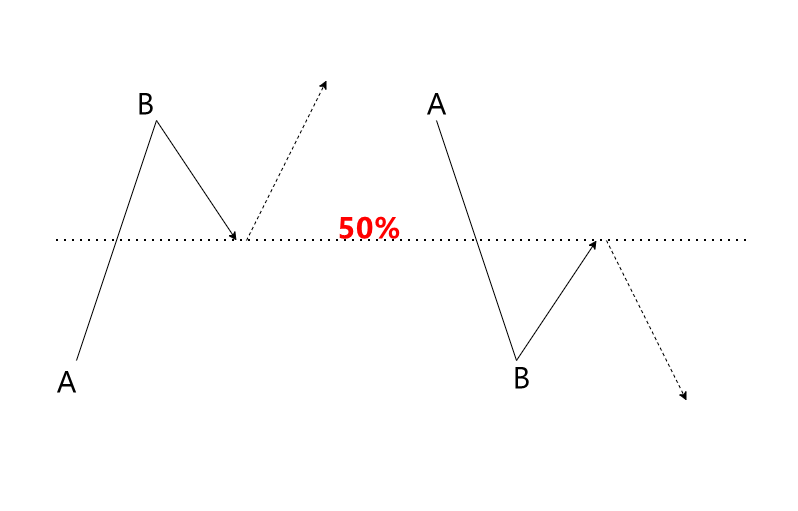
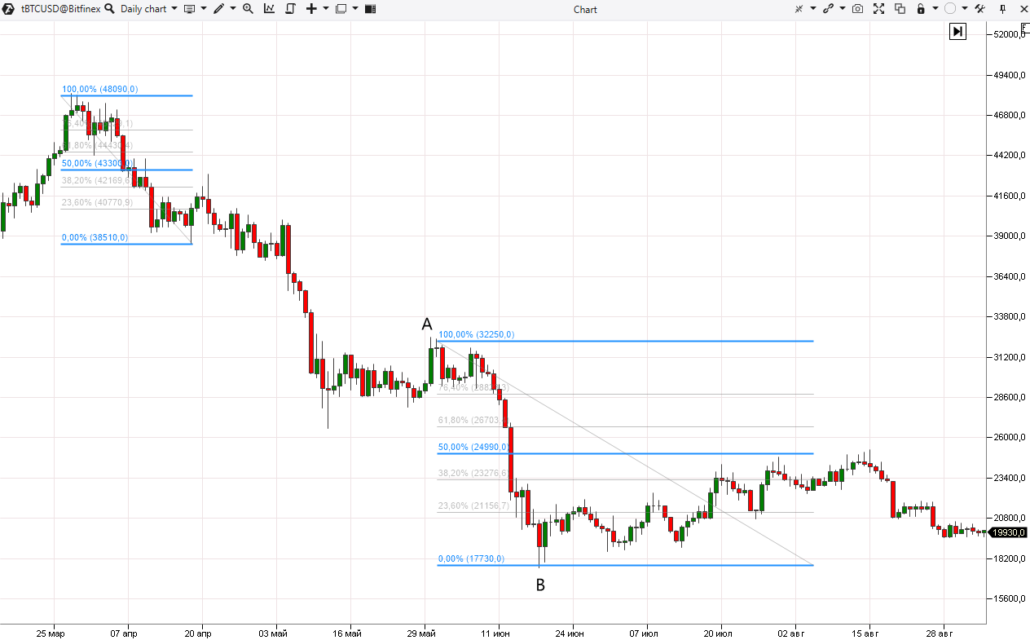
The principle is simple (see figure below):- identify a bullish (bearish) impulse А→В;
- wait for the 50% retracement in the opposite direction;
- enter long (or short), it is highly desirable to receive confirmation and follow the risk policy.
Thoughts on the nature of the phenomenon
We do not claim to be the ultimate truth, we will only present three hypotheses. Which one is the most plausible is up to the reader. After all, every trader is responsible for their own actions.Hypothesis 1
The 50% level works because it is a Fibonacci level. The Fibonacci numbers describe proportions that are found everywhere.Hypothesis 2
A situation that occurs on the exchange is similar to a typical bargaining between two people: — I’ll buy your car for 20 thousand. — I will sell for 30 thousand. — Well, what about 25? Let’s meet halfway. — Okay, deal. If the seller is confident in the quality of the product and the demand for it, he is unlikely to lower the price below 25. Or below 26. Or he will not make any concessions at all. This can explain retracements which are less than 50% and typical for strong trending markets.Hypothesis 3
Let’s imagine that the market is a universal mechanism which is designed to “take money in a relatively honest way” from a large number of emotional private investors who dream about getting rich quickly and without any effort. Then the motivation for the price movement is to cause losses to as many similar market participants as possible:- A retracement begins when too many market participants have entered the direction of the impulse move. The purpose of the retracement is to make them feel pain and anxiety.
- The retracement is over when the evil goal has been reached. Assuming that the trend has reversed, they enter a position in the direction of the retracement and end up suffering losses when it ends.
Examples on charts
Using professional instruments of the ATAS platform, let’s analyze some examples from different markets to identify:- impulse moves,
- subsequent retracements to the 50% level;
- confirmations on lower time frames to enter a position.
Example 1. Futures on the S&P-500 stock market
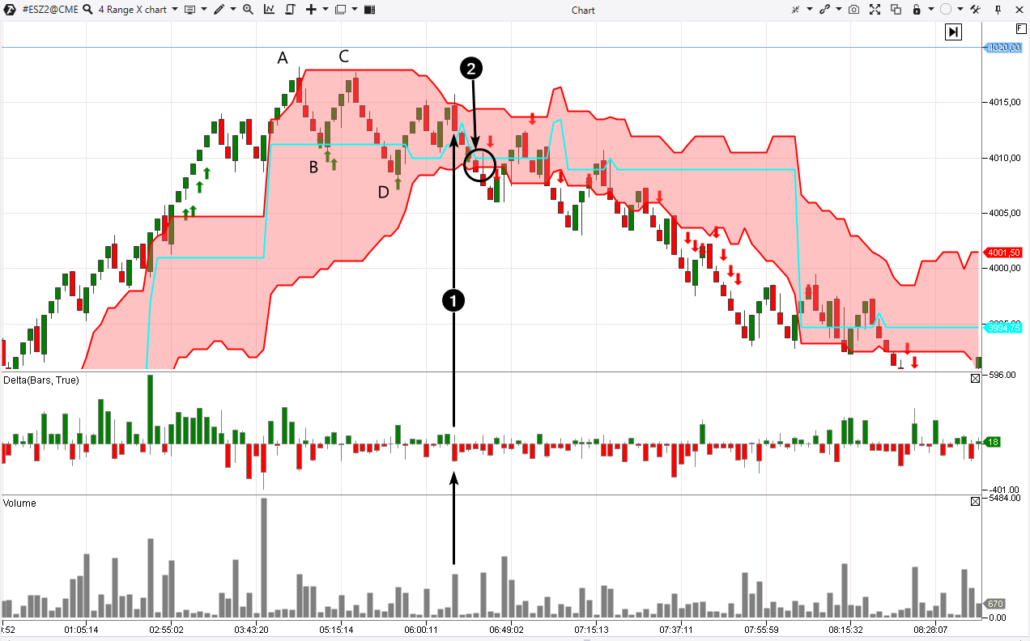
The hourly chart below (August-September 2022) shows:- On day A, there was an impulsive decline in the market with a breakout of the previous day’s low;
- On the following day B, there was an increase which was 50% (as marked with arrow 1) of the fall of day A. The tops of day B are the time to enter a short position.
- Some time later, there was an impulsive rise in the same market on day C. The bulls showed the ability to raise prices from multi-day lows and break through the previous day’s highs.
- On day D, there was a rather aggressive decline that was 50% (as marked with arrow 2) of the C-day rally. The low of the D-day is the time to go long.

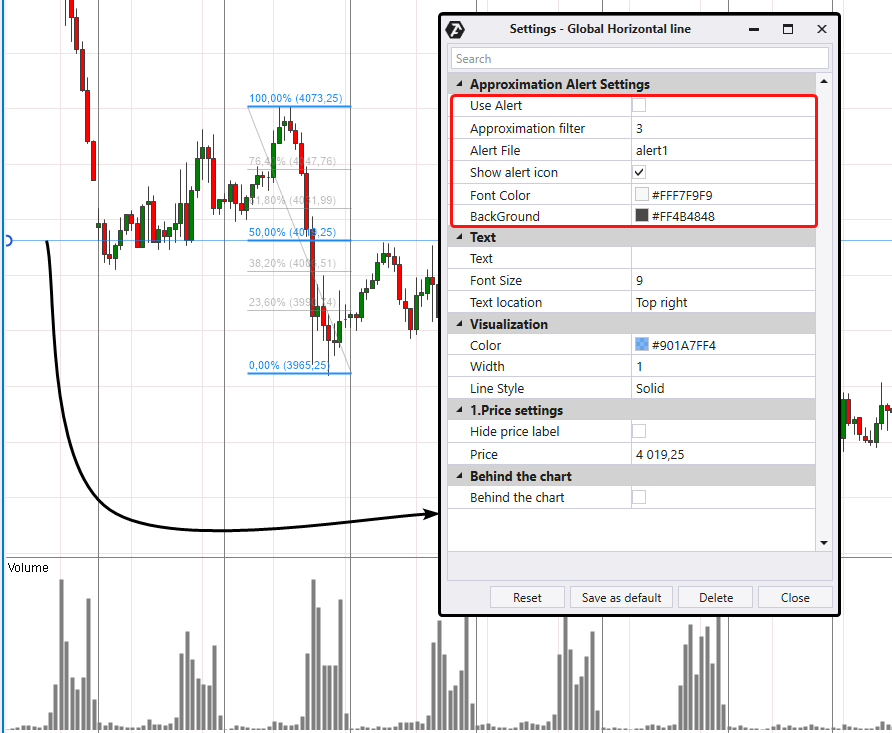
- build the level (for example, by pressing the F4 key);
- right-click on the level, set up alerts in the level settings (as shown in the picture below).
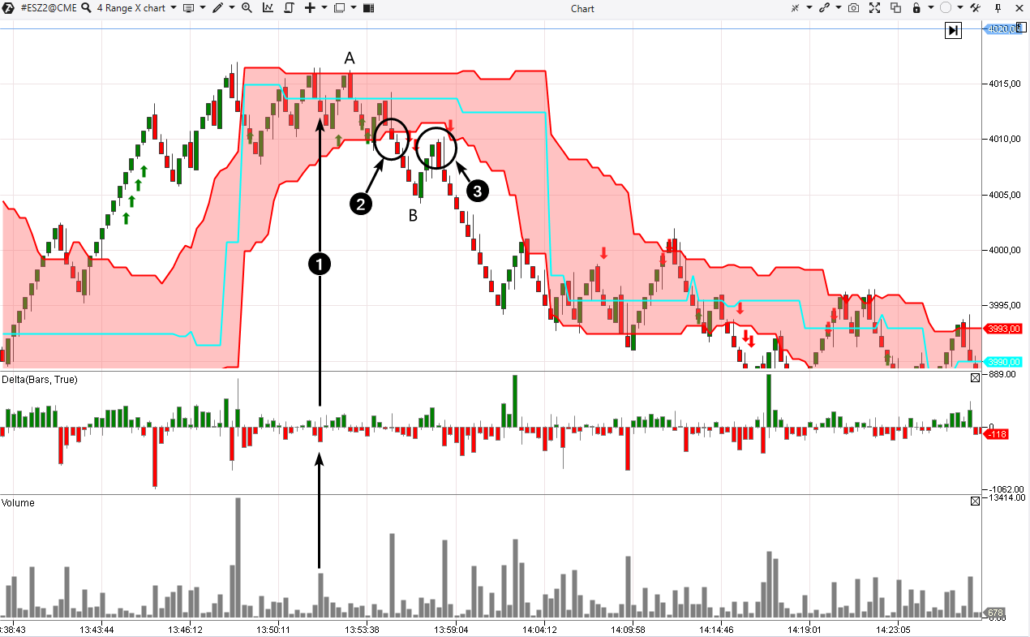
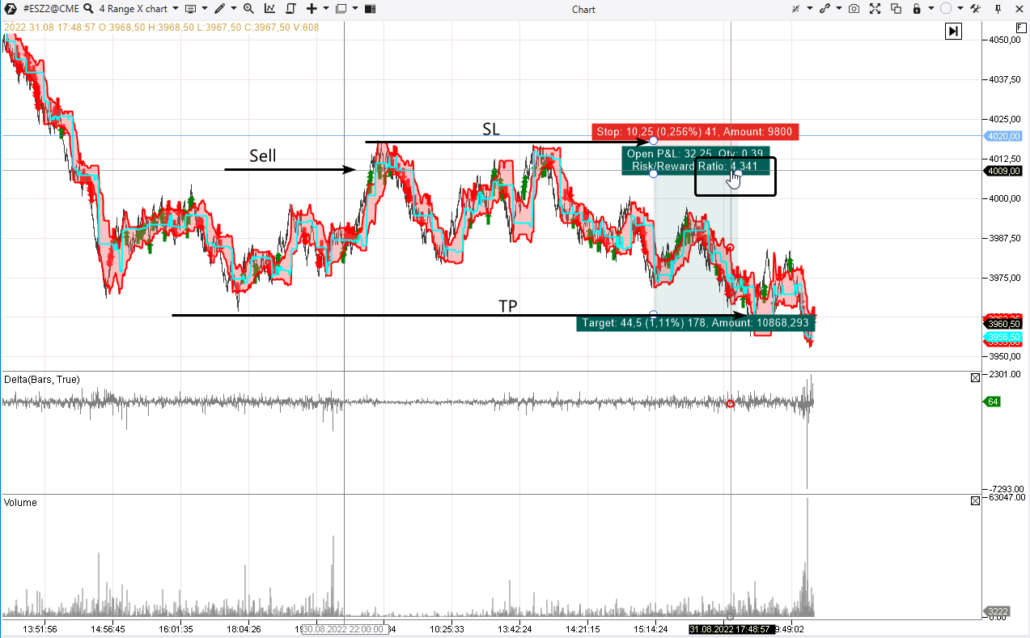
Example 2. Futures on the S&P-500 stock market (entering a long position)
Let’s have a look at a setup for entering a long position on day D and use the same chart settings for the lower time frame.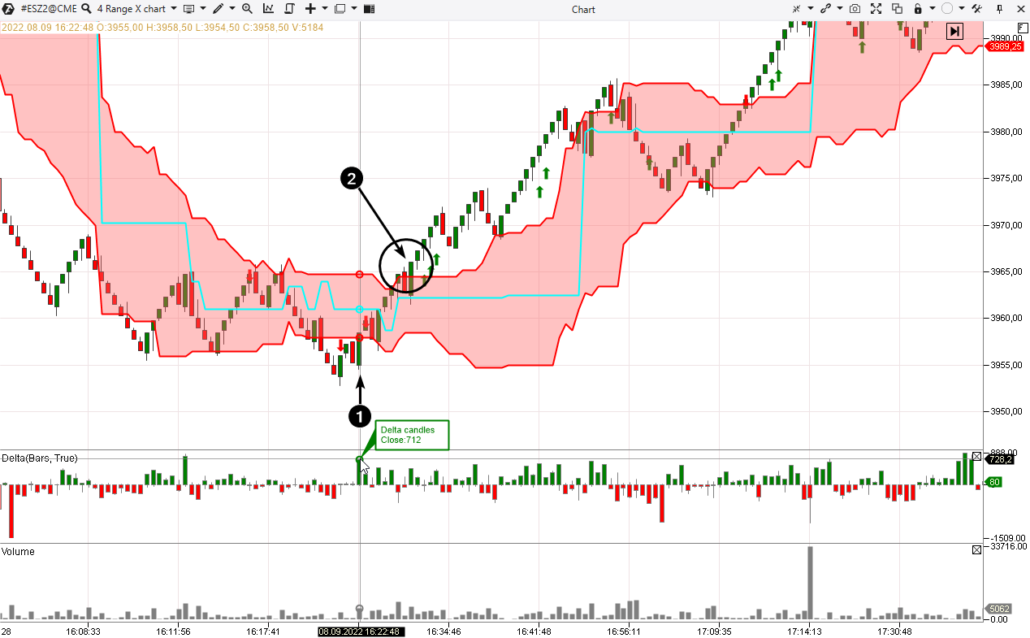

- A bearish candle that indicates the appearance of sellers. It is shown by a spike in volumes with closing at the lows and a long upper shadow. Later, the maximum volume level was formed at the level of the candle’s body.
- An attempt of a bullish breakout of the previous top. The growth is uncertain because volumes are relatively small. The following two bearish candles, which completely “engulfed” the bulls’ effort, prove the failure of the attempt.
- Another unsuccessful attempt – volumes are small during the growth. The next candle engulfs the bullish progress that has been made.
- Another bullish candle. It has high volumes – let’s say they reflect the bulls’ effort. But what progress will they make? Closing in the middle of the candle and below previous highs. The next candle is a bearish engulfing one. The chart shows that the bulls fail to succeed over and over again. A wide swing, a spike in volumes on candle number four and the subsequent bearish engulfing candle indicate a shift in sentiment.It is also a sign that the market is turning down from the 50% retracement level which is seen on the daily chart. The price is holding below the high volume level, this is a confirmation of the buyers’ weakness. The bears have made significant progress on wave A→B (which is noticeable by the volume of 11.3k and the height of 61 ticks) – another confirmation.
- A sharp retracement to the 50% level (which, by the way, coincides with the maximum volume level) – an opportunity to enter a short trade. You can switch to an even lower time frame in order to accurately choose the right moment
How to start trading 50% retracements: tips for a beginner trader
Try using the following logic:- first, look for impulse moves and subsequent retracements that approach the 50% level;
- then switch to lower time frames to get confirmations and find a good moment to enter the trade.
- It is free and you can continue using the program even after the 14-day trial period.
- The platform allows you to analyze the history so you can make sure that the 50% level is effective.
- There is a demo account built into the ATAS platform, so you can practice trading without risking your real capital.
- The platform offers many benefits for traders who want to combine impulse trading with easy-to-use cluster charts and useful indicators.
Information in this article cannot be perceived as a call for investing or buying/selling of any asset on the exchange. All situations, discussed in the article, are provided with the purpose of getting acquainted with the functionality and advantages of the ATAS platform.


