
What Is a Piercing Line Pattern?
In simple terms, the Piercing Line is a reversal pattern that indicates a potential shift from a bearish to a bullish trend. It consists of two candles: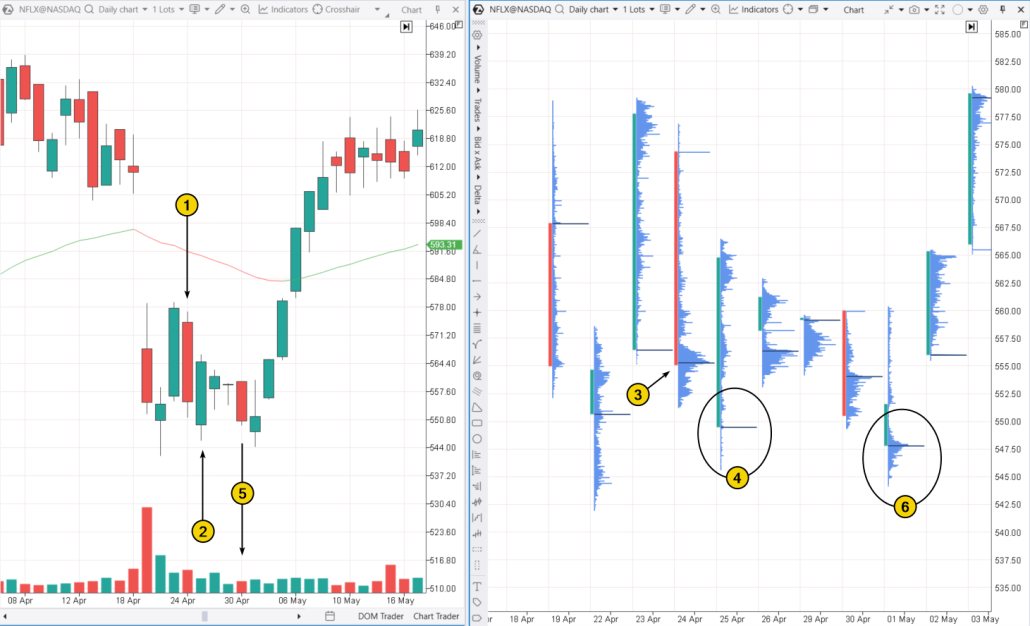
How Can a Trader Interpret the Piercing Line Pattern?
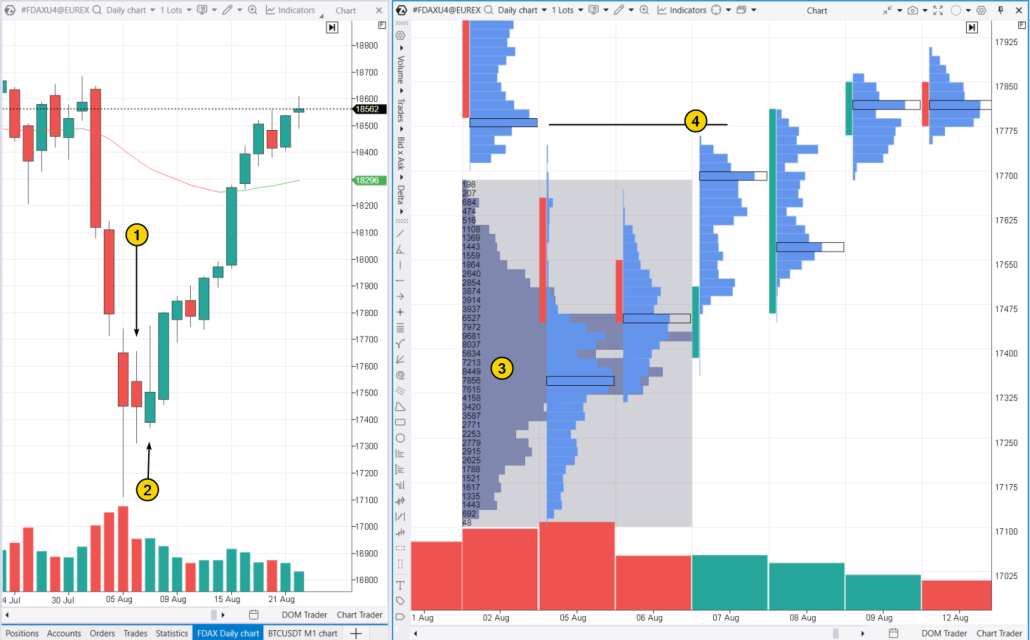
On the right side of the example above, you can see a footprint chart. It provides additional important details that help you better understand the dynamics behind the Piercing Line pattern. On April 25, the candle closed above the highest volume level (3) of the previous candle, indicating that the balance of power between buyers and sellers had shifted in favor of the buyers — a bullish sign. Around the low point on April 25 (4), trading activity was minimal, suggesting a lack of buyers (No Demand). According to the classic vertical volume indicator (5), the price declined on April 30, but with relatively low volumes — indicating weaker selling pressure. The ledge (6) on the profile from May 1 likely reflects bearish sentiment among traders who anticipated the price would fall below the April 25 low. However, they were caught off guard when the price opened with a bullish gap on May 2. Exiting their positions meant accepting losses that increased as the price continued to rise. To better understand the chart, note that the bullish reversal occurred just below the psychological level of $550 per share.What Is the Piercing Line Strategy?
The basic (classic) strategy for trading the Piercing Line pattern involves the following steps: Step 1. Identify the trend The Piercing Line pattern should appear after a significant price drop. Step 2. Identify the pattern The first candle should be a large red candle, confirming the continuation of the downtrend. The second candle should be a large green candle that opens below the low of the first candle and closes above 50% of the first candle’s body. Step 3. Confirm the pattern (optional) For example, you could analyze the context to see if the Piercing Line is forming near a significant support level. Another form of confirmation might be a third candle that closes above the second candle’s close or technical indicators that confirm a trend reversal (such as divergences). Step 4. Enter the market Entering a position is generally justified at the close of the second candle or at the opening of the next one, after confirming the reversal.- Stop-loss. When trading the Piercing Line, it is usually recommended to place a stop-loss below the low of the first or second candle, depending on your risk management strategy.
- Take-profit. The target level for taking profit can be set based on previous resistance levels or calculated mathematically based on the distance (points/percentage) from the stop-loss.
How Accurate Is the Piercing Pattern?
Overall, the Piercing Line pattern shows a fairly high success rate according to data from various sources: TradingWolf. This pattern is confirmed in about 72.9% of cases based on an analysis of 4,120 markets. Confirmation typically occurs within 2.3 candles, while disconfirmation happens within 4.3 candles. Thomas Bulkowski. In his “Encyclopedia of Candlestick Chart,” the Piercing Line ranks 21st out of 103 patterns, with 1 being the highest rating. In practice, it works as a bullish reversal and is confirmed in 64% of cases. Candlescanner. The Piercing Line pattern appears in 0.50% of all candlestick patterns on daily charts of S&P 500 stocks from 1995 to 2015. Effectiveness statistics for the 5 candles following the pattern are:- High effectiveness = 36.86% of cases.
- Average effectiveness = 18.21% of cases.
- Low effectiveness = 24.91% of cases.
- Losses = 20.02% of cases.
How to Use the Piercing Line Pattern in Trading
A key feature of the Piercing Line pattern is that the second candle must form a bearish gap relative to the previous one, which is typical on daily stock charts. This raises doubts about the pattern’s effectiveness on intraday charts for futures and cryptocurrencies, where gaps are rare. However, we will show an example from the futures market that, while not perfectly matching the Piercing Line criteria, effectively illustrates the core concept behind the pattern.Piercing Line Candles in the E-mini S&P 500 Futures Market
In early August 2024, stock markets were pressured by recession fears, fueled by weak U.S. labor market data. Bearish sentiment in the S&P 500 futures market was further amplified by a downturn in the Japanese stock market. The market hit its lowest point on the 5th, and if you look at the 15-minute candlestick chart (bottom left), you will notice a pattern that closely resembles a Piercing Line: (1) A wide bearish candle during a period of falling prices; (2) A bullish candle that dips below the previous low but closes slightly above the midpoint of the prior candle. After this, prices began to rise.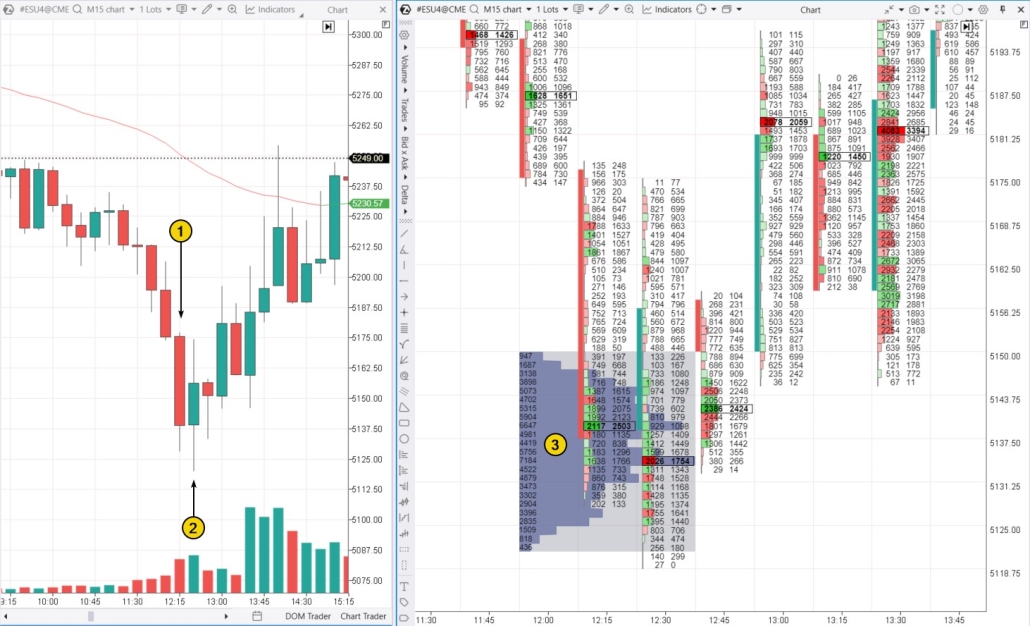
- the price closed above this high-volume area on the two candles forming the Piercing Line pattern;
- at 12:45, the price tested this level (dipping into it before bouncing back), confirming it as a support zone;
- at 13:30, the price tried to fall but ended up closing at its high, leaving sellers trapped near the candle’s low (as seen from the red clusters below 5156.25).
The Piercing Line Pattern on a Cryptocurrency Chart
2022 was highly disappointing for cryptocurrency market participants. Market sentiment declined sharply after the news of the FTX exchange collapse in November, which caused Bitcoin’s price to drop to $15k. Despite this, a Piercing Line candlestick pattern appeared on the daily chart for BTC futures (data from CME), as marked by numbers 1 and 2 in the chart below: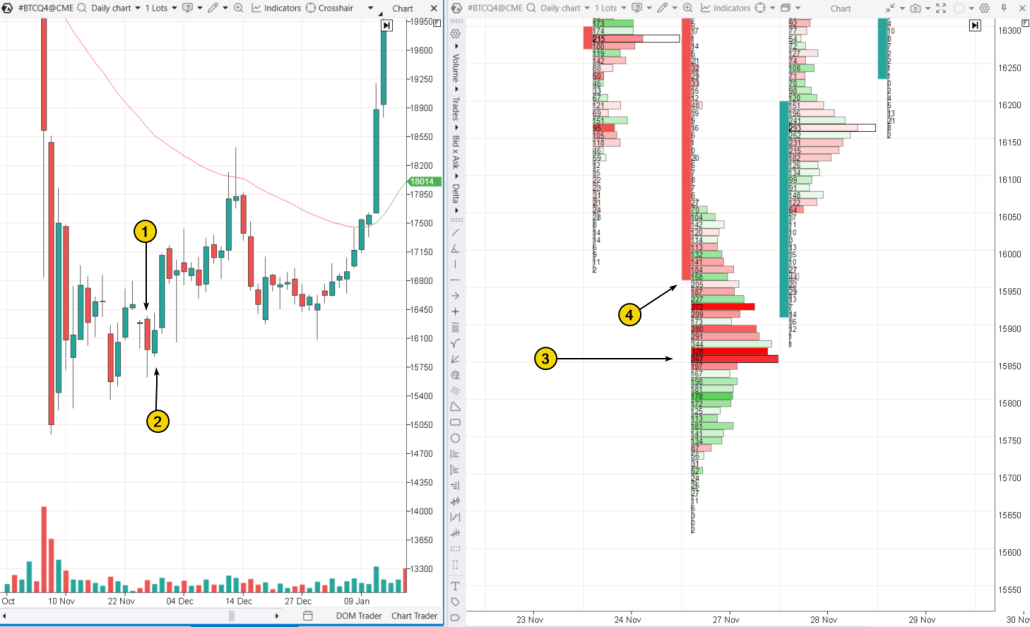
FAQ
What is a Piercing Line candlestick pattern?
The Piercing Line candlestick pattern is a reversal pattern that forms at the end of a downtrend and consists of two candles.How do you identify a Piercing Pattern?
The first candle is bearish, indicating that the decline is continuing. The second candle is white, it opens below the previous candle and closes above the midpoint of the first candle’s body.How a Piercing Pattern works?
The second candle signals a potential shift in sentiment: if the bears were in control at the opening, the bulls take over by the close.Is a Piercing Line pattern bullish or bearish?
This pattern is considered bullish, with various studies suggesting a reversal probability of between 64% and 80%.What is the difference between Piercing Line and Dark Cloud pattern?
Piercing Line patterns are mirror images of the Dark Cloud Cover pattern. While the Piercing Line appears at the end of a downtrend and signals a possible upward reversal, the Dark Cloud Cover forms at the end of an uptrend and suggests a downward reversal.How to Trade the Piercing Line Pattern Profitably
To improve your trading with the Piercing Line pattern, consider using advanced volume analysis tools like:- footprint charts (cluster charts);
- market profiles.
Getting Started with Pattern Trading
Even though some studies suggest patterns like the Piercing Line have a success rate of over 60%, this does not guarantee you will make a profit. To assess how well you might do with trend reversal patterns, try using the ATAS Market Replay simulator for trades. This feature of the ATAS platform uses historical data to recreate real-time trading conditions. Traders can hone their skills in completely real conditions, avoiding any financial risks. To try the simulator, download the ATAS platform for free, install, and launch it, and then: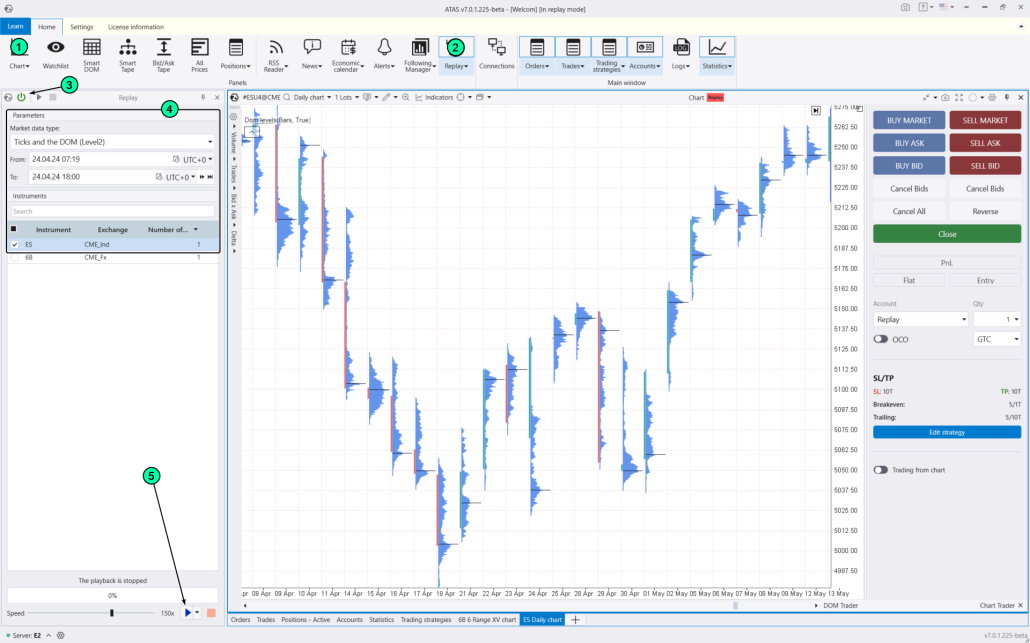
- adjust the playback speed, and pause;
- analyze footprint charts;
- use more than 400 indicators;
- use Chart Trader and other features to trade on the built-in demo Replay account and then analyze your performance;
- use drawing objects, for example, mark support and resistance levels;
- use various chart types (e.g., non-standard Range XV). However, note that the Piercing Line pattern will not work here because it is formed on traditional candlestick charts and standard timeframes.
- use exit strategies;
- do much more to sharpen your skills in spotting price reversals.
Conclusions
The Piercing Line pattern is a trend reversal pattern that signals an attempt by bulls to take control and establish a potential market bottom. It is similar to an incomplete bullish engulfing pattern.Pros of the Piercing Line Pattern
✔ Effectiveness. Research suggests a potential success rate ranging from 64% to 80% when trading the Piercing Line pattern. ✔ Profit potential. This pattern offers an opportunity to enter a position at an early stage of a possible upward trend. ✔ Flexibility. The Piercing Line pattern works well with other methods of technical and fundamental analysis and can be applied to trading on daily charts of stocks and other financial instruments.Cons of the Piercing Line Pattern
✘ Rarity. This candlestick pattern is uncommon in the market, which may limit its practical application. It is almost impossible to find a textbook example on liquid intraday markets. ✘ False signals. Like any trading signal, the Piercing Line pattern can result in a series of losses. ✘ Trading against the trend. The Piercing Line pattern involves opening long positions in a declining market, which carries additional risks. ✘ Lack of clear stop-loss and take-profit guidelines Protective stop-loss orders placed below the pattern’s low may not meet risk management requirements if the candles are wide. As you explore trading with the Piercing Line pattern (or other Japanese candlestick patterns), you may find it beneficial to shift your focus. In this case, footprint charts and other volume analysis tools on the ATAS platform might become your primary source of information rather than just a supplementary one. Download ATAS. It is free. Once you install the platform, you will automatically get the free START plan, which includes cryptocurrency trading and basic features. You can use this plan for as long as you like before deciding to upgrade to a more advanced plan for additional ATAS tools. You can also activate the Free Trial at any time, giving you 14 days of full access to all the platform’s features. This trial allows you to explore the benefits of higher-tier plans and make a well-informed purchasing decision. Do not miss the next article on our blog. Subscribe to our YouTube channel, follow us on Facebook, Instagram, Telegram or X, where we publish the latest ATAS news. Share life hacks and seek advice from other traders in the Telegram group @ATAS_Discussions.Information in this article cannot be perceived as a call for investing or buying/selling of any asset on the exchange. All situations, discussed in the article, are provided with the purpose of getting acquainted with the functionality and advantages of the ATAS platform.


