What is Intraday Trading?
The term intraday trading speaks for itself. Trading within a day is characterized by holding a position for a short period, limited to a single trading session. For example:- you did your analysis in the morning, opened a position, and closed it by evening;
- you opened a position right before some big news hit and closed it right after;
- scalping on breakout levels: 10 trades, each lasting 5-20 seconds;
- bouncing off high-volume levels: 2 trades with durations ranging from 3 to 30 minutes.
Intraday Trading: Pros and Cons
Pros of Intraday Trading
- Quick earning potential. Day trading offers traders the opportunity to make profits in a short span, using leverage. You can profit even from small price fluctuations, which are in abundance on 5-minute charts.
- Low entry barrier. Getting into intraday trading does not require big capital investments. For instance, when day trading futures, broker margin requirements to secure a position are significantly lower compared to positions carried overnight (or over the weekend).
- Risk management. Traders can effectively control their risks by setting stop-loss and take-profit orders. In comparison, in positional trading, a stop-loss might result in a loss much higher than planned due to a gap at the session’s opening.
Cons of Intraday Trading
- High complexity. Intraday trading demands a high level of skill and experience to swiftly consider all factors and make trading decisions in conditions of uncertainty.
- High Level of “Noise”. The 1-minute and 5-minute charts are filled with random fluctuations, causing intraday traders to close a trade with a loss.
- Overtrading. The risk associated with the high workload on analytical and emotional activities can lead to stress, errors in decision-making, and burnout. For more details on the downsides of excessive trading and how to avoid it, check out the article Overtrading for Beginners and Experienced Traders.
Intraday Trading Strategies
Developing an intraday trading strategy involves searching for patterns, implementing a trading edge and disciplined risk management, and adapting to the trader’s unique market vision that has already been formed. The examples on the charts below can inspire you to create your own unique intraday strategy.Intraday Futures Trading Strategy
The core idea is the price rebound from nodes of significant volume, noticeable on the market profile. In other words, this strategy involves a rebound or a test from the Point of Control (POC) level. High volume at the POC level indicates increased interest in this level, implying a significant number of trades executed at this price. When the price returns to this level, it triggers market participant activity — they may be closing or increasing positions according to their strategies. Usually, though not always, this leads to a rebound from the significant volume level, which can serve as the basis for creating an intraday trading strategy.Example 1
E-mini S&P-500 futures One-Minute Chart with TPO Market Profile Indicator.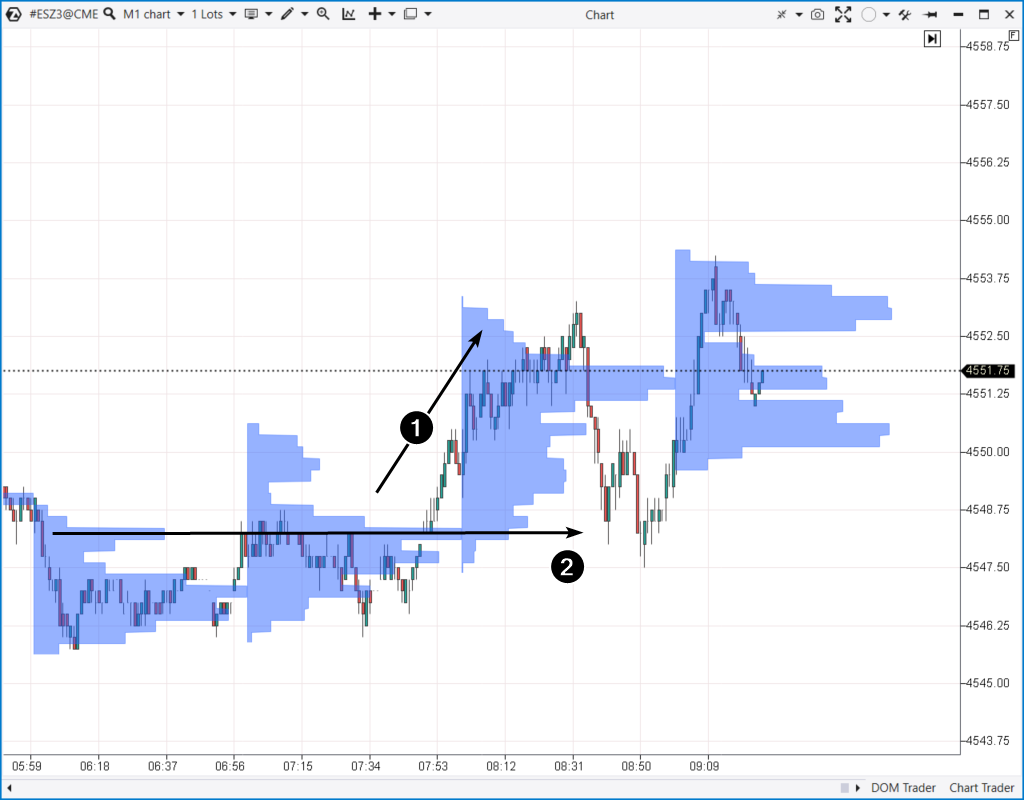
Example 2
E-mini S&P-500 Futures but on a 15-minute chart with a 6-hour profile indicator.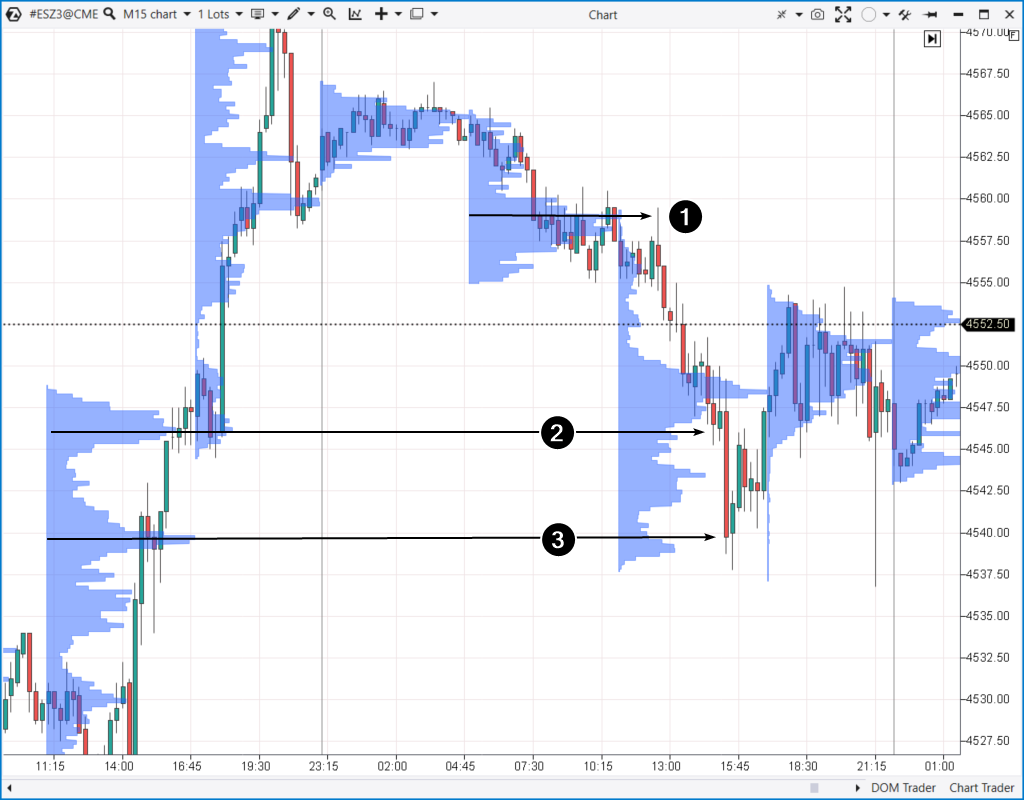
- November 20, when there was a sharp rise culminating above 4570;
- November 21, when the sentiment was bearish.
Example 3
A 15-minute chart to which a 6-hour profile indicator has been added. This time it is gold futures.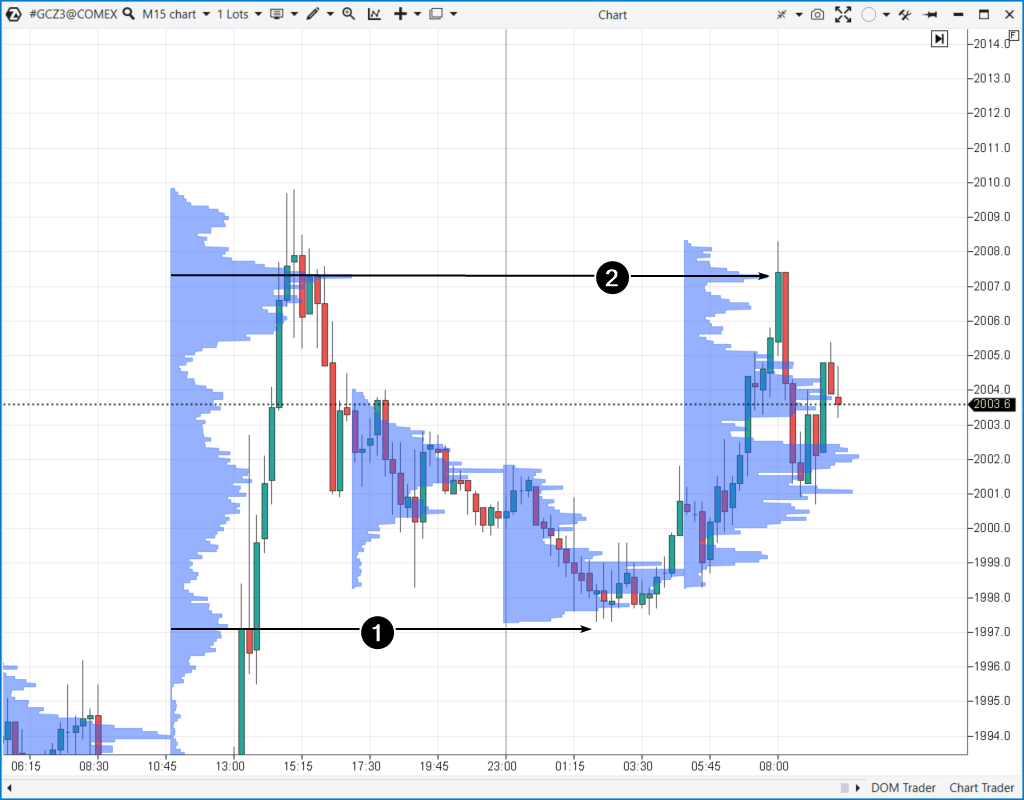
Example 4
An hourly chart to which a daily profile indicator has been added. Euro futures.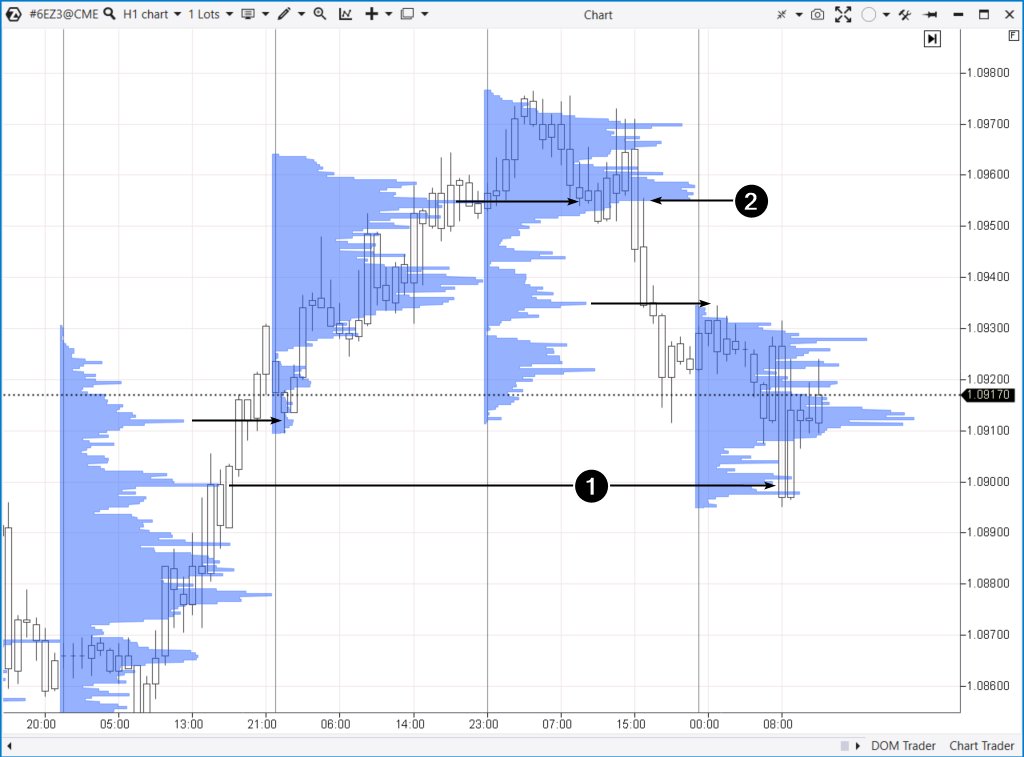
- buyers employing a “breakout” strategy;
- short positions being closed through stops set above the notable high.
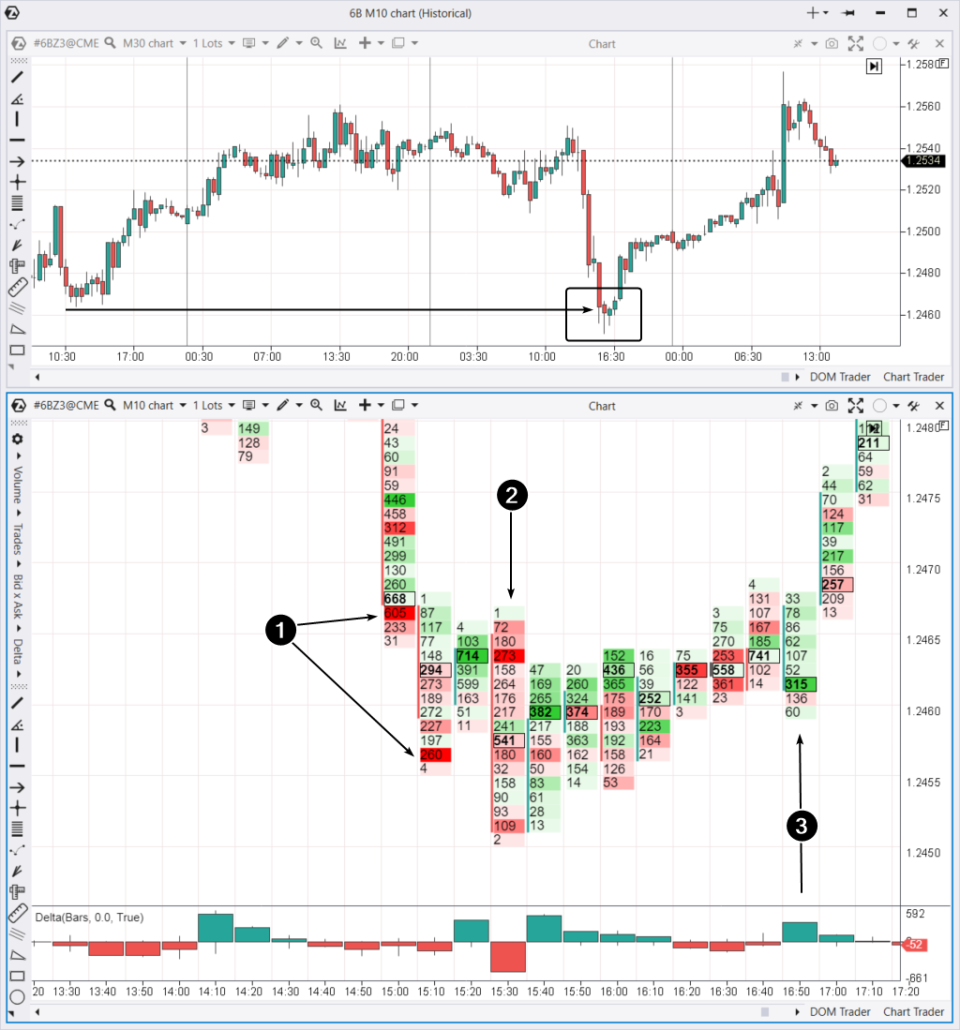
Example 3
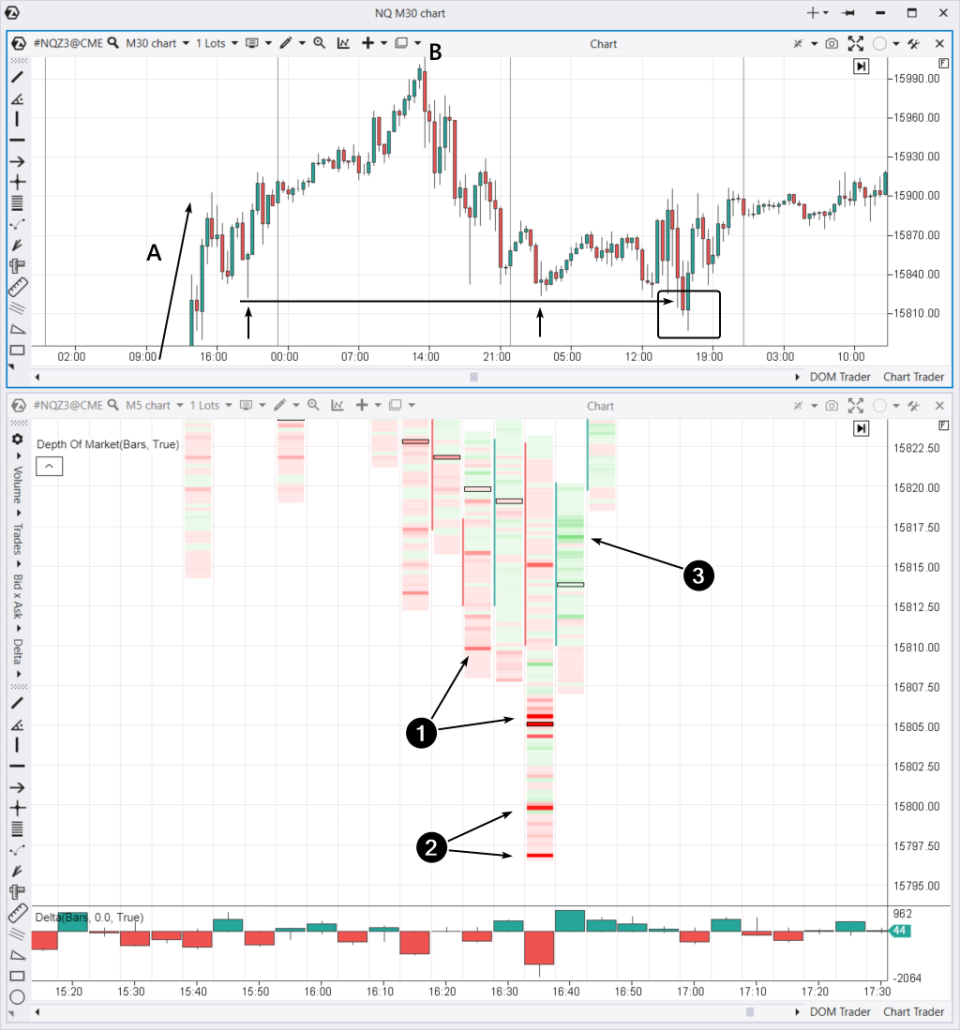
Nasdaq futures. The upper 30-minute chart shows a false breakout of the lows around the 18200 level.- Arrow A indicates a strong bullish impulse that occurred after the release of positive news.
- High B is the maximum formed during the continuation of the impulse on the next day. After the formation of high B, a retracement (correction) began.
- The support line is drawn from the local minimum on the day of a strong bullish impulse held once. Thus, we observe a false breakout of two local lows at once.
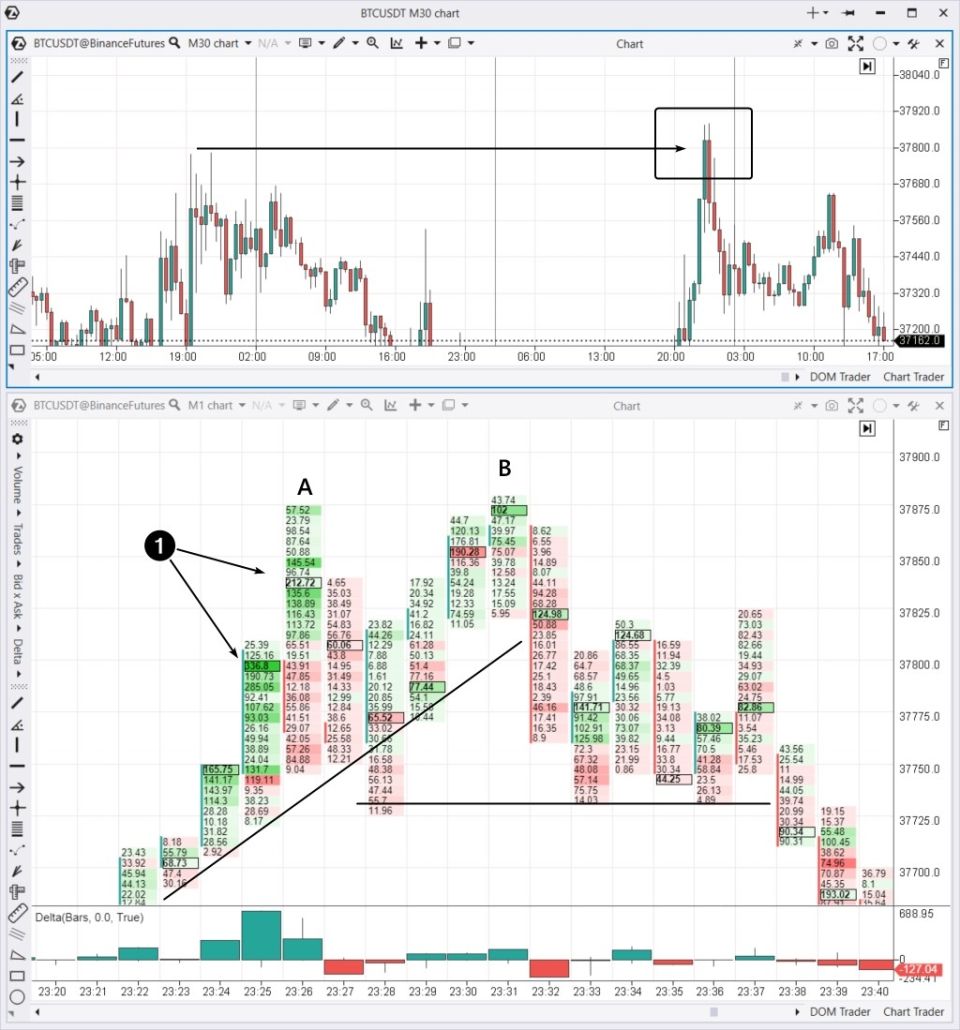
- a spike in positive delta on candle A. However, the next candle forms a bearish engulfing pattern. Then, something similar to what you have already seen in the Bitcoin futures chart happens.
- The price starts to rise almost inertially along an invisible trendline, and on candle B, it forms a false breakout of the high A. It triggers a sudden surge in sellers’ activity.
Additional Information on Intraday Trading Strategies
Do you need more examples with charts and descriptions? Use the list of articles from our blog below to gather valuable information on day trading strategies:FAQ
What is intraday trading?
Intraday trading is an approach in which a trader opens and closes positions within a single day. The main advantage of this approach is the optimal balance between the advantages of high-leverage trading and the lack of substantial capital requirements for investors (minimum margin). The overarching goal of intraday trading is to “catch” price fluctuations, which may span from a few points to several tens of points.
How to start day trading?
Read the article How to Become an Intraday Trader and follow the step-by-step recommendations:
- Open an account with a broker or use the built-in demo account on the ATAS platform.
- Get acquainted with the tools for intraday trading, such as available indicators, chart types, the DOM, and more.
- Develop a trading strategy.
- Start trading. Undergo training in Market Replay and then start trading using minimal amounts.
How much can you earn from day trading?
The potential earnings from day trading depend on various factors:
- experience and qualifications;
- size of the trading capital;
- the chosen trading strategy, whether it is aggressive or conservative.
How is intraday trading different from scalping?
Scalping is a subtype of intraday trading. It represents one of the approaches to day trading, where scalpers hold positions for a minimal amount of time — sometimes just a few seconds.
Can you learn day trading on your own?
Yes, you can do it. But it demands time, dedication, and self-discipline. Here are a few tips to help you learn day trading on your own:
- Start with the basics. Before diving into trading, it is crucial to understand how the market works and what factors influence asset prices. Explore the Market Theory section on our blog.
- Practice on a demo account and use Market Replay. This will help you to gain experience in day trading without the risk of losing real money.
- Learn risk management. Risk management is essential before engaging in day trading.
- Find a suitable trading strategy. Or even better, adapt existing and proven information to your vision of the market by developing your own unique approach.
- Be patient. Do not expect to become a successful day trader in a week.
What risks are associated with day trading?
The primary risk is related to financial losses. In day trading, trades are made frequently and for short periods. Therefore, losses can be significant, especially in the case of a series of unprofitable trades when trading against a strong trend. Additionally, intraday trading involves the risk of emotional stress. O assist traders in managing these risks, the ATAS Chart Trader features a set of exit strategies. Further, we will tell you about other features of the ATAS platform that can provide you with a competitive advantage in day trading.
Advantages of Using ATAS for Intraday Trading
Day trading is associated with high competition. Use the ATAS platform to gain significant advantages:- Indicators. ATAS offers tick-level granularity, enabling market analysis with maximum accuracy. This is particularly crucial and valuable for day traders. Some of the most useful indicators include Cluster Search, Big Trades, and Speed of Tape.
- Cluster charts or footprints. By accessing information inside candlesticks, you can make more informed decisions compared to traders who only see 1-minute candlesticks. Additionally, you can experiment with different timeframes.
- Tape and the DOM. Useful tools for working with Level II and Order Flow include ATAS Smart DOM, DOM levels, and Smart Tape. Do not forget the indispensable tool for scalpers — DOM Trader.
- Beginner-friendly. The blog, YouTube channel, and Knowledge Base provide specific instructions on setting up and working with charts, applying indicators, developing strategies, and other valuable information for day trading. ATAS users can also rely on responsive customer support.
- Market Replay. You can configure the Market Replay to replay historical data and practice day trading strategies as if in real time. ATAS enables you to load tick data history from futures, stocks, and cryptocurrency markets, providing you with a comprehensive foundation for mastering day trading strategies.
Conclusions
According to various estimates, there are several million to several tens of millions of day traders worldwide. The exact number is hard to determine due to the significant turnover:- Beginners enter the market driven by the advantages offered by day trading: the potential for high earnings, independence, and accessibility.
- However, the majority fail to achieve consistent profits due to the drawbacks of day trading: high risk of losses, emotional pressure, and the complexity of making trading decisions.
Information in this article cannot be perceived as a call for investing or buying/selling of any asset on the exchange. All situations, discussed in the article, are provided with the purpose of getting acquainted with the functionality and advantages of the ATAS platform.