- Real stories of making profit from stock trading;
- Examples of growth and fall of stock;
- Stock market analysis methods (fundamental, graphical and dimensional);
- Dimensional stock analysis with the use of Cluster Search (example).
1. Real stories of making profit from stock trading.
Warren Buffett made a fortune due to investing into the stock of American companies. His determination to make money prompted Buffett to buy stock of undervalued companies. That strategy envisaged a long-term portfolio stock holding. Patience and intelligent analysis of the stock market made Buffett a very rich investor. Stock trading on the exchange differs from trading currency pairs, since the majority of stock grow in price over years. That is why the idea “buy when the price goes down” works better with stock than with forex. There is an opinion among traders that if some stock lost more than 20% of its cost, it makes sense to think about buying it. Thus, the S&P500 exchange index, which includes stock of 500 American companies, shows the general tendency in the best way possible. The index grew by 25% during 2017. And if we look at historical data, we will see that the index grows constantly.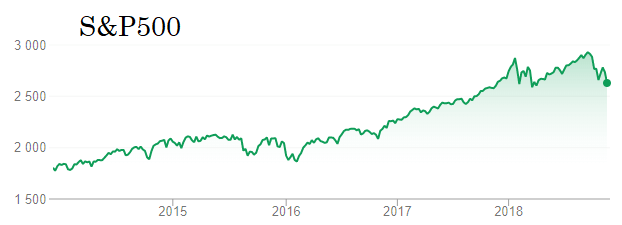
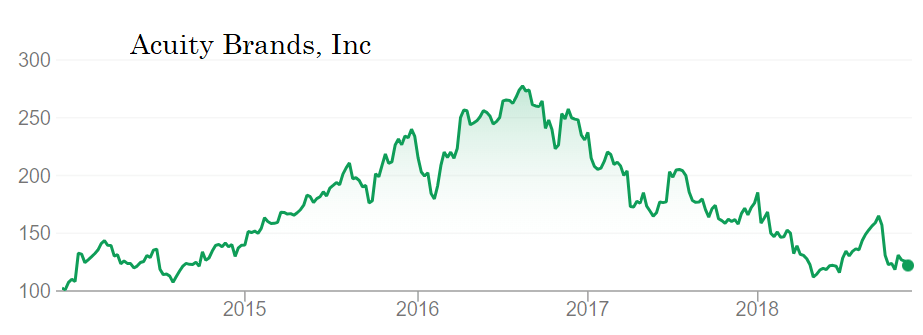
2. Examples of growth and fall of stock.
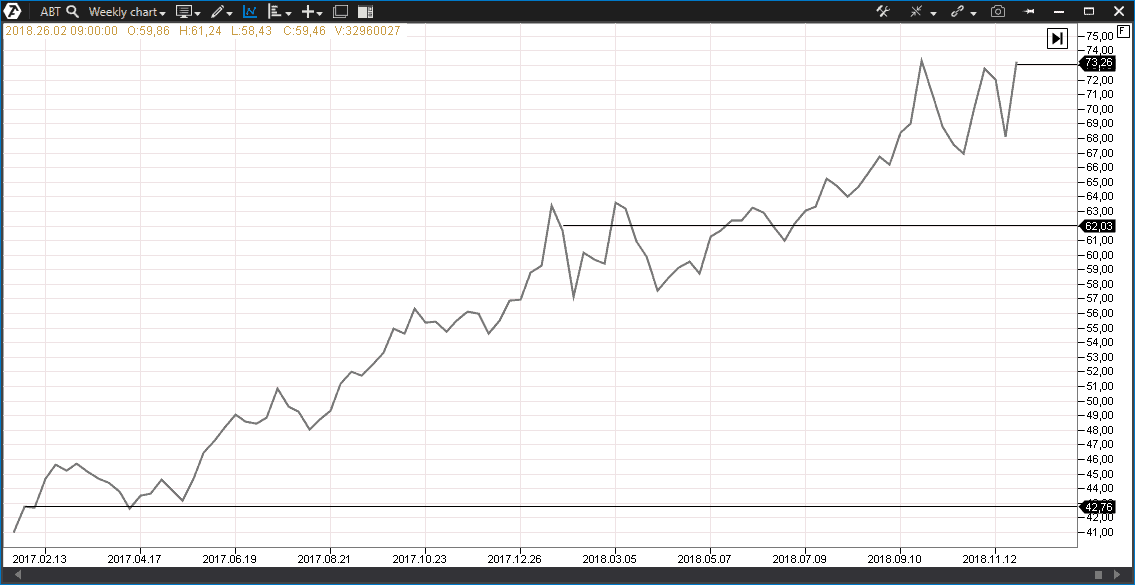
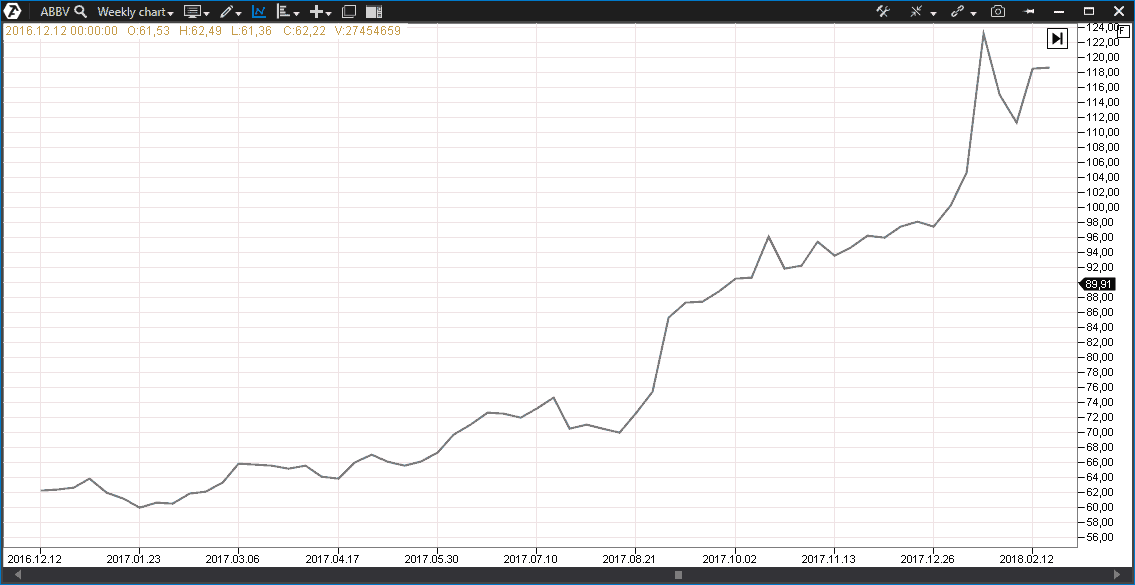
Since the S&P500 index reflects the weighted capitalization value of the stock of 500 companies, its growth does not mean that all stocks grow. The index grows from 10 to 30 percent annually in the average, whereas some stock grows, some falls.For example, buying Abbott Laboratories stock at the beginning of 2017 would have brought 40% of income during one year, since the paper had grown from USD 42.5 to USD 62. And the price quote reached USD 73 per share by December 2018, which would have brought about 80% of profit to investors.
3. Stock market analysis methods
Correct stock investing requires a systematic approach, which envisages conducting a preliminary analysis by three parameters:- fundamental;
- graphical;
- dimensional.
Fundamental analysis.
Fundamental analysis is based on assessment of financial indicators of the company:- receipts;
- net profit;
- assets and liabilities;
- intrinsic stock value;
- liquidity;
- business activity;
- profitability.
It is necessary to take into account external irritants when selecting companies:
- influence of political and economic risks;
- competition;
- dependence on natural and technogenic factors.
Graphical or technical analysis.
Graphical or technical analysis is based on visual detection of so-called patterns, which are formed when price quotes move along X (time) and Y (price) axes. Patterns reflect behaviour of market participants and can take on various forms:- support and resistance levels;
- double peak and double bottom;
- head and shoulders;
- growing and falling wedge;
- rectangles;
- triangles.
In practice, traders initiate emergence of reversal or further movement patterns. Also, there are patterns, which do not show further direction, and the primary exit from the pattern will be false. Technical analysis also applies indicators, which use the price for calculations, for example, SMA, MACD, Stochastic and others. Dimensional analysis is capable of supplementing two previous analyses. It helps to determine moods of market participants, conduct search for major players and identify their intentions. Appearance of big volumes at price levels testifies to the interest of major market participants and the delta shows what scenario they expect.
4. Dimensional stock analysis with the use of Cluster Search
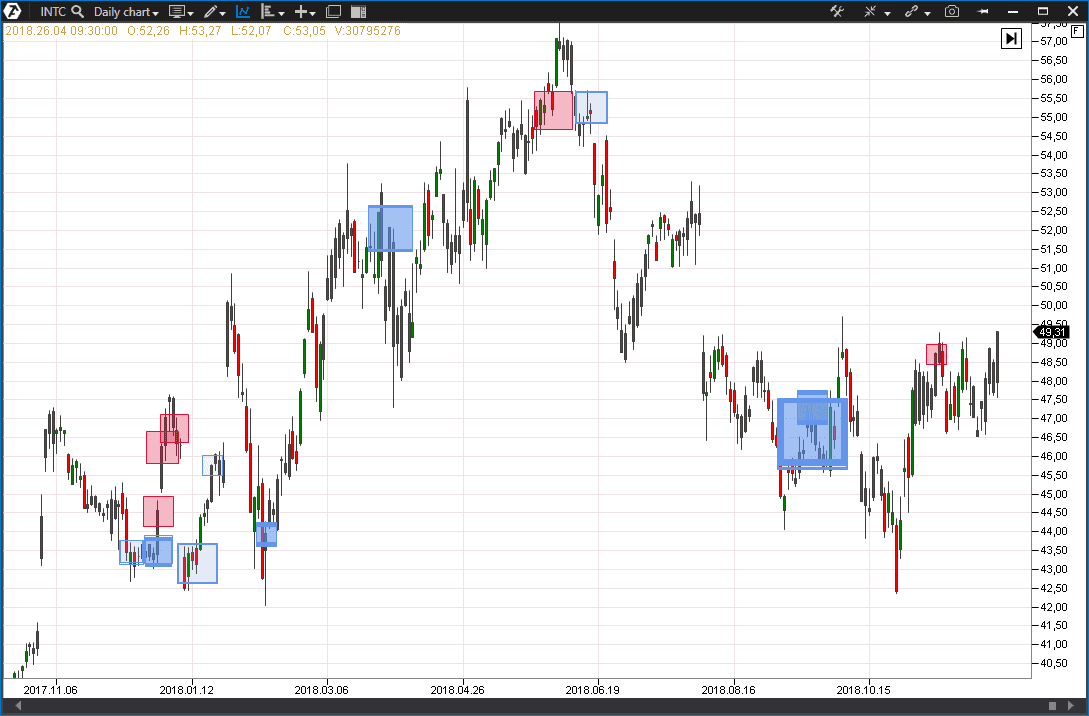
Cluster Search is a unique flexible instrument of the trading and analytical ATAS platform for finding big trades. Let us consider an example of the dimensional analysis of Intel stock: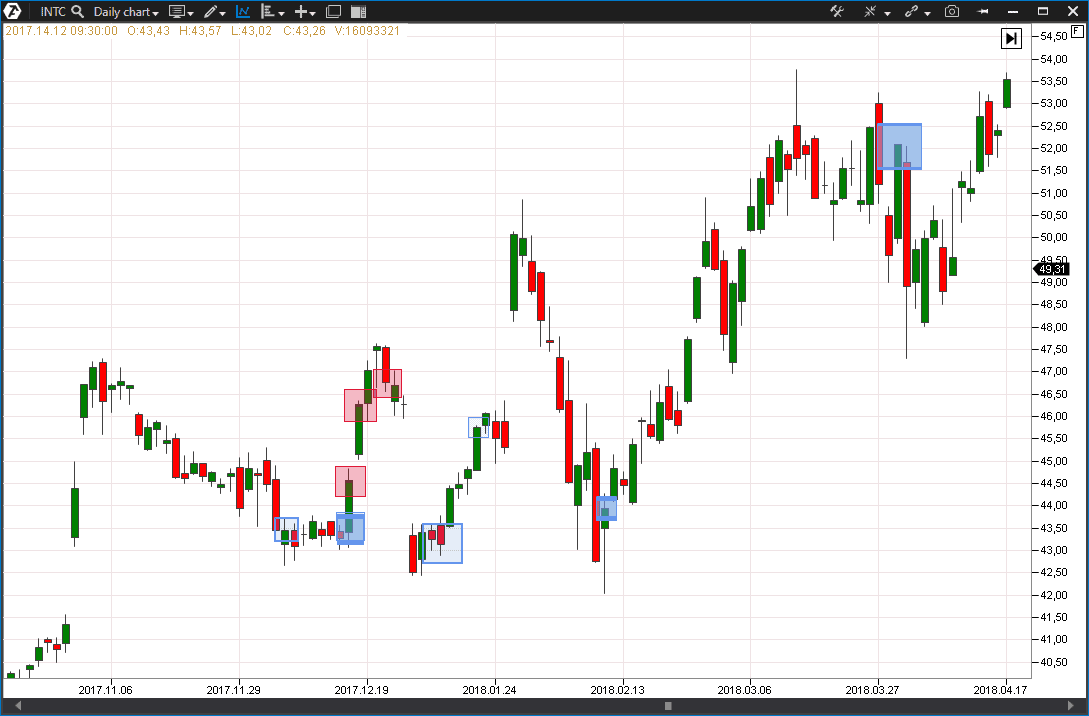
- minimum value is “5 000 000”;
- calculation type is “Volume”;
- bid-ask overweight in % is “80”;
- unification of price levels “10”;
- any color; our color is CornflowerBlue.
The second indicator will track major sellers, for which we would need the following settings:
- the minimum value is “5 000 000”;
- calculation type is “Volume”;
- bid-ask overweight in % is “-80”;
- unification of price levels “10”;
- any color; our color is Crimson.
Now we can see that there are big buys of more than 5,000,000 shares with the delta overweight of 80% at the level of, approximately, 43.5. The buy indicator manifests itself every time when the price approaches the 43.5 level, after which the price comes back to the range above. The last support level test took place on February 9, 2018, and the price reached the level of USD 52.5 per share by March 13, 2018. The stock brought 20% of profit to its investors for the period in question. Now you have an idea how to make a living from trading stock. But this is not all.
The stock price levels can manifest themselves on a long run. We compressed the chart a bit in order to show what happened during level testing in September, October and November of 2018.