February 7, 2023

How to create parallel channels and why does a trader need them?

Contents

    Share

    Parallel channels are an underrated pattern of technical analysis. When used with instruments for analyzing exchange volumes, parallel channels can become the basis for developing an effective trading strategy. Read more:

    What parallel channels are

    A parallel channel is a technical analysis pattern in which the price forms a trend channel (1-2) and then breaks through one of the boundaries to find the next boundary (marked with a red circle in the diagram below). This provides a condition for creating a parallel channel.
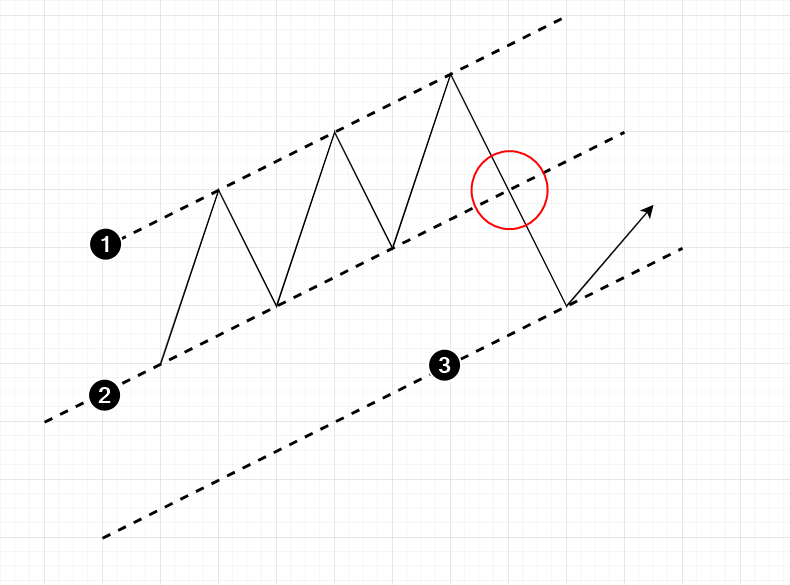
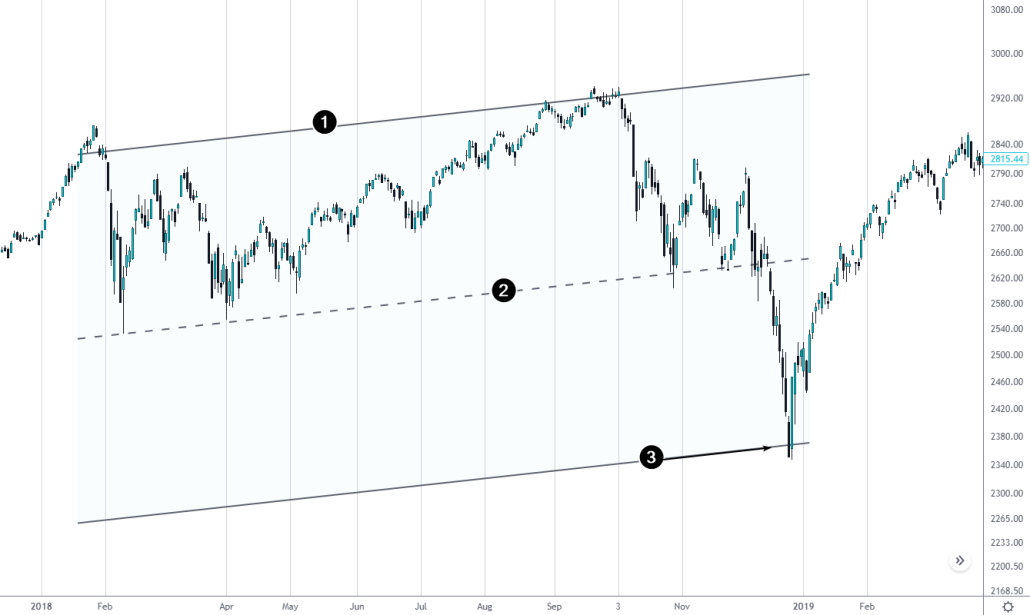
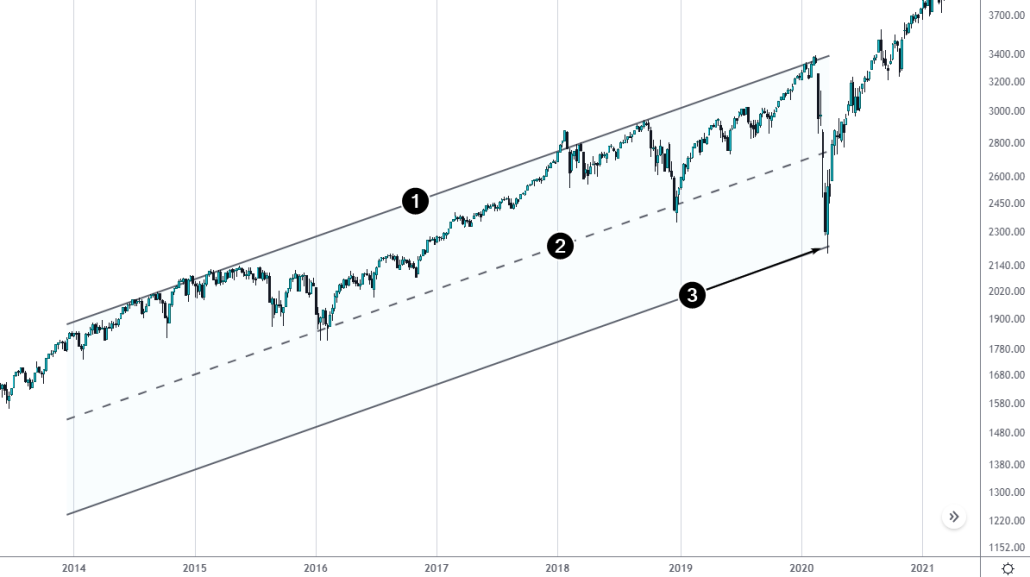
    To draw a parallel channel line for a bullish trend, you need to:
    At the same time, the parallel channel line (3) quite clearly indicated the level of a quick reversal on the daily chart. One could use lower intraday time frames to get confirmation and enter a risky position with a small volume — it had a chance to become the “best trade of the year”.

    Example 2

    The same SPX index, but on a larger scale. Another candidate for “trade of the year” or even more.

    If you draw the main channel (1-2) through the extremes of 2014-2020, the parallel channel line (3) will indicate the bottom of the panic caused by the spread of the coronavirus. While the rest of the world was terrified, the parallel channel helped cold-blooded investors choose the accurate entry point.

    Example 3

    During 2018-2022, the NFLX stock price formed a trend channel (1-2). But then the price plunged down amid the news of a decline in the number of subscribers.
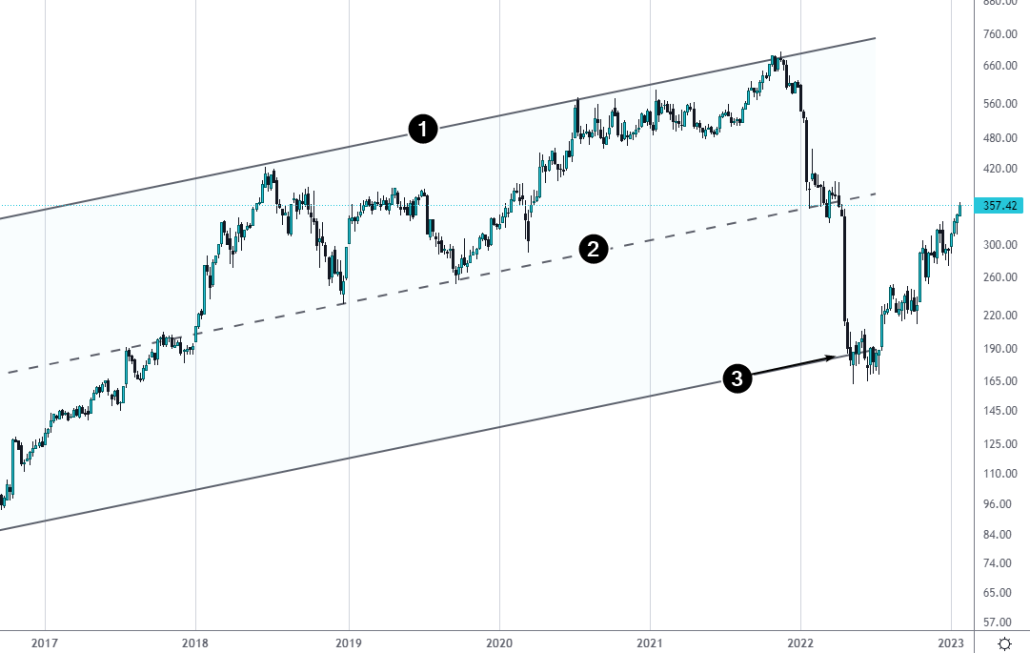
    The parallel channel line (3) indicated the level at which the panic subsided. The price formed a several-week range and then rallied noticeably (although the overall market was not bullish in the second half of 2022).

    Example 4

    At the end of 2021, the investors’ agenda was formed considering strict restrictions due to the coronavirus in China. They led to a decrease in demand. The statistics also made it clear that some of the world’s largest economies were heading towards a recession. Oil futures fell sharply in price.
    Параллельный канал, пример 4

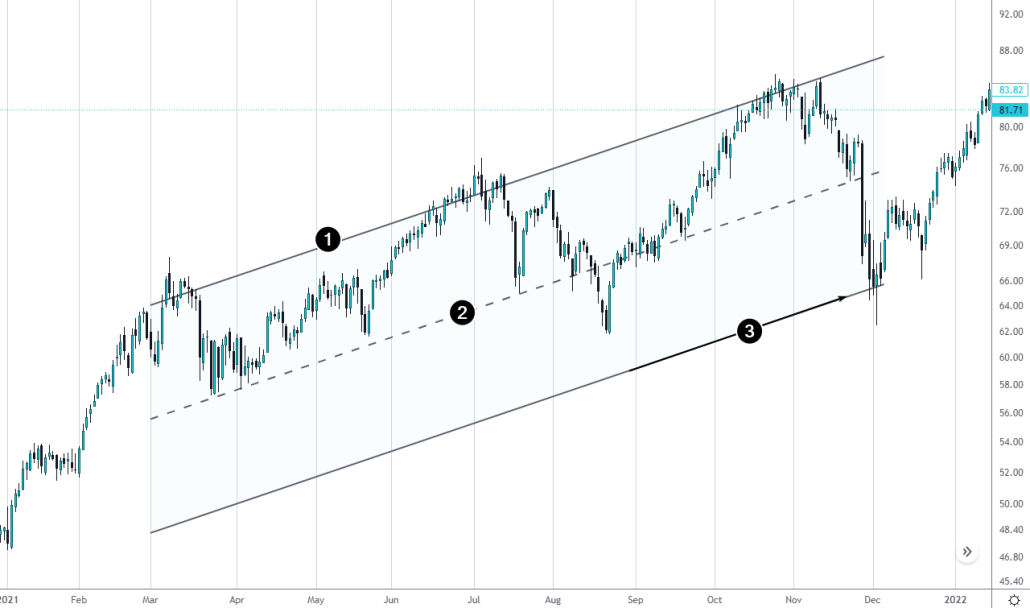
    A false breakout in August makes it more difficult to draw the main channel. Other than that, the main channel (1-2) shows up quite clearly. The parallel channel line (3) provides a major reference point for finding a long entry point.

    Example 5

    A similar situation occurred in the market of another energy asset during the same period.

    However, the rebound from the parallel channel line did not form as actively on the natural gas futures chart as it did on the oil futures chart.

    Example 6

    Now let’s have a look at a bearish pattern from the cryptocurrency market. After declining from a historical peak in November 2021, the early spring of 2022 gave bulls hope.
    Параллельный канал, пример 6
    However, this was only a correction to the parallel channel line (3). The main channel can be drawn based on the price actions marked with arrows. In April, the bearish trend resumed and the price of bitcoin reached multi-month lows amid bankruptcies of major participants in the crypto industry.

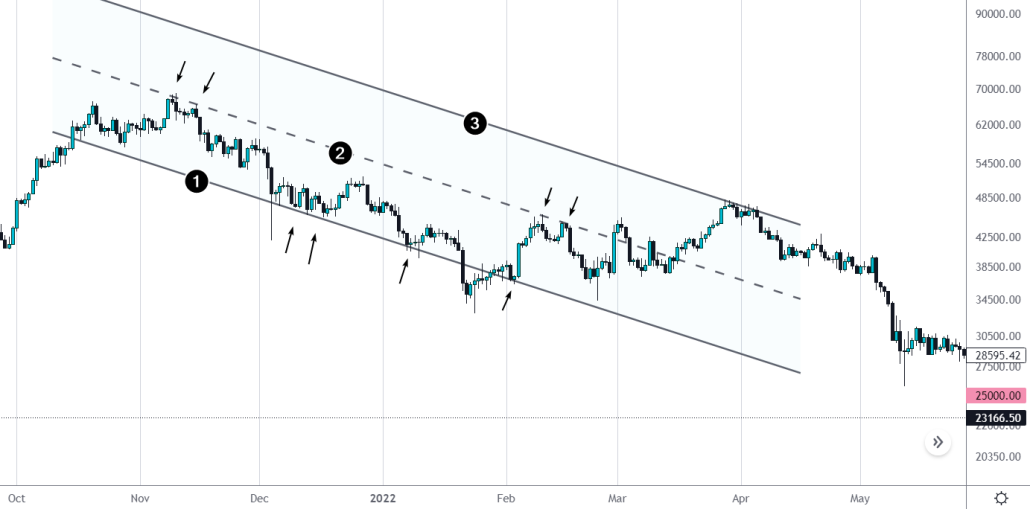
    Advantages and disadvantages

    Like many other technical analysis patterns, the parallel channel has its advantages and disadvantages.

    Advantages

    • it is easily formed;
    • you can enter a position at the beginning of a trend impulse;
    • examples are found in all markets, time frames;
    • reference points for calculating target and a stop-loss.

    Disadvantages

    • the price does not always break through the trend channel in order to test the parallel channel line;
    • there is no guarantee that the trend will resume;
    • a setup for a rebound from the parallel channel line may mean countertrend trading, which carries additional risks;
    • subjectivity in the drawing of initial channel lines.
    It is impossible to completely eliminate risks when trading parallel channels. Or any other patterns. But they can be significantly reduced by using professional instruments for analyzing exchange trading.

    How to improve parallel channel trading with ATAS

    Try to use the following trading plan as a basis:
    Let’s suppose that you have drawn the main channel on the second day, and during the third day you keep watching the market in order to enter a long position during a bounce from the parallel channel line (3). The chart gives confirmation with the delta indicator. Note the three downward arrows. They indicate spikes of negative delta — evidence of market sellers’ activity. Analyze how the price changes in response to this activity:
    • arrow 1 —significant bearish progress, even though the price has closed in the middle.
    • arrow 2 — bearish progress has decreased. The pressure of the sellers is strong, but the price has slightly decreased in response.
    • arrow 3 — progress is insignificant, moreover, the pressure is decreasing significantly.
    All this indicates a shift in sentiment and a possibility that some major trader has set up a wall of buy limit orders to meet the full wave of sells (most likely emotional ones). When sells become exhausted, the appearance of a buyer (marked with the up arrow in the chart above) causes a flexible price increase as the price does not encounter any resistance from sellers. It is curious that there is a characteristic pattern on the market profile in the shape of the letter “b”. The thickening at the bottom confirms the hypothesis that there is power in the market with the intent to “buy everything that sells below 4140”.
    The maximum volume level is formed around 4137. The parallel channel line, which helped prepare in advance for a bullish reversal at this level, passes very close to this area. A coincidence?

    Euro futures example

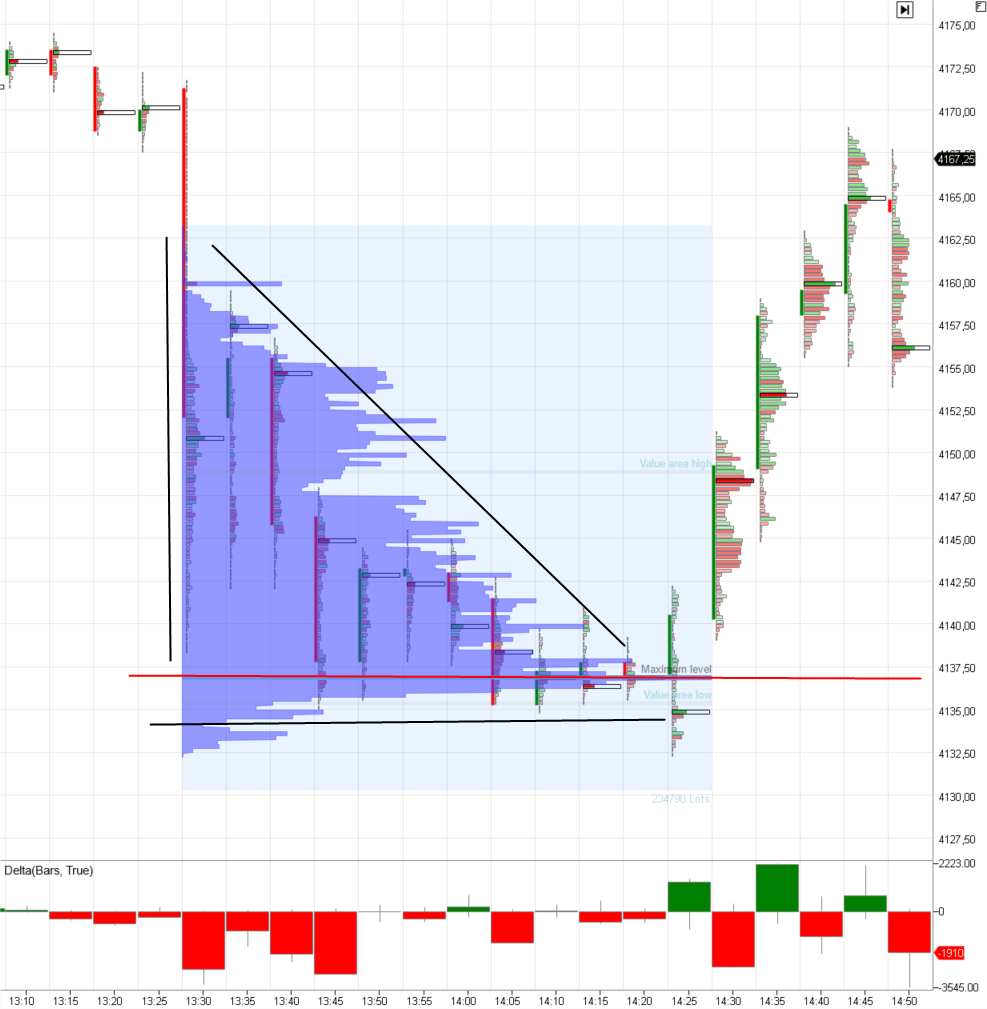
    The price action on the left side of the chart (the evening of the previous day and the morning of the next day) provided information for drawing the main channel (1-2).
    Having drawn it, you can find the parallel line 3 and wait for its test. Let’s have a look at a lower time frame, more specifically, at the moment of testing, which is marked with a circle on the above chart.
    Note that the chart has exactly the same features:
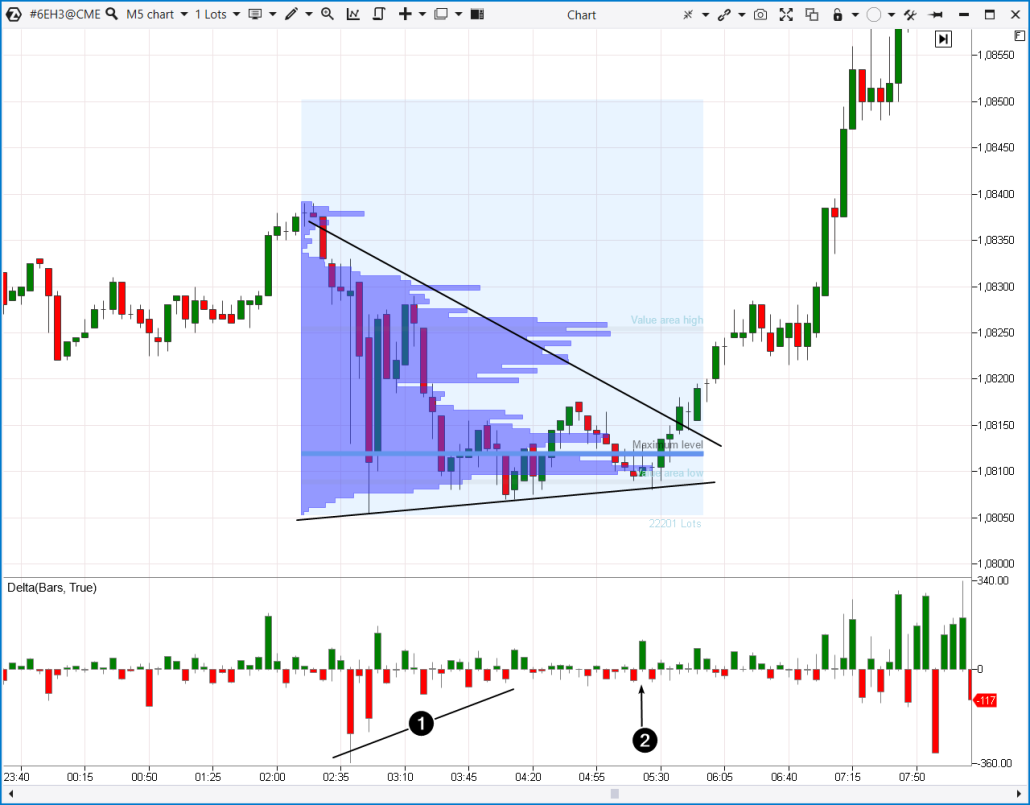
    • thickening of the profile in the lower part: the “dam” of limit buys keeps the flow of market sells;
    • over time, the flow of market sells becomes exhausted (1);
    • a change in delta shows that buyers have become more active (2). The price responds in a cheerful way and skyrockets.
    When to open a position? It depends on luck and personal qualities — patience and willingness to take risks. In any case, you must act systematically and avoid excessive risks. Consider calculating take and stop levels based on the current channel width. To protect the buy, you can set a stop-loss at one third of the channel’s width 2-3. Partial take near the line 2. Sounds like an idea for a trading plan.

    Example from the cryptocurrency market

    The 1-hour chart shows the price action for the BNB token futures market (the data was taken from the Binance exchange). It is easy to draw the main channel line (2). Despite the characteristic “pivots” that abound in such crypto futures and bring some chaos due to false breakouts, support from the channel line is clearly visible. After examining the chart, you can draw a line (1)– a line between1 и 2. The price should react to touching the lines (shown by arrows) as often as possible.
    This will give you the initial data for drawing the parallel channel line (3). It can serve as support after a wave of euphoria in the market, which was caused by a sharp price rise above $310 per token (on the left side of the chart). A lot of traders went long, and now the price can head towards the area of stop-losses set by the traders. Let’s consider the details of touching the line3on the M30 period.
    A sharp change in readings on the delta indicator (1) indicates that buyers became more active after a panic price decline. This is the first sign that demand is present. The presence of demand is then confirmed by tests. The presence of demand is then confirmed by tests(2) and (3)which give reasons to open a long position. It is worth noting that the market profile does not form a well-defined “b” shaped profile in this example. Another interesting feature is a decline (4) that goes under the parallel channel line. But if you give the price some space by placing a stop-loss below the parallel channel line at a distance of one-third or one-half of the initial channel width, you will have a certain amount of freedom to go into an acceptable drawdown and still get profit in the end. In any case, do not risk money that you cannot afford to lose.

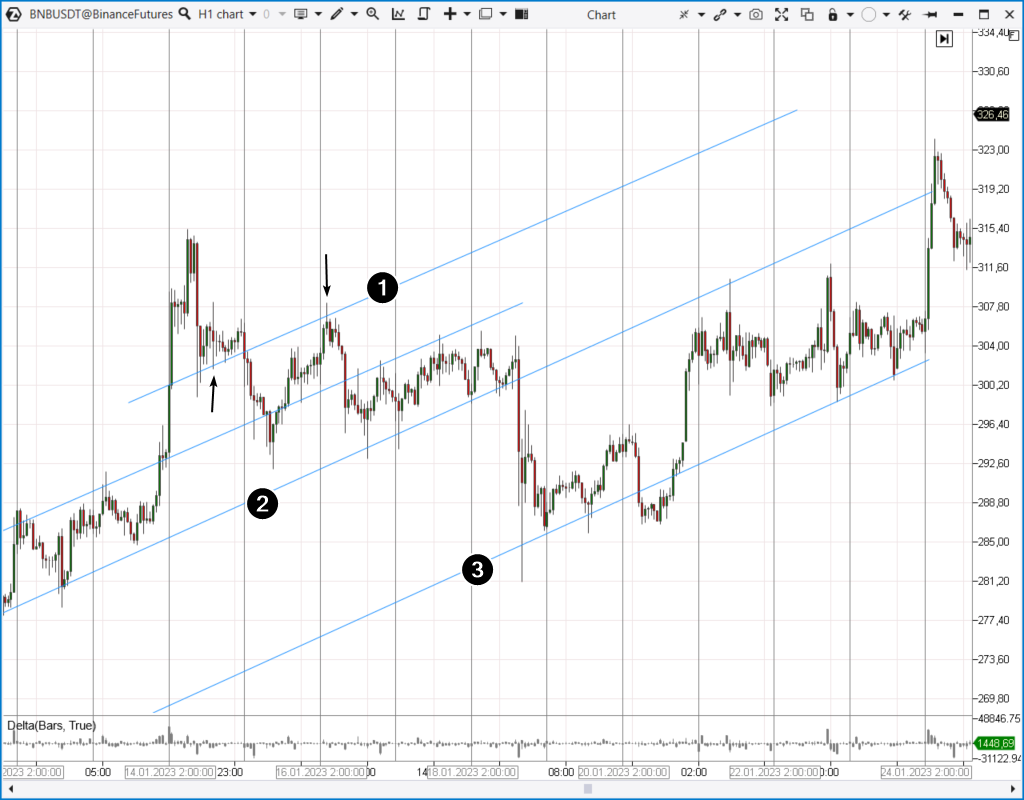
    Tips for beginner traders

    If you are looking for a long position, pay attention to bullish parallel channels. The opposite is true for entering short positions — focus more on drawing descending channels. Follow the rules of capital management and control risks. Practice on history to build parallel channels more professionally. Use ATAS instruments to confirm the market reaction to the parallel channel line. If the number of interactions is high, it indicates the line’s validity. Use ATAS instruments to confirm the market reaction to the parallel channel line.

    Conclusions

    To start parallel channel trading, you can use the following algorithm:
    • Draw the main channel.
    • Draw a parallel line.
    • Wait for the breakout of the main channel and the test of the parallel channel line.
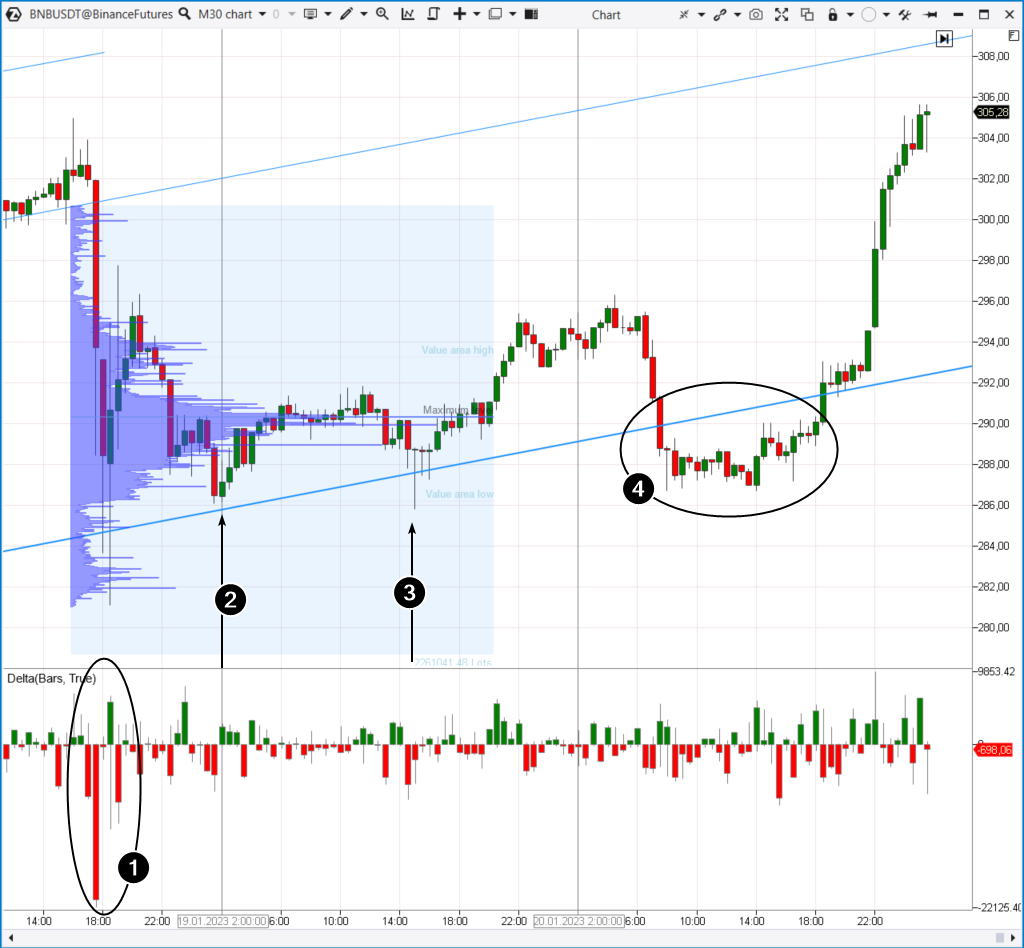
    • Examine the readings of the ATAS indicators to make sure that the line of the parallel channel gives reason to enter a position.
    • Enter the position and control the risks. The price rebound from the line 3 at the panic low and a spike in positive delta (4) confirm the activation of buyers.
    Parallel channels are not the Holy Grail. Do not expect 100% profitable trades. Your job is to keep the odds on your side. And the ATAS platform will help with that. Download Free Trial of the platform — there are at least four good reasons for that:
    1. It is free. Moreover, you will be able to continue using the program even after the 14-day trial period is over, but only for cryptocurrency trading. Moreover, you will be able to continue using the program even after the 14-day trial period is over, but only for cryptocurrency trading.
    2. The platform allows you to download tick history from the futures, stock and crypto markets, therefore, you can be sure that parallel channels give you an advantage.
    3. Market Replay (a simulator for a trader) is built into the ATAS platform,so you will have the opportunity to practice trading without risking real capital.
    4. 4. The platform offers many benefits for traders who want to combine bounce trading with easy-to-use cluster charts anduseful indicators.
    Do not miss the next article in our blog. Subscribe to our Youtube channel, Facebook, Instagram or Telegram where we publish the latest ATAS news.

    Information in this article cannot be perceived as a call for investing or buying/selling of any asset on the exchange. All situations, discussed in the article, are provided with the purpose of getting acquainted with the functionality and advantages of the ATAS platform.

    Did you like it? Tell your friends:

    Examine the causes of price fluctuations in the market

    Start using ATAS right now and capitalize.

    Get started for free

    This site is registered on wpml.org as a development site. Switch to a production site key to remove this banner.