
How companies’ stocks work
Companies’ stocks are securities that give their owners a share in the ownership of the company. Stocks are traded on the stock market, and their price can change depending on supply and demand. Example. Apple is the company with the highest market capitalization in the world. Its stocks trade under the AAPL ticker symbol on the NASDAQ exchange. When you own Apple stock, you own a piece of the company and can receive a portion of the company’s profits in the form of quarterly dividends.Types of companies’ stocks
Stocks come in different types. The most common types of stocks include:- Common stocks give their owners the right to receive a portion of the company’s profits and the right to vote at shareholder meetings.
- Preferred stocks give owners certain advantages. For example, the right to receive a fixed dividend, even if the company is not profitable. Or a greater voting weight in decision-making. Or higher dividends that are paid first. Or other bonuses.
How to start trading stocks
Before diving into stock trading on the exchange, it is essential to address some technical aspects. Below is a clear sequence of steps to follow to start trading stocks on the exchange.Step 1. Find a reliable brokerage firm
In simple terms, a broker acts as an intermediary for buying and selling company stocks on the stock exchange. To elaborate further, a broker performs a wide range of functions:- provides access to the exchange;
- offers information about stocks;
- accepts client orders to buy and sell stocks, relays them to the exchange where these orders are executed;
- ensures the safekeeping of stocks. Brokers can hold an investor’s stocks in their accounts. It relieves the investor from concerns about the safety of their stocks;
- provides customer support and assistance with education.
Step 2. Make a contract with a broker, open an account
You will need to undergo a verification process according to AML and KYC standards. The process of trading companies’ stocks is strictly regulated, and verification is a mandatory requirement.
Step 3. Funding the account
You need to transfer a specific amount of money to your account. This money is necessary for purchasing stocks. Some brokers may set minimum funding requirements. Note that when using leverage, you may have $1000 in your account but be able to buy stocks worth $2000.Step 4. Start trading on the exchange
Choose the company’s stock you want to buy. Submit an order to the broker through the trading terminal to purchase a specific quantity of stocks. The order can be:- Limit. In this case, the purchase will be executed at a specific price that suits you.
- Market. The purchase will be executed immediately at the current price.
How to choose stocks for purchase
To select stocks for purchase, fundamental and/or technical analysis is employed. Fundamental analysis involves studying the financial indicators of the company and its industry. It helps determine how promising a company is. The following things are considered:- financial indicators of the company: revenue, profit, profitability, debt load, cash flows, etc. These indicators enable you to assess of the current financial condition and prospects of the company;
- long-term industry development prospects: demand dynamics, competition, regulations, etc. These indicators help evaluate the stability of the industry in which the company operates;
- competitive position of the company: market share, strengths and weaknesses compared to competitors. These indicators enable you to assess how competitive a company is.
- candlestick patterns and chart patterns: head and shoulders, double/triple bottoms/tops, and other patterns for reversals and trend continuations.
- indicators: various auxiliary tools designed to make decisions based on more detailed information. While analyzing, pay special attention to the interaction between the price and trading volumes.
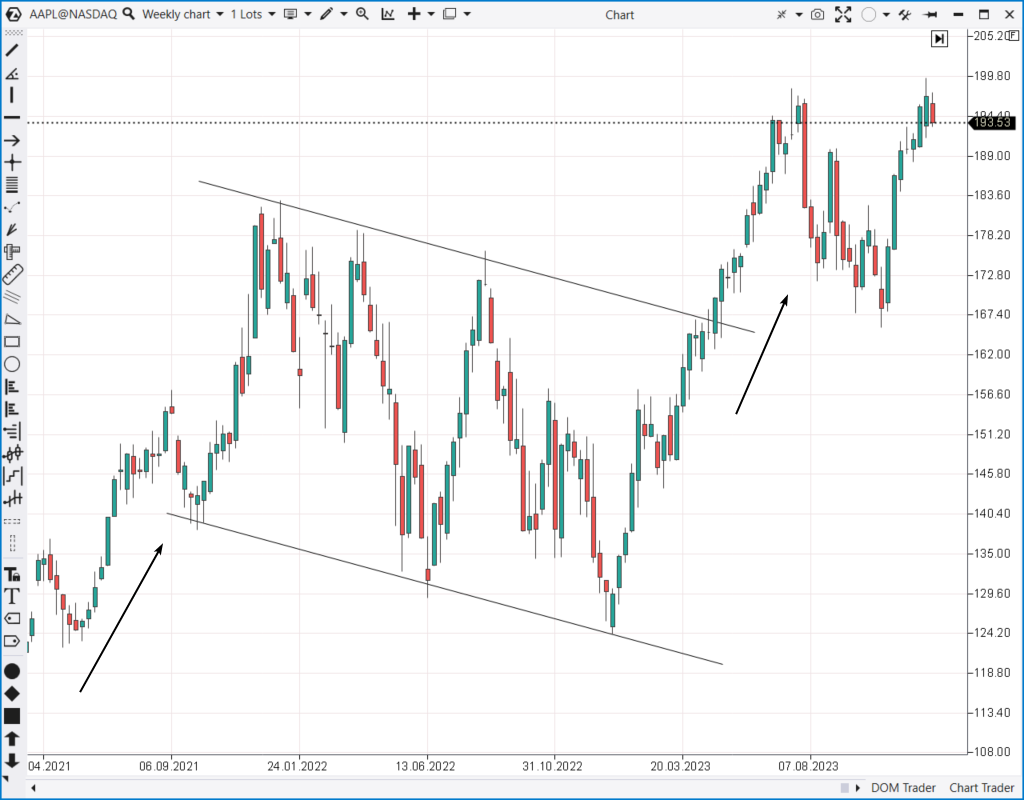
Example: AAPL stock chart 2021-2023
- a surge in technology stocks related to the development of AI;
- the expectation of a rate cut by the Federal Reserve, which is believed to give impetus to the development of companies;
- strong performance data from Apple’s financial reports;
- several other contributing factors.
- the stocks broke through a significant bullish flag, which can be interpreted as a corrective pattern within a long-term bullish trend;
- AAPL stock prices confidently surpassed local resistance levels;
- it exhibited stronger performance compared to the index.
How to analyze a company’s stock chart
A powerful set of volume analysis tools enables analysts to pinpoint entry points more accurately, whether for buying and holding shares over an extended period or for intraday trading.
Example: Daily stock price chart of Apple Inc.
To open the chart, download the ATAS platform, install and launch the program, then: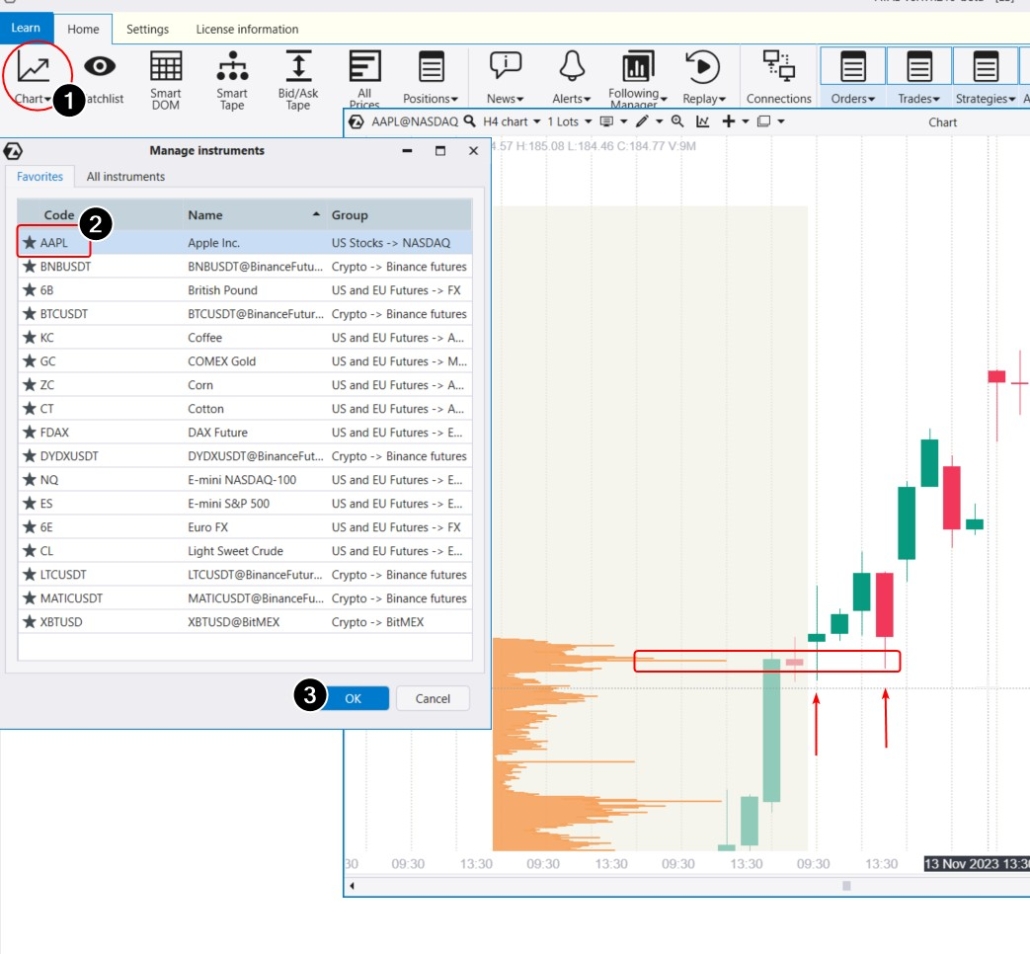
FAQ
Why does a company issue stocks?
Companies issue stocks to raise funds for financing their operations. For example, a company may use the money from the sale of stocks to build a new factory, develop a new product, or expand its business.
What is the point of buying stocks?
The point of buying stocks is to earn a profit as a reward for investing in a successful company.
What does one stock provide?
One stock can give you the right to receive a portion of the company’s profits and the right to vote at shareholder meetings.
How to make money on stocks?
When the stock price increases, you can sell it at a higher price than the purchase price. You can also make money on stocks if the company pays dividends – a portion of the company’s profits distributed to shareholders several times a year. The more stocks you own, the more dividends you receive.
What factors affect stock prices?
Several factors influence stock quotes:
- the overall state of the economy: actions of central banks, inflation rates, unemployment, etc.;
- news about a company’s activities: stock prices can be particularly volatile during the release of quarterly reports;
- technical and behavioral factors.
How to use ATAS for stock trading
Trading company stocks involves high competition. To gain an advantage over other traders, use the ATAS platform – it specializes in analyzing stock volumes on the US (1), European (3), and Russian (2) exchanges.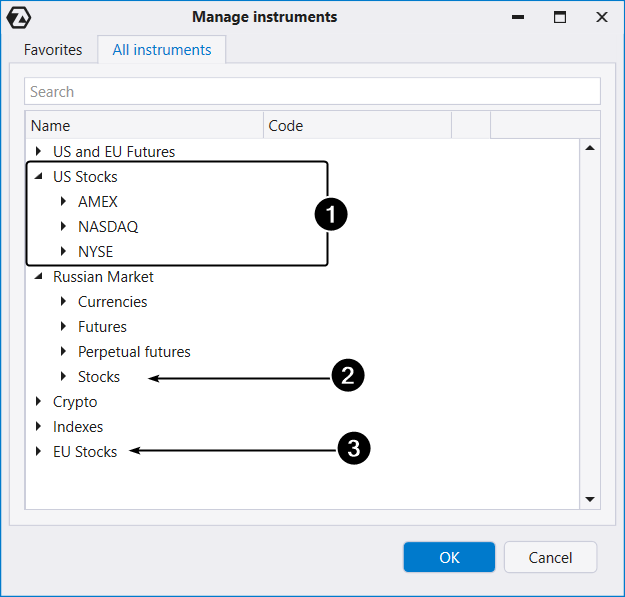
- Indicators. ATAS offers tick-level granularity, enabling market analysis with maximum accuracy. This is particularly crucial and valuable for day traders. Some of the most useful indicators include: Cluster Search, Big Trades, and Speed of Tape.
- Cluster charts or footprints. By accessing information inside candlesticks, you can make more informed decisions compared to traders who only see 1-minute candlesticks. Additionally, you can experiment with different timeframes.
- Working with the Tape and the DOM. Useful ATAS tools for working with Level II and Order Flow include Smart DOM, DOM levels, Smart Tape. Do not forget the indispensable tool for scalpers — DOM Trader.
- Beginner-friendly. The blog, YouTube channel, and Knowledge Base provide specific instructions on setting up and working with charts, applying indicators, developing strategies, and other valuable information for day trading. Additionally, ATAS platform users can rely on responsive customer support.
- Market Replay. You can set up a market simulator to replay historical data and practice trading stocks as if the trades were happening in real time. This way, you gain the necessary experience without risking real capital.
Conclusions
Companies issue stocks to raise funds for financing their business. Shareholders who purchase stocks receive a portion of the company’s profits in the form of dividends. Additionally, trading stocks allows for profits from short-term price fluctuations and serves as the foundation for long-term investments. Download ATAS. It is free. During the trial period, you will get full access to the platform’s tools to experiment with stock trading. Moreover, you can continue using the program for free even after the 14-day trial period is over, whether it is for cryptocurrency trading or volume analysis. Do not miss the next article on our blog. Subscribe to our YouTube channel, follow us on Facebook, Instagram, Telegram, or Twitter, where we publish the latest ATAS news.Information in this article cannot be perceived as a call for investing or buying/selling of any asset on the exchange. All situations, discussed in the article, are provided with the purpose of getting acquainted with the functionality and advantages of the ATAS platform.


