- the Coppock Curve indicator development history;
- the Coppock Curve indicator signals;
- the calculation formula and settings;
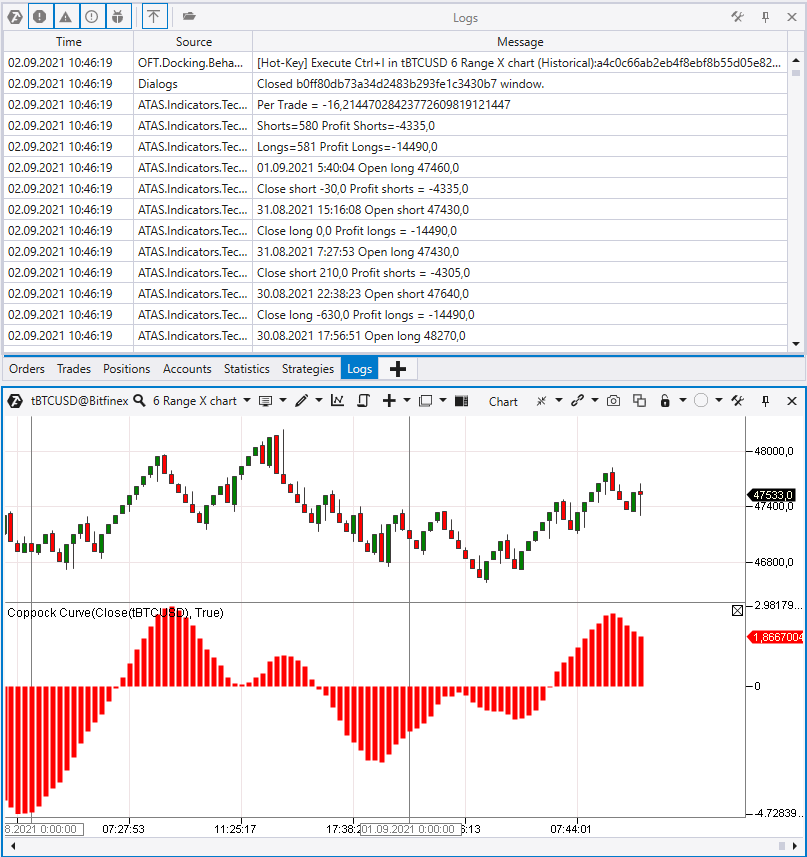
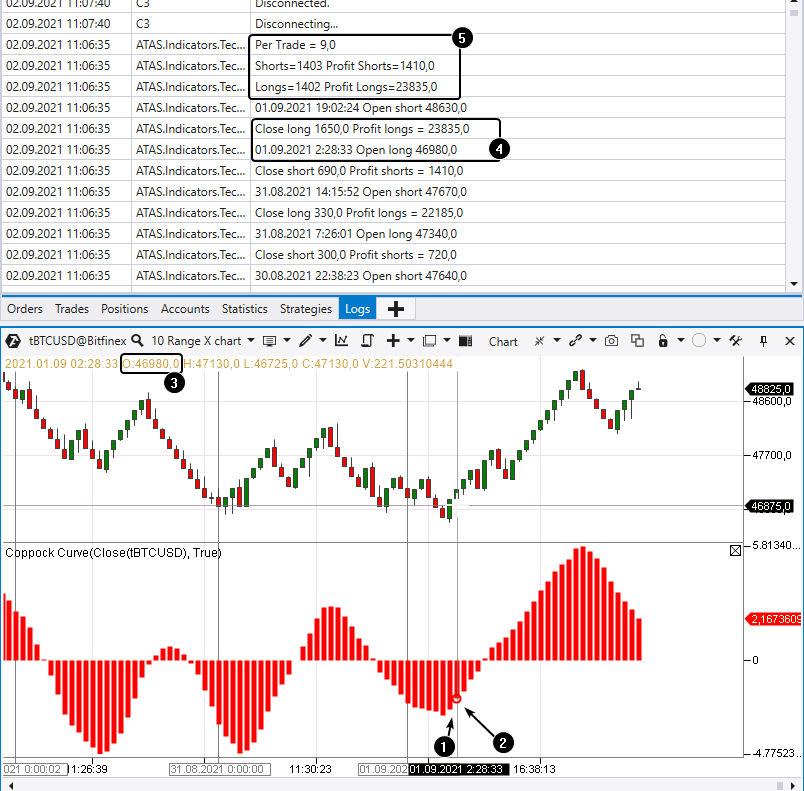
- experiments on assessing trading profitability by Coppock Curve signals;
- advantages and disadvantages;
- comparison of trading by clusters and indicator signals;
- conclusions – what to do in practice.
Brief indicator development history
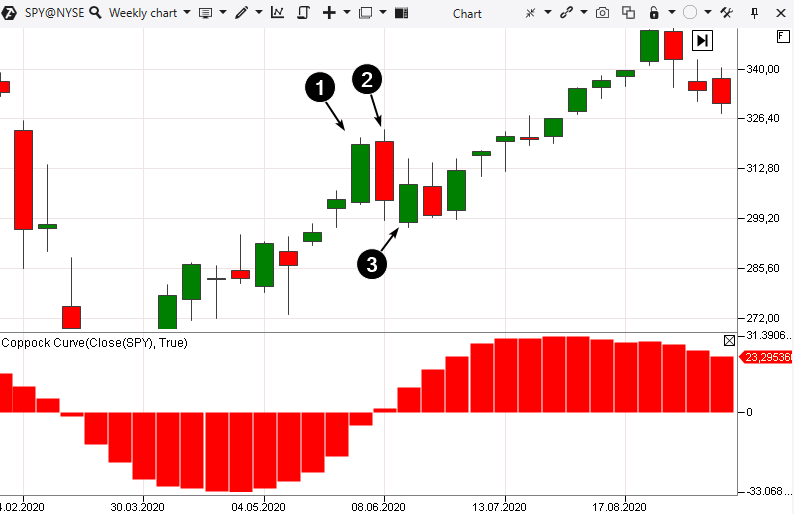
Coppock presented his indicator in Barron’s magazine in October 1965. It is interesting that the indicator development was carried out upon a request of the Episcopal Church, which was interested in a reliable instrument for long-term investors. Coppock Curve is a smoothed momentum oscillator. Despite the fact that Coppock developed it for monthly charts, the Coppock Curve indicator can be used on hourly, daily and even minute charts. The ATAS platform Coppock Curve indicator is in the Technical Indicators section. If you add it to the chart, you will see a wave histogram in the bottom of the window. The example below is the indicator in the S&P index futures chart.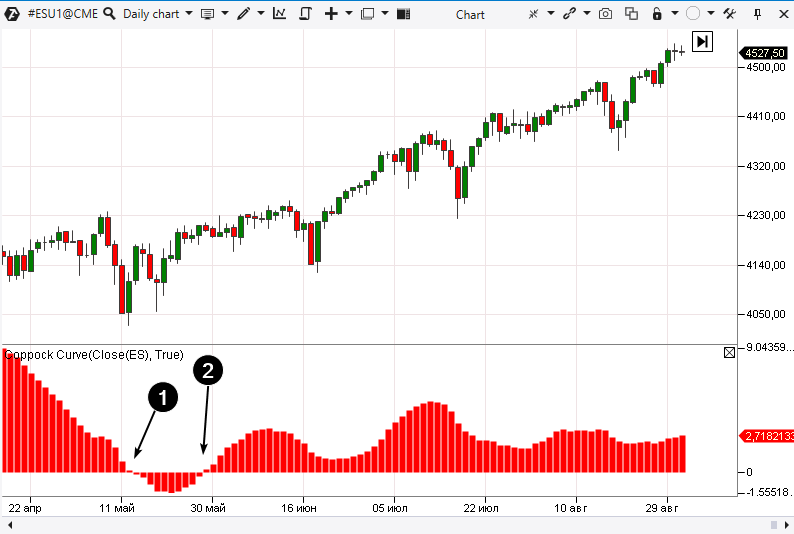
Indicator signals
The indicator signal is very simple. Coppock used the monthly period data for identification of an opportunity to open a long position, when the indicator moved from the negative territory to the positive one (marked with number 2 in the picture above). Although Coppock used his curve only to search for buying signals, many technical analysts consider a shift from the positive territory to the negative one (1) as a signal for opening a short position. Thus, the Investors Chronicle, a British investment magazine, uses the Coppock Curve indicator signals for selling, although it underlines the necessity to treat them with caution. Additional variants of using the indicator:- entering against a trend on the indicator extreme points (a risky undertaking);
- using divergences.
Calculation formula
The Coppock Curve indicator shows the total rate of change (ROC – Rate of Change) for 14 periods and the rate of change for 11 periods, smoothed by the 10-period weighted moving average.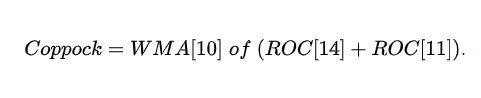
- The How to code algorithms for ATAS article explains in simple words how to do it.
- You can find examples of the Super Trend indicator signal testing in this article.
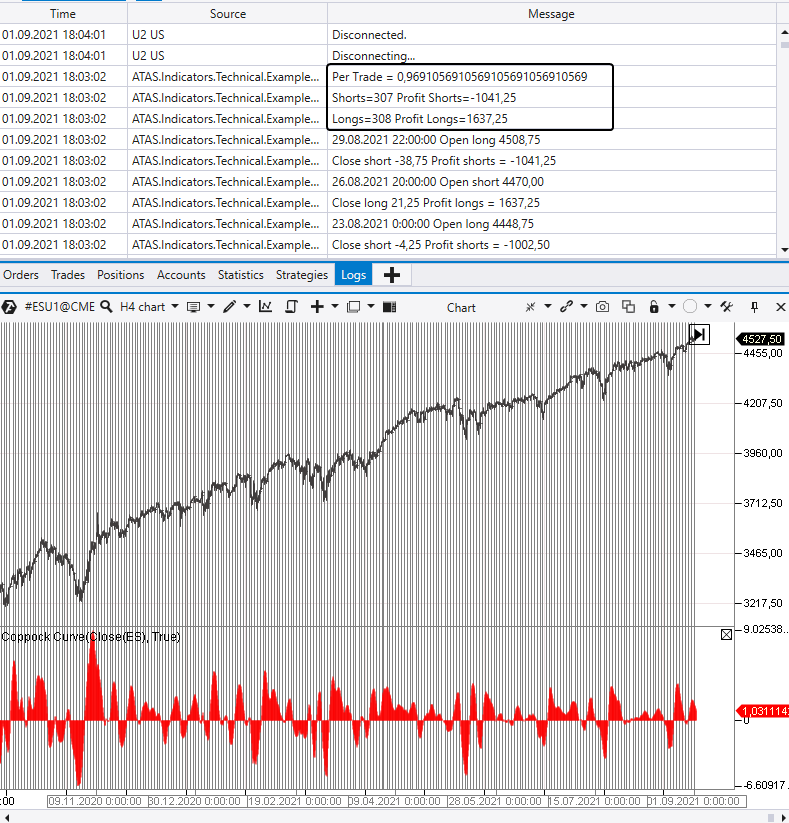
- Simple holding is more profitable than active trading by the indicator signals.
- The market was in the state of steady growth in the chart under consideration. The indicator gives worse results in a flat.
Advantages and disadvantages of the Coppock Curve indicator
The Coppock Curve indicator has the same advantages and disadvantages as many other technical indicators have. Advantages:- simple signals, which can help you to build a mechanical strategy easily;
- it allows catching big trends;
- it doesn’t redraw.
- a big number of false signals;
- trading by the indicator signals doesn’t allow you to count on a serious profit.
Does it make sense to use the Coppock Curve indicator?
The above collected statistics doesn’t mean that the indicator is completely useless. Rely on Coppock Curve only if you are sure that the indicator brings you more good than bad. We recommend you to read more about cluster charts in order to execute more profitable trades. The ATAS platform allows you to work with 25 variants of clusters. Let’s consider an example of how the ability to read clusters can help you in trading in the GBP futures market, and what the Coppock Curve indicator shows in this case. The screenshot below shows the futures tick chart (ticks = 500, scale = 1), and the data are taken from the CME.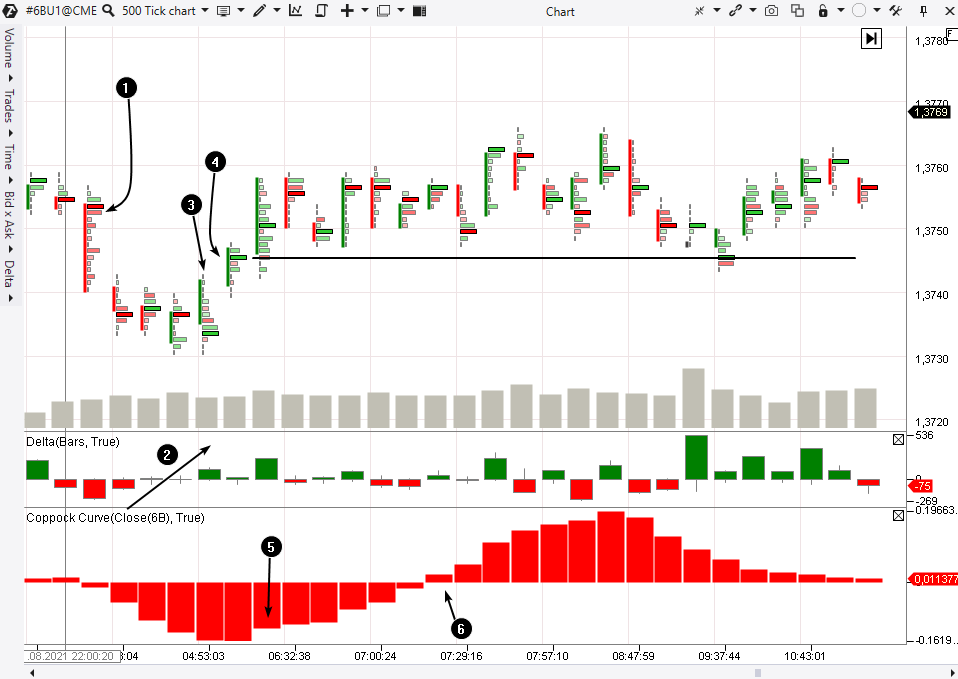
Comparing Coppock Curve and Market Profile
Let’s add the Coppock Curve indicator and daily profiles to an hourly GBP futures chart. The chart covers the market period of September 8-15, 2021. A bullish resistance breakout took place and a range between 1,3800 and 1,3880 was formed in the market during this period. What signals did the Coppock Curve and Market Profile indicators send?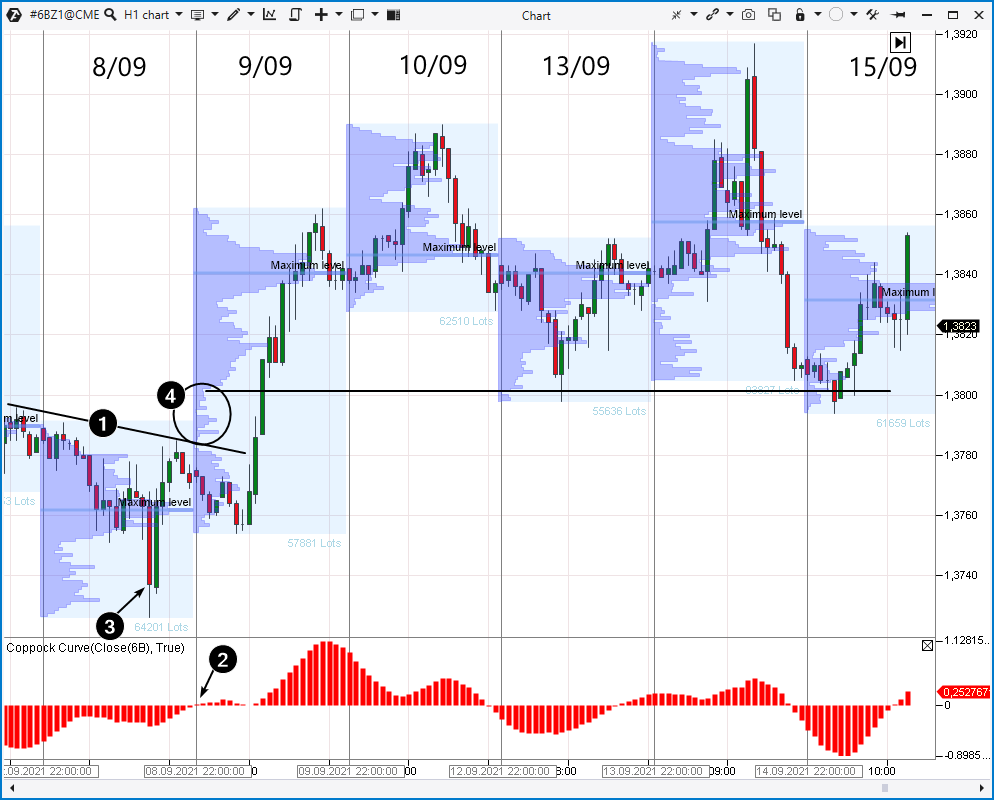
Trading in a range
As you can see, the Coppock Curve sends false signals under flat conditions. However, if you read the Market Profile, you can find entry levels with high accuracy. How? Note that a thin profile was formed when a breakout took place (marked with circle 4). Demand completely exceeded supply, that is why a return to the thin profile territory (near 1,3800) sent a signal to consider an entry into a long ‘on a bounce’. These signals turned out to be true on September 13 and 15. A more detailed application of the profile is presented in the following article with video: Trading by disbalance levels. The profile has the advantage under flat conditions. The final ‘score’ is 2:1 in favour of the Market Profile. Of course, application of the horizontal volume requires knowledge and experience, but you have the ATAS blog for traders and demo account service. Everything is in your hands!Conclusions
The Coppock Curve was developed more than 50 years ago, and it represents a simple smoothed momentum oscillator. The Rate of Change indicator measures the momentum, while the Weighted Moving Average smooths down the data. Our statistics collection experiments show that analysts can make certain efforts and set up the Coppock Curve indicator so that it can provide at least some mathematical advantage in the long run. However, it’s highly likely that it will be ‘eaten up’ by commissions and slippages. If you feel comfortable trading by the Coppock Curve, you can add it to the chart in the ATAS platform. However, in order to increase profitability of your trading, we recommend you to use the functionality of modern cluster analysis and advanced indicators, which operate with prime causes of price movements. Download the ATAS platform free of charge and compare how more efficient cluster charts can be in comparison with classical indicators.Information in this article cannot be perceived as a call for investing or buying/selling of any asset on the exchange. All situations, discussed in the article, are provided with the purpose of getting acquainted with the functionality and advantages of the ATAS platform.