
Inverted Cup and Handle Pattern Meaning in Trading
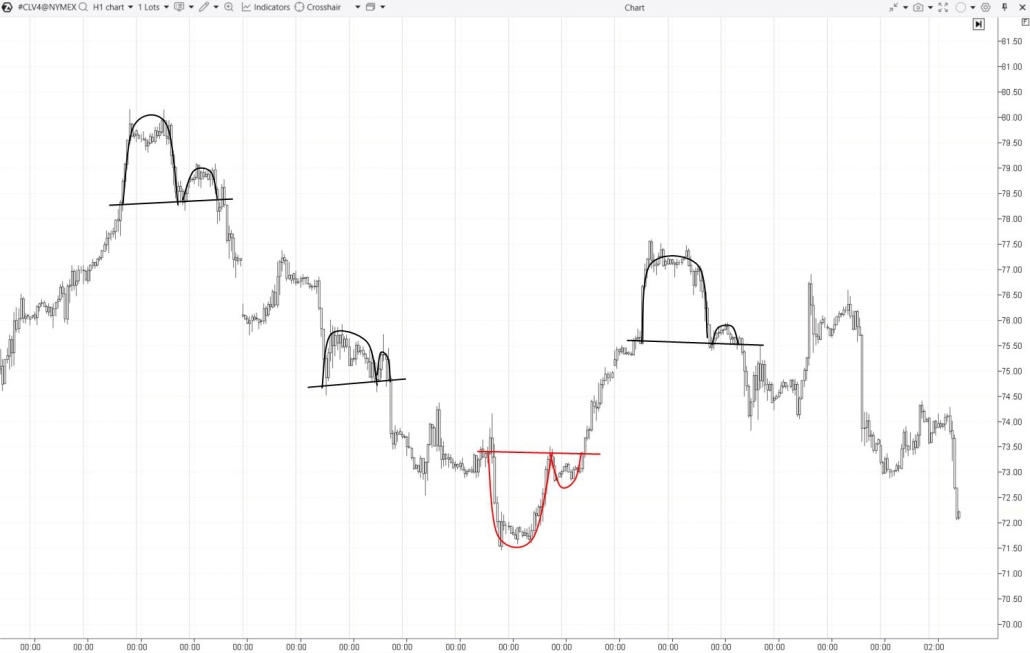
In simple terms, this pattern looks like two inverted “U” shapes, with the second being smaller than the first:- The first part of the pattern is the inverted cup. It represents a period when the price rises initially, but then demand starts to wane, causing the price to gradually decline and form a rounded peak.
- The second part is the handle. This is a minor price rebound after the inverted cup forms. The price bounces off support but then starts to drop again, suggesting a potential break of support and the development of a downward trend.
- The pattern lacks strict rules regarding proportions and shape. The absence of precise parameters leads to uncertainty.
- In real trading, it is rare to encounter a perfectly formed pattern with clear, smooth curves. This creates a dilemma for traders: are they truly seeing an inverted handle and cup or just a similar price movement?
- The rounding may not be as smooth as desired.
- Drawing the “neckline” can be tricky, especially in volatile markets.
What Does the Inverted Cup and Handle Pattern Mean?
The inverted cup and handle chart pattern indicates that supply is taking control. Volume analysis tools help you see this trend in more detail with supporting evidence. Let’s look at the first pattern mentioned above, but using footprint charts and the Market Profile & TPO drawing object. This example of the inverted cup and handle covers 3 days: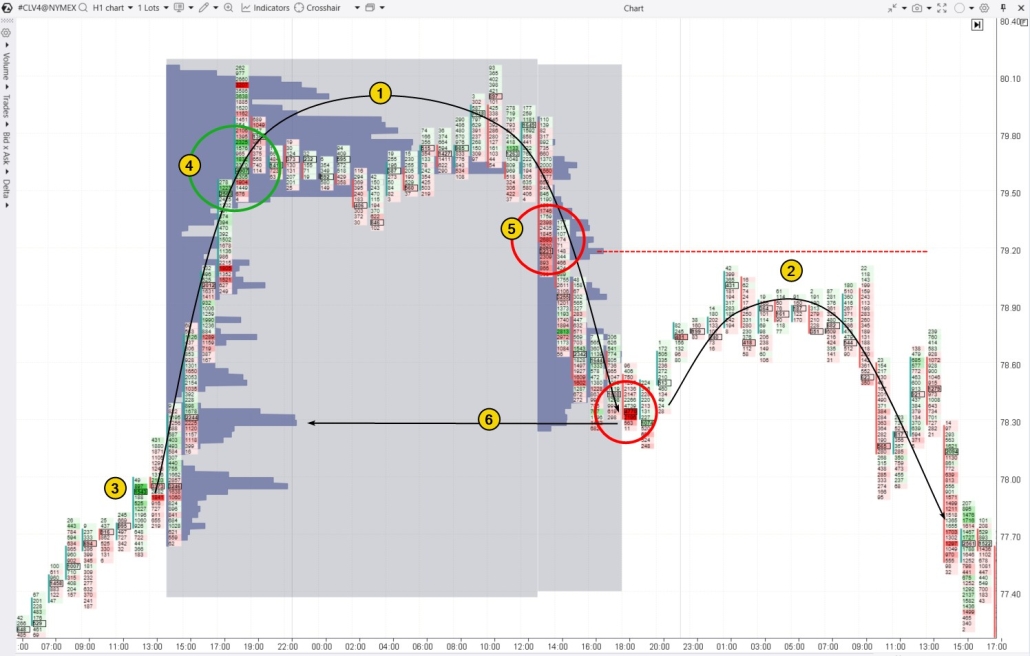
Inverted Cup and Handle Pattern: Trading Strategies
According to classic trading rules, traders follow these steps when trading the inverted cup handle pattern: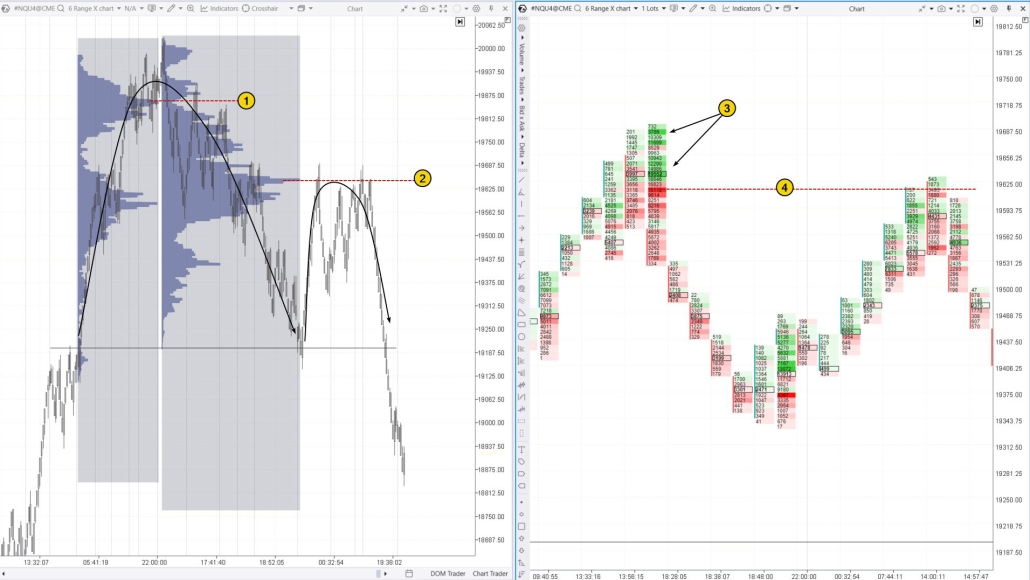
Failed Cup and Handle Pattern
No pattern works with 100% accuracy. The chart below shows an inverted cup (1) and handle (2). Following classic trading rules for this pattern would likely have led to a loss, as there was an impulsive price surge shortly after the neckline breakout.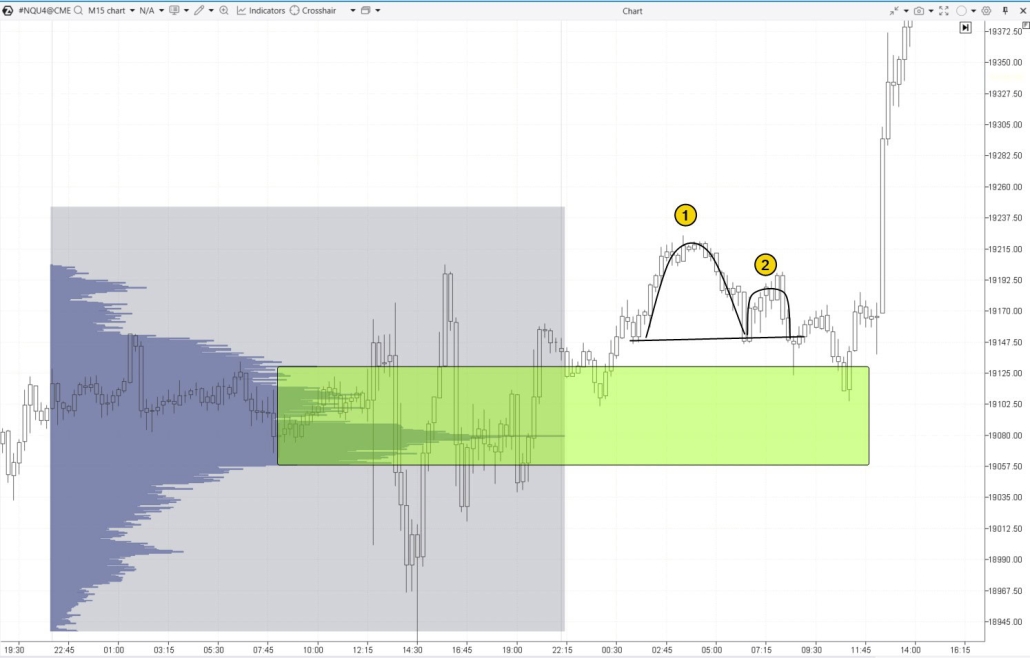
Cup and Handle Pattern in a Downtrend
The inverted cup and handle pattern is a bearish pattern, so trading it during a downtrend makes logical sense. The example below (using British pound futures) demonstrates this:
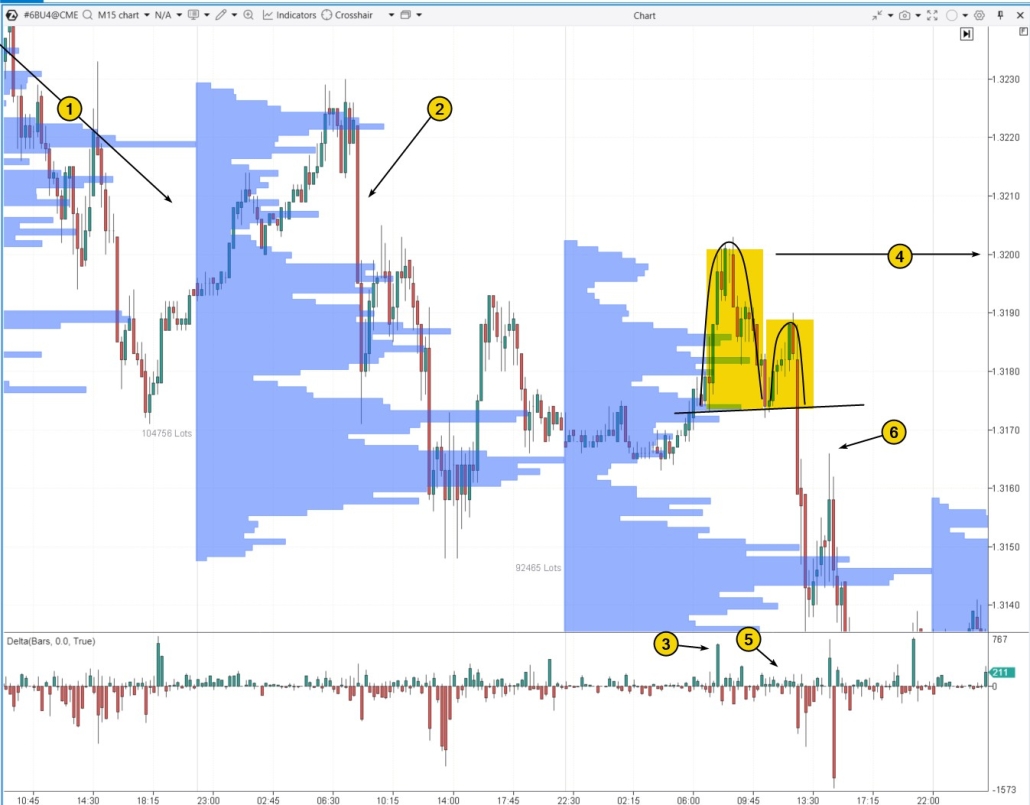
- despite a sharp increase in positive delta (3), the price did not show subsequent upward momentum, which was a bearish signal;
- resistance from the large bearish candle of the previous day was reinforced by the 1.3200 round psychological level;
- the absence of positive delta during the formation of the “handle” confirmed the weakness of demand.
FAQ
What happens after the inverted cup and handle pattern?
After the inverted cup and handle pattern completes, it typically signals the continuation of a downtrend, as the weaker price rebound indicates fading demand. Once the neckline is broken, traders often expect the price to decline, sometimes by an amount equal to the height of the inverted cup.Is a cup and handle bullish or bearish?
While the traditional cup and handle is a bullish pattern, its inverted counterpart is a bearish signal.Can a cup and handle be a reversal?
Yes, but it largely depends on the context. The bullish cup and handle pattern is usually seen as a continuation signal in an uptrend, suggesting a brief consolidation before breaking through resistance. However, in some instances, this pattern can also form in a downtrend, indicating a potential reversal to the upside. The bearish inverted cup and handle pattern, which forms at the market’s peak, is often interpreted as a sign of a downward trend reversal. It is no surprise that the cup and handle closely resemble the well-known head and shoulders reversal pattern.What Patterns Does the Inverted Cup and Handle Resemble?
This pattern is similar to the following patterns:- Dead Cat Bounce. Both patterns show a brief price recovery after forming a rounded top, followed by a significant drop. In the case of the inverted cup and handle, this recovery appears as the “handle.”
- Head and Shoulders (without the Left Shoulder). Both have a central peak (the top of the cup in the inverted pattern) followed by a decline. The key difference is that the inverted cup has a rounded shape without distinct shoulders.
- Double Top. Like the inverted cup and handle, the double top is a bearish pattern signaling a potential reversal. The inverted cup and handle can resemble a double top if you consider the “handle” as the rounded and lower second peak.
How to Learn Trading Chart Patterns Profitably
Using footprint charts and other advanced tools for professional analysis of buying and selling dynamics can offer a significant advantage over traders who rely solely on traditional trading rules. If you want to master trading chart patterns using modern volume analysis tools, the ATAS Market Replay simulator is a great option. It enables you to recreate real market conditions and practice strategies in real time. You can safely explore trading patterns like the “Cup and Handle,” “Inside Bar,” “Piercing Line,” “Shooting Star,” and more, all while using footprint charts and volume analysis indicators. To try the simulator, download the ATAS platform for free, install, and launch it, and then: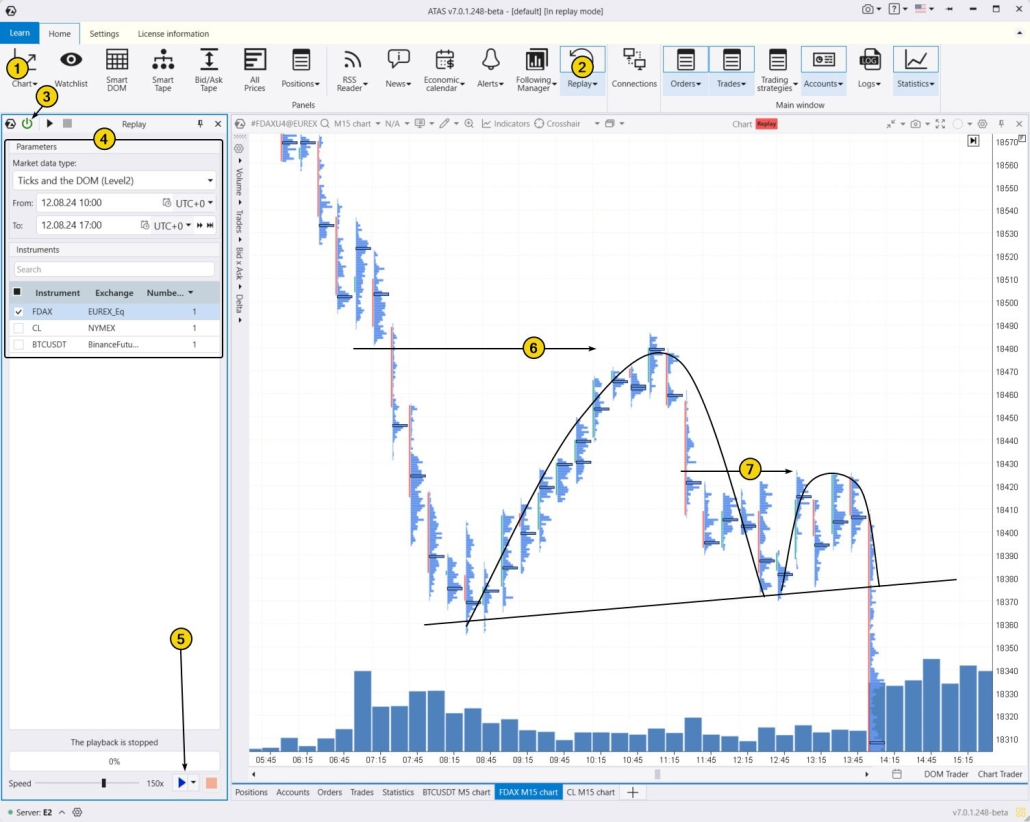
- adjust the playback speed and pause;
- test strategies and track signals from over 400 indicators;
- use Chart Trader and other features to trade on the built-in demo account Replay, and then analyze your performance;
- use drawing objects, for example, mark support and resistance levels;
- use various chart types, such as a non-standard Range XV;
- use exit strategies;
- analyze volumes in the Level II order book, for example, using the DOM Levels indicator, and much more.
Conclusion
Trading patterns like the inverted cup and handle is a subjective approach since these formations are rarely perfect. Their interpretation often depends on the trader’s experience and how much time they have spent observing similar setups.Pros of trading this pattern:
✔ Decision-making becomes more structured and consistent when using chart patterns. ✔ The inverted cup and handle pattern is based on the signs of demand exhaustion, suggesting that seller dominance will push prices lower.Cons:
✘ Subjectivity. ✘ Risk of false signals. ✘ Lack of clear rules for stop-loss and take-profit levels. ✘ An outdated method for trading with basic charts. To increase your chances of success, it is crucial to use modern tools like cluster charts and advanced volume analysis indicators. These can provide clearer, more timely insights into shifts in supply and demand, enabling you to make more informed trading decisions and reduce the risk to your capital. Download ATAS. It is free. Once you install the ATAS professional volume analysis platform, the free START plan is automatically activated. Cryptocurrency trading and basic features will be available to you. You can use this plan for as long as you like before deciding to upgrade to a more advanced plan for additional ATAS tools. You can also activate the Free Trial at any time, giving you 14 days of full access to all the platform’s features. This trial allows you to explore the benefits of higher-tier plans and make a well-informed purchasing decision. Do not miss the next article on our blog. Subscribe to our YouTube channel, follow us on Facebook, Instagram, Telegram or X, where we publish the latest ATAS news. Share life hacks and seek advice from other traders in the Telegram group @ATAS_Discussions.Information in this article cannot be perceived as a call for investing or buying/selling of any asset on the exchange. All situations, discussed in the article, are provided with the purpose of getting acquainted with the functionality and advantages of the ATAS platform.


