
What Does the Megaphone Pattern Look Like on a Chart?
The megaphone pattern usually becomes evident when the price touches the expanding triangle’s boundaries at least five times — three touches on one side and two on the other. However, in practice, the number of touches is not always limited to this sequence. Example. Two instances of the megaphone pattern on a 5-minute gold futures chart: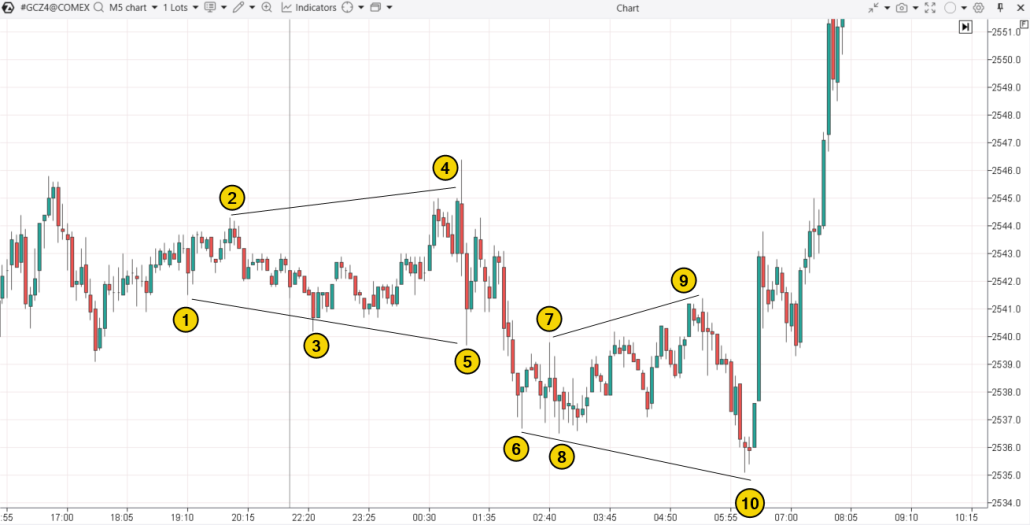
What Is a Megaphone Pattern in Trading?
When interpreting the megaphone pattern, traders should consider various factors that can vary in each situation. These factors include:- Increasing volatility. As the price moves within an expanding range, it often signals an intense battle between bulls and bears for control, particularly amid major economic news releases.
- Uncertainty about the future. The growing swings in price reflect uncertainty among market participants, making this pattern common when the market is unsure of its direction.
- Manipulative nature. In some cases, the megaphone pattern may result from manipulative actions by large players aiming to create the impression of a volatile market to lure traders into false breakouts. After several boundary expansions and false signals, large players might capitalize on the liquidity brought into the market to form their own positions in the desired direction, leaving most smaller participants in losing positions.
How to Identify the Pattern
To identify the megaphone pattern, you can rely on the chart itself. However, using the following tools can make the process easier:- ZigZag or Fractals indicators help make the extremes clearer;
- volatility indicators, for example, Bollinger Bands Bandwidth;
- other tools.
Trading Strategy for a Breakout of the Megaphone Pattern
This strategy assumes that the period of uncertainty has ended, with one side taking control and showing aggression while the other side backs down. An example of a megaphone pattern on a cryptocurrency chart, using BTC/USD data from Binance Futures: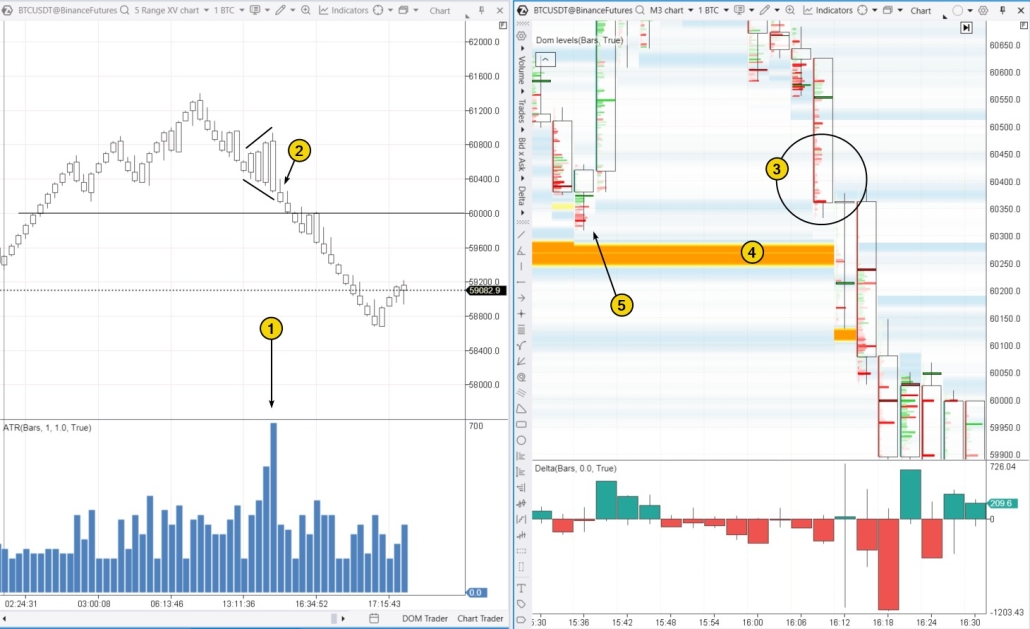
- Context analysis. Notice that the megaphone pattern formed after Bitcoin’s price surpassed the psychological level of $60k. Many traders might have been optimistic about the next target being $70k. However, just because the price breaks a psychological level does not mean it will stay there.
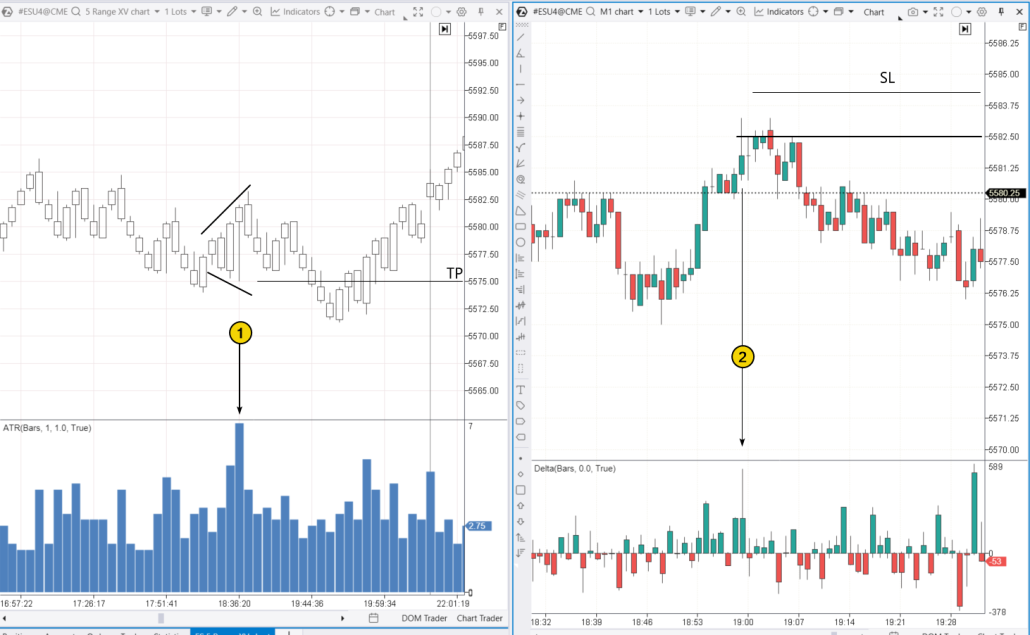
- Indicator analysis on lower timeframes. The footprint chart on the right, with added DOM Levels and Delta indicators, shows seller aggression and buyer weakness (3) as the price approaches a significant buy limit order level (4). This level might have been removed, effectively “opening the door” for sellers to push prices lower. The move above $60k, accompanied by a large buy limit, might have been a strategy by smart money to lure retail traders into emotional buying, setting up a short position.
False Breakout Strategy for the Megaphone Pattern
The next example is from the Apple (AAPL) stock market. The chart below shows two megaphone patterns in a generally bullish market, as indicated by the moving average. Number (1) highlights the volume profile within a candle, which has a normal distribution shape, suggesting a balance between supply and demand. In the following candle after (1), some traders seem to be trapped at the peak. After this, the first megaphone pattern forms, with number (2) marking traders trapped at the lower boundary of the pattern — supporting the idea of an upward breakout.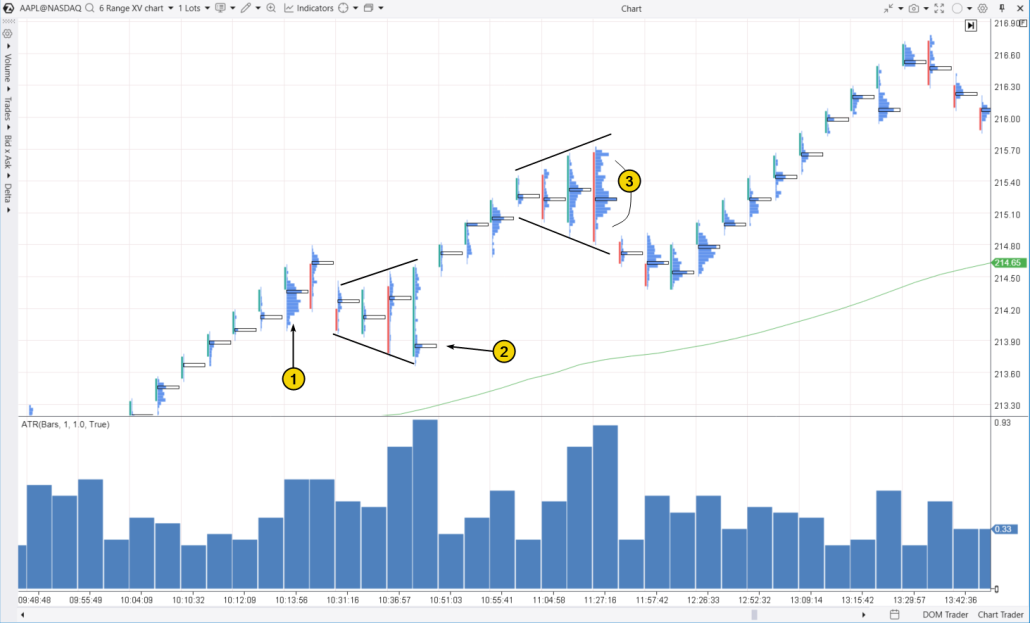
FAQ
What is a megaphone pattern in trading?
In trading, the megaphone pattern is identified on a chart by its widening price swings. This pattern is believed to indicate increasing volatility and potential market uncertainty.Is the megaphone pattern bullish or bearish?
The megaphone can be either bullish or bearish, as it does not inherently suggest a specific market direction. It Is crucial to analyze the context and use additional tools, such as footprint analysis, to gain better insights into future price movements.Is the megaphone a trend continuation or a reversal pattern?
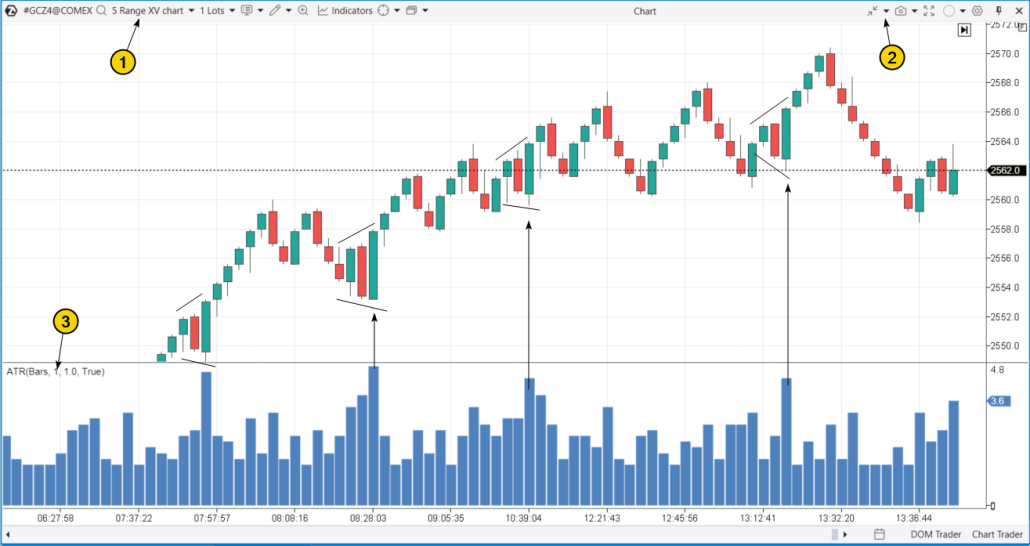
The megaphone pattern can act as either a trend continuation or a reversal signal. On the one hand, the uncertainty suggested by the pattern might be just a temporary correction within an ongoing trend, making the megaphone a continuation pattern. On the other hand, the megaphone often appears at market reversals, as seen in the earlier gold futures chart we discussed. The ATR shows increasing volatility, and the candlestick formations on the RangeXV chart outline the megaphone.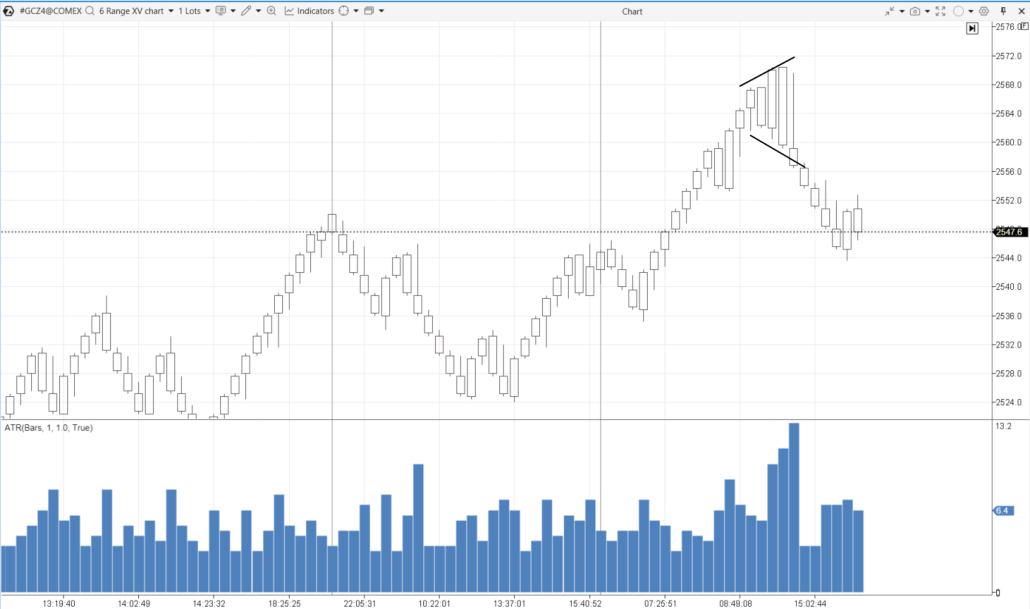
How to trade the megaphone pattern?
Since the pattern itself does not provide a clear indication of the next move, it is crucial to take a comprehensive approach to analysis. Depending on the context and trading volume indicators, you can trade the megaphone pattern either during a breakout of its boundaries or a reversal. You should also consider other factors to make informed trading decisions.How to Learn Trading the Megaphone Pattern
As shown in the examples, the megaphone pattern is ambiguous. It does not provide a clear indication of future price direction and can be interpreted differently depending on the context and additional analytical data. Can you profit from trading the megaphone pattern? To find out, you can simulate trades using the ATAS Market Replay tool. This feature of the ATAS platform uses historical data to recreate real-time trading conditions. It is fast, informative, and risk-free. To try the simulator, download the ATAS platform for free, install, and launch it, and then: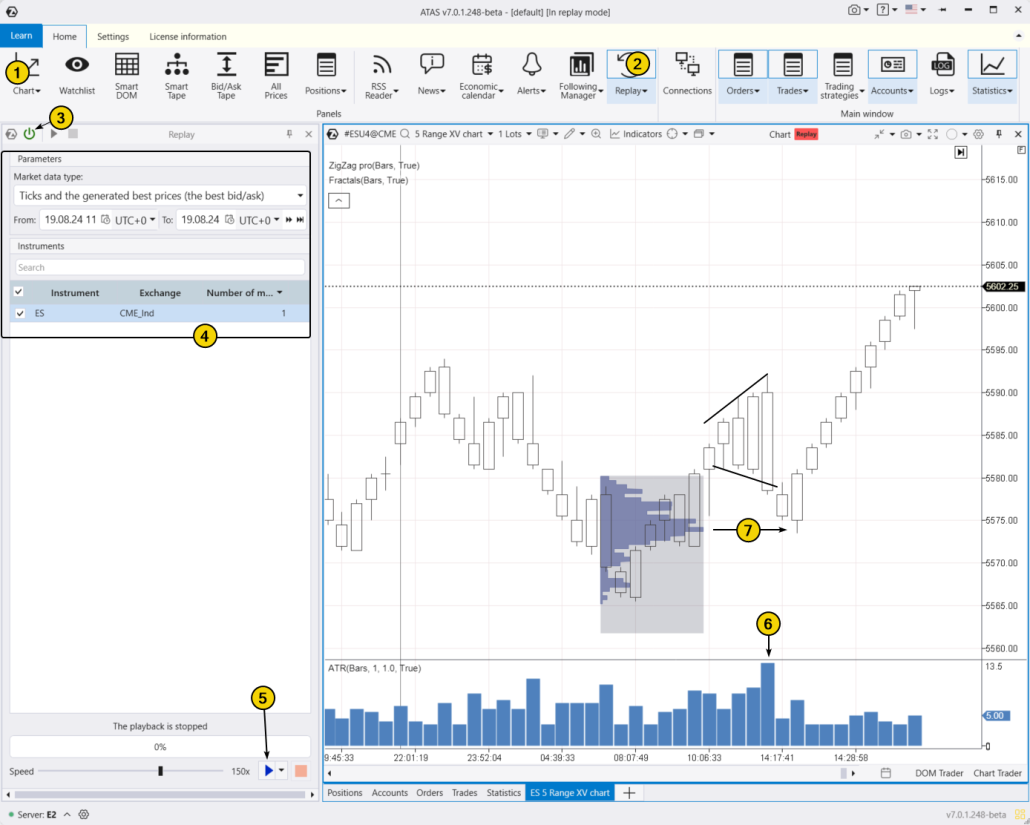
- adjust the playback speed, and pause;
- analyze footprint charts;
- use more than 400 indicators;
- use Chart Trader and other features to trade on the built-in demo Replay account and then analyze your performance;
- use drawing objects, for example, mark support and resistance levels;
- use different types of charts, such as the Range XV, which is particularly relevant to our discussion;
- use exit strategies;
- practice various techniques to spot megaphones and other patterns.
Conclusions
The megaphone pattern was first mentioned by Richard Schabacker in his 1932 book, Technical Analysis and Stock Market Profits. He described it as rare and ambiguous, as it could signal either a market reversal or a continuation of the trend. Those who use advanced volume analysis tools as supplementary information when trading the megaphone pattern may find that footprint patterns offer more reliable and comprehensive data for making trading decisions than the expanding triangle that occasionally appears on the chart. Download ATAS. It is free. Once you install the platform, you will automatically get the free START plan, which includes cryptocurrency trading and basic features. You can use this plan for as long as you like before deciding to upgrade to a more advanced plan for additional ATAS tools. You can also activate the Free Trial at any time, giving you 14 days of full access to all the platform’s features. This trial allows you to explore the benefits of higher-tier plans and make a well-informed purchasing decision. Do not miss the next article on our blog. Subscribe to our YouTube channel, follow us on Facebook, Instagram, Telegram or X, where we publish the latest ATAS news. Share life hacks and seek advice from other traders in the Telegram group @ATAS_Discussions.Information in this article cannot be perceived as a call for investing or buying/selling of any asset on the exchange. All situations, discussed in the article, are provided with the purpose of getting acquainted with the functionality and advantages of the ATAS platform.


