
VSA Upthrusts and cluster analysis
Literally, Upthrust could be understood as ‘a hit directed upward’.Here is a classical Upthrust, which is given as an example by Gavin Holmes, VSA expert and successor of the master Tom Williams, in his book “Trading in the Shadow of Smart Money”.
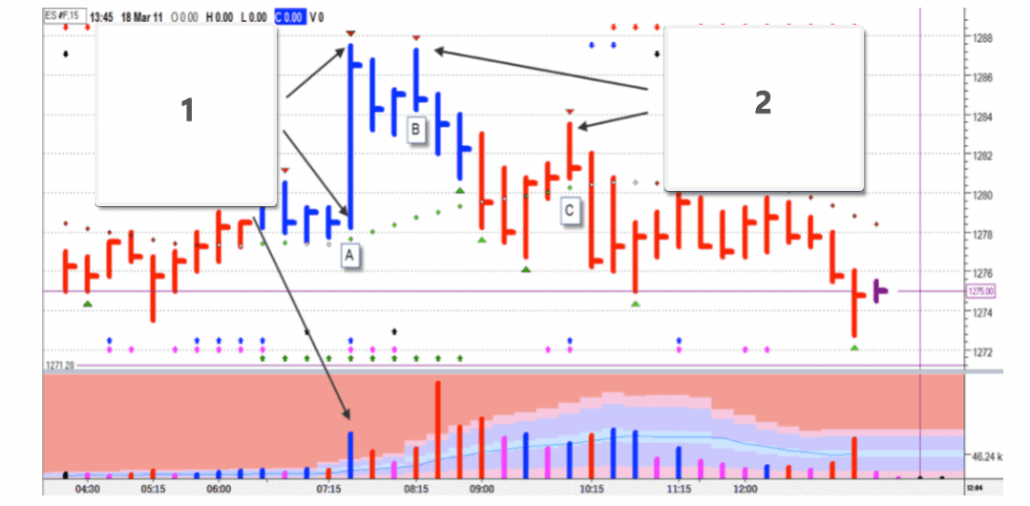
- Note the high volume on this bar. The session has not started yet, this is pre-market. The next bar closed with downward movement, confirming weakness. Tom Williams often said – the market doesn’t like up bars with very high volume.
- B and C bars are up bars. Buyers attempted to break to higher levels but closed on the lows. With the weakness in the background seen in bar 1, these Upthrusts provide reasonable places to enter short.
To better understand the nature of upthrusts, let’s consider a cluster chart.
Upthrust in the cryptocurrency market
Let’s take the cryptocurrency market and a fresh top on the ETHUSD pair, data from the BitMEX exchange.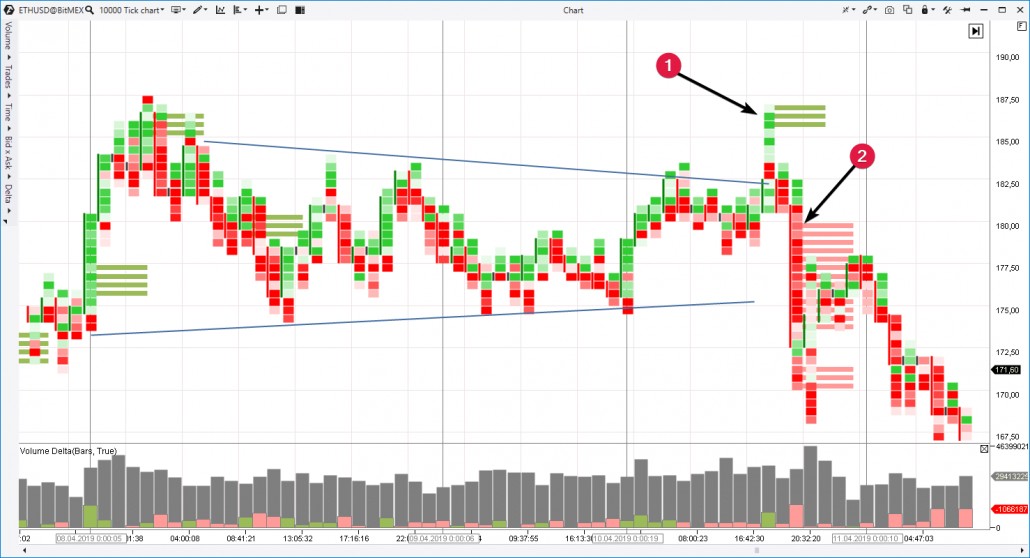
April 8 was an active day. Probably on the release of positive news, at the very beginning of the session, the price broke through the level of 180 dollars per ETH. The splash of buying activity reflects the critical excess of demand over supply at the top of the market, or in other words – unhealthy excitement. This is evidenced by the triggering of the Stacked Imbalance indicator and the prevalence of green clusters. However, by the end of the session, all the “bullish” progress was leveled by a wave of sales (predominance of red clusters). Note: trading in the cryptocurrency markets is going around the clock, and the division into sessions is conditional, on this chart each session lasts from 00 to 23:59.
April 9 was the day of “indecision”. It allowed us to mark the pattern “wedge” (blue lines on the chart), characteristic of the short-term balance of supply and demand.
Am 10. April fanden aus Sicht des Themas des Artikels interessante Veranstaltungen statt:
On April 10, interesting events took place:
- False breakdown of the resistance level. Pay attention to the surge of executed buy orders.The increase in buying activity reflects: a) stop-outs of sellers with close protective orders b) the entry of “breakout buyers” into the trap
- Sellers’ pressure. Genuine supply strength after fake demand. The trap for the “bulls” has slammed shut, and only a small surviving mass of “bears” are seeing profits.
Comparing this chart with the reference standard of Gavin Holmes, we can see that the first half of April 8 was bar 1 which started to form the weakness area; and the combination of cluster bars 1+2 of April 10 indicates the Upthrusts correlating with the bars under figure 2 on Gavin’s chart.
Clusters allowed us to better see the inner mechanics of this phenomenon. Understanding the Upthrust nature is useful for recognizing them as they appear on the right side of your chart.
Upthrust in the oil market
Let’s consider another example of an upcast, this time from the WTI oil futures market. Below is a cluster chart of Range type for CL futures, data from NYMEX (what you need to know about oil futures).Imbalance, Volume, Delta and Cluster Search indicators are activated in the intraday chart of April 9.
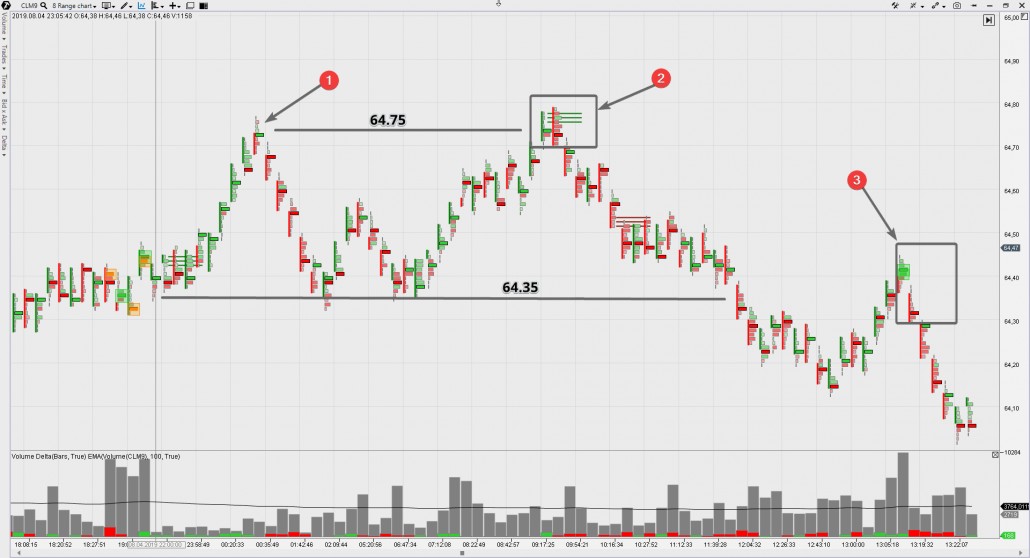
After two bounces from the 64.35 level, the market tried to storm the previous top. Note that:
- the Imbalance indicator was activated;
- sellers appeared immediately, as shown by the red clusters on the next bar. And the price rushed down with increasing total volume, forming an Upthrust, or a false breakout of the previous top.
This is another Upthrust, but VSA experts call it “hidden”. The peculiarity of the hidden Upthrust is that it does not make a false breakout above the local top, but can be formed at the resistance level without a maximum refresh. In this point Cluster Search showed the activity of buyers. Probably, it was the sellers who came out of the shorts and opened positions on the breakdown of the level of 64.35.
How to trade Upthrusts?
Unfortunately (or fortunately), there is no universal approach. Upthrust is one of the tools in a professional trader’s kit. How you personally use it depends on your trading style, personal risk profile, chosen markets, and other factors.To avoid empty talks, let us consider a specific idea.
Let’s assume that an oil trader has recorded the formation of an Upthrust consisting of two bars above the level of 64.75 at point 2. He enters the short after closing the second bar, say, at the price of 64.67. He puts a protective stop behind the top of the Upthrust at the level of 64.84 (17 pips).
Where to place the takeout? The trader reasoning is that if he fixes a false upside breakout, the price is not ready to go above resistance. A breakdown of support should be expected. In classical technical analysis there is a thesis that after the breakdown of the range, the price is ready to pass the distance equal to the value of the broken range with a high probability.
Then take profit level TP = 64.35-(64.75-64.35) = 63.95, or 72 pips from the entry point into short at 64.67. Risk to reward ratio = 1:4. Quite a working idea, isn’t it? By the way, the oil price in this particular case reached the take-profit level 4 hours after the Upthrust.
Such setups are not rare and as a bonus – below are 2 charts from the GBP futures market without detailed comments.
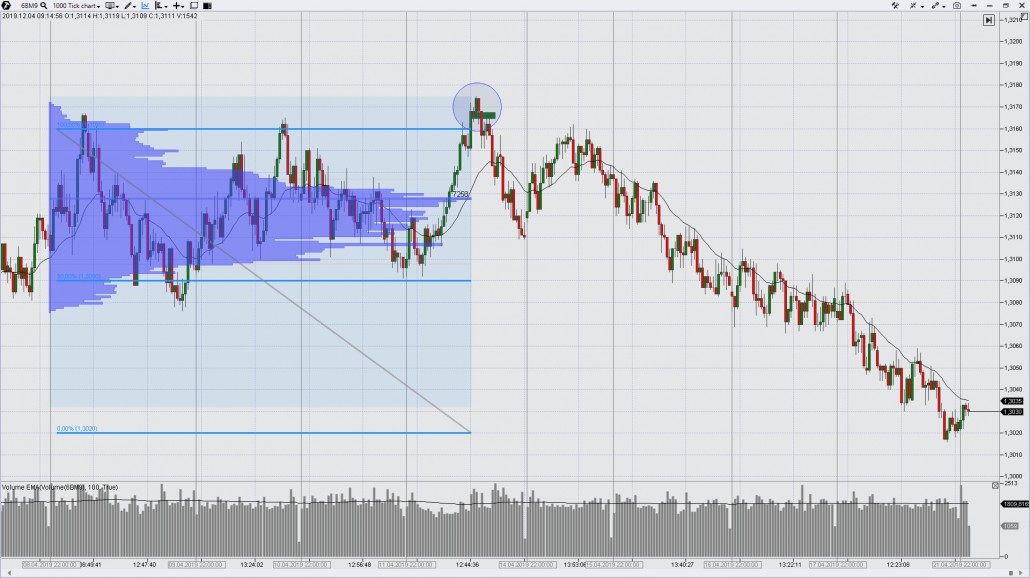
- formation of the range 1.3160-1.3090;
- false breakout – Upthrust. Note the triggering of the Imbalance indicator;
- bearish breakdown of the range;
- reaching the target at 1.3020. The target is calculated according to the principle stated above.
The second example is a moment of Upthrust in details on the cluster chart:
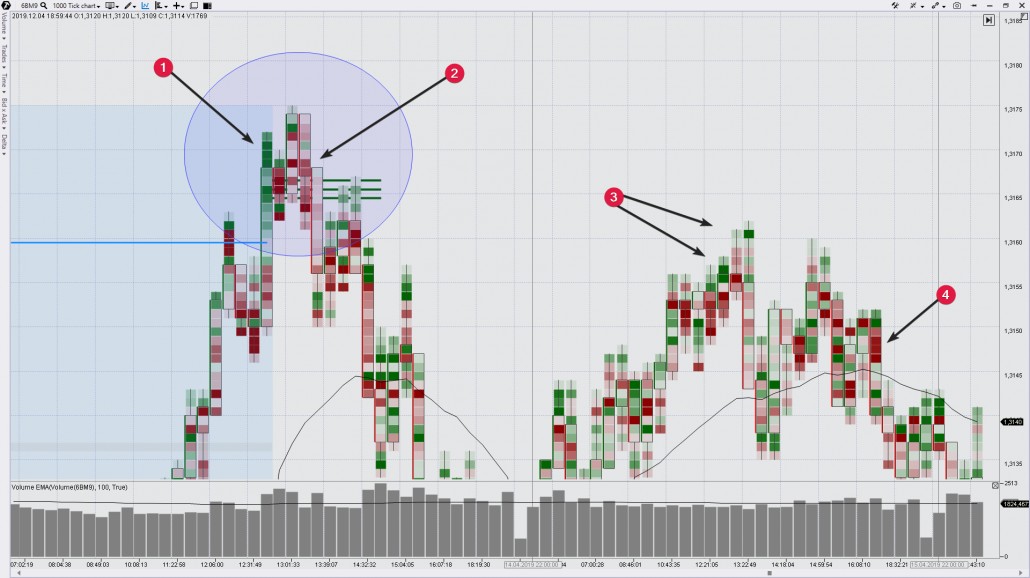
- Activation of “bears” stop-losses and entry of “bulls” trading breakouts.
- Professional Selling. 1+2 impulses form an Upthrust.
- Upthrust test the next day.
- Professional Selling.
Figure out where the entry to the short might be, and calculate the risk-to-reward ratio. You should like it. Download ATAS, there may be a favorable set-up based on an Upthrust forming right now.
Upthrust. Summary
- Price rises quickly but then falls to close the bar at or near the lows. The bar resembles a telegraph pole.
- An Upthrust usually occurs with a wide or medium spread.
- The Upthrust is a profitable maneuver by market makers to catch the stops of those in short positions and set a trap for those who are careless in buying.
- Prices often rise at the opening of the session and after the release of good news.
- High volume indicates selling by professionals, while low volume shows their lack of interest in a price rise.
- True Upthrusts occur when there is weakness on previous bars. For example, logical places for an Upthrust are the end of a distribution phase or a test of a resistance level.
- Upthrusts occur on all types of charts, different timeframes, and markets.
By the way, Upthrust is one of the most favorite signals of a VSA expert Sebastian Manby.
We hope that everything is clear with upthrusts. Let’s move on to the shakedowns.
VSA Shakeouts and cluster analysis
The term is self-explanatory. It reflects what takes place behind candle formations. Big players often use it to shake out weak holders from a promising bull market.Like Upthrusts, Shakeouts are found on all types of charts, timeframes, and markets. The classical VSA pays a lot of attention to Shakeouts, because they are so typical for stock markets, where Tom Williams, the creator of Volume Spread Analysis, traded.
Below is a weekly chart of the Dow Jones Index and a classic example of a Shakeout. It is indicated by the first arrow.
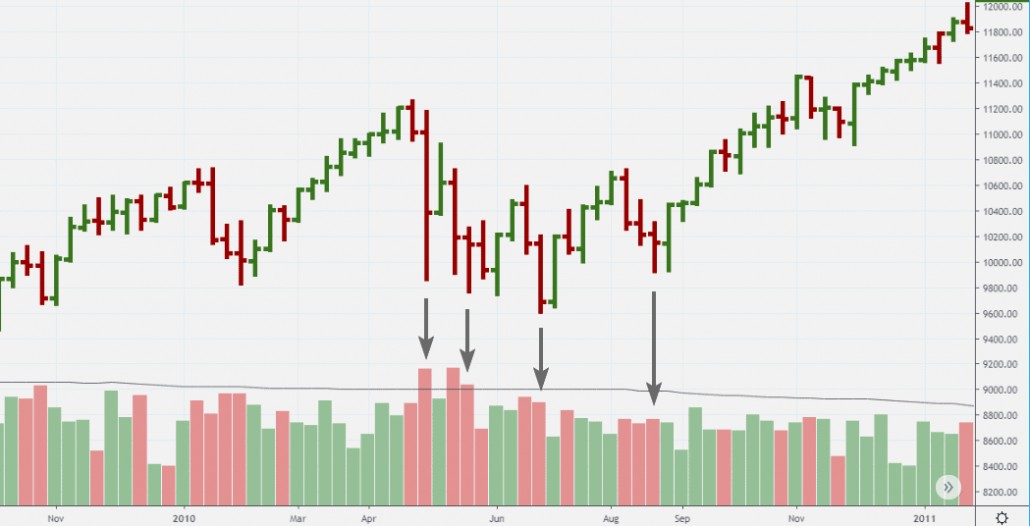
“What does this mean?” – Gavin Holmes asked Tom Williams, showing a chart of price and volume. “A giant Shakeout,” -replied the VSA founder. He had seen a lot of Shakeouts in his career.
That fall was dubbed Flash Crash, and it became a household name. If you Google Flash Crash, you’ll find a whole library of potential Shakeouts.
Idea of the VSA Shakeout
A Shakeout is formed in a strong market to reduce the number of followers capitalizing on the rising price of an asset. An unexpected and accelerating drop in price, like a thunderclap, stimulates many small traders to panic sell off existing positions. To the flow of sales is added a lot of stop-loss buyers. This avalanche of sell orders for assets falling in price is a good chance for professional traders who know that the current situation is a temporary manipulation.Exhaustion of selling pressure indicates that the process of securities ownership change is nearing its end. Majority of minor traders passed over their assets into the hands of professional players in panic.
Let us consider several Shakeouts using the cluster analysis instruments of the trading and analytical ATAS platform.
Example. Shakeout in the gold market
Let’s take a cluster chart of the gold futures, day period. We also recommend to read the article “5 things you should know about a gold futures“.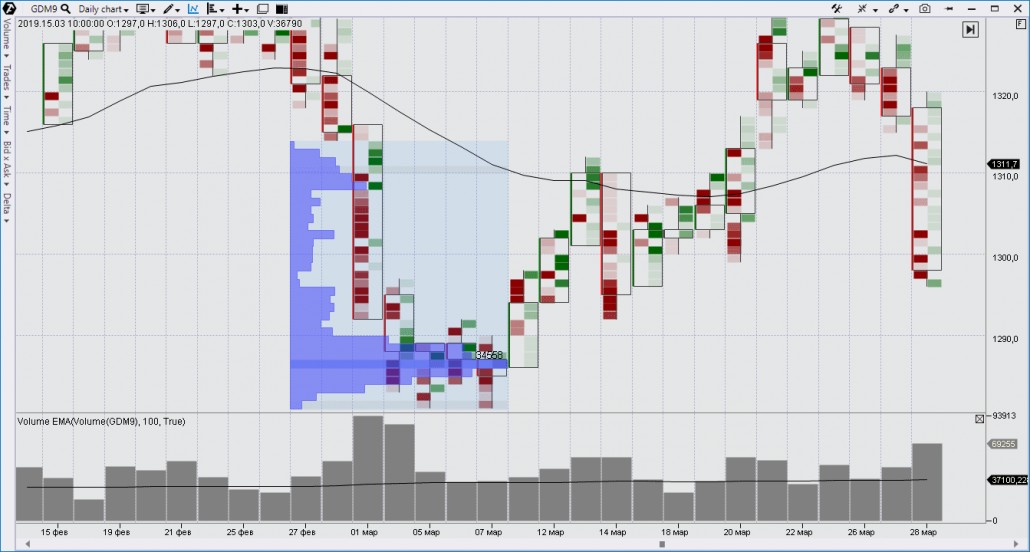
Such a rapid fall on the negative information background formed a psychological pressure on traders, which lasted the whole weekend. Already on Monday, having seen the signs of continuation of decline, traders gave up and began to sell gold, opening shorts, and close longs.
However, what we see in the chart.
On Monday the trading volume was 2 times higher than average, although the “bearish” progress was not so dramatic (what is bag holding). Clusters show the appearance of buying (green “bricks” under the level of 1290). This hidden strength was confirmed by the absence of declines on the 5th and 6th. The bears’ attempt to resume the downward dynamics on Thursday, March 7, showed the absence of offers (what is No Supply). And already on Friday, March 8, gold started to recover the fall on growing volume, which is a bullish indication (but not on extreme values).
Notice the profile shows a burst of activity below the 1290 level. Probably, these volumes reflect the transition of “gold contracts” from the hands of weak holders to the pockets of professionals.
The growth continued the next week from March 11. Thus, the cumulative behavior of the market in the first half of March gave us one big Shakeout with a false break of psychological level of $1300. By the way, the bar on March 14 has every reason to call itself an intraday Shakeout.
Example. Shakeout in the cryptocurrency market
When the cryptocurrency market is on the rise, a VSA analyst is very likely to find shakeouts in the lower timeframes. Let’s take the 4-hour chart of BTC. Mid-April 2019 shows a pattern that we are entitled to consider as an example of a Shakeout.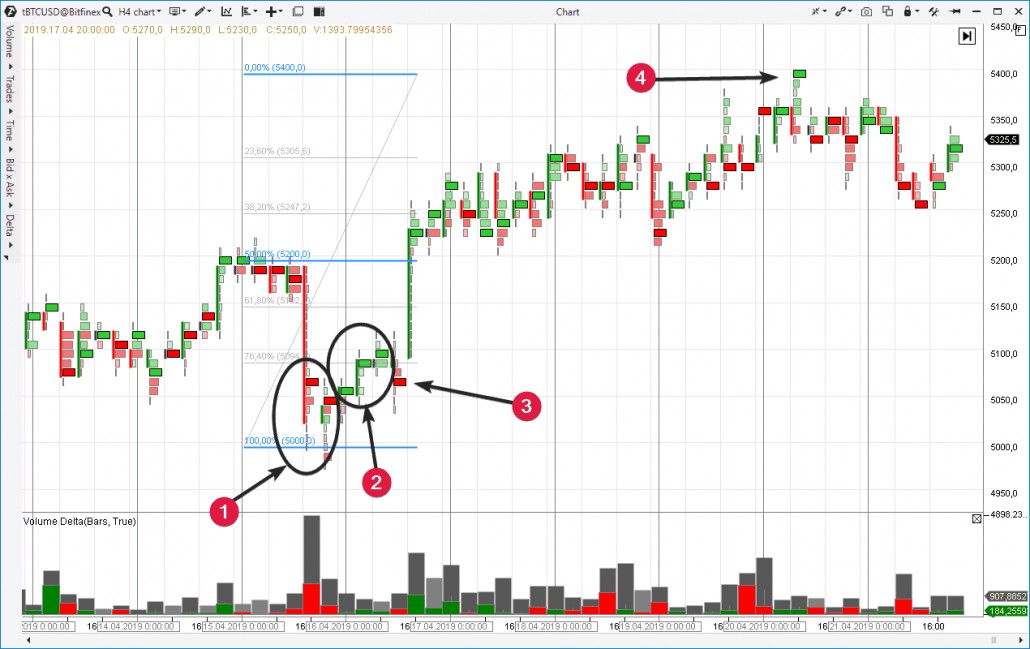
However, the next day, after a false breakdown of the round level 5000, which marked the bottom of the Shakeout, the clusters turned green. We see a preponderance of BUY orders being executed on the exchange (2). This is a genuine demand from professional traders who see upside potential in the short term. We received a VSA Shakeout covering 2 days.
Indeed, after a small trap for bears (3), the coin price rapidly exceeded the Shakeout high and settled above the level of 5,200.
How to trade Shakeouts
We do not make guaranteed recommendations that shakeout trading will make you a lot of money fast. Trading is a highly competitive business, and profits are not easy to come by. Nevertheless, in order to increase the practical value of the material, here are some common sense rationalizations.When you feel that the panic dried out and the chart confirms entry of buyers, you have new opportunities for entry into longs in harmony with professional traders.
If you bought at the level of 5,050, your protective order can be set under 5,000 – this area was already cleaned up from buyer stops and a probability of a lightning strike into the same place is not high.
The target is the size of the Shakeout deferred upward from its maximum. This is the same logic that was described for Upthrust but in a mirror image. We get a take level of 5200+(5200-5000)=5400 and a risk-to-reward ratio of 50:150, or 1 to 3, which is acceptable in trading as a classically recommended proportion.
Note that the Take Profit was reached (4) on April 20.
Summary
Upthrusts and Shakeouts, in fact, are meant to demonstrate a fake direction of the market movement.Upthrusts start as seemingly strong upward rushes, fast, on high volume. However, later, buyers discover that they made an entry into longs at the very top of the market.
The opposite is similar for Shakeouts when sellers understand that they threw away a really strong paper at a low price under the pressure of emotions and news.
Don’t let the insidious market fool you. Download ATAS, and use the clusters. With them, volume analysis and VSA patterns application become more efficient because the program provides you with a convenient form of trading activity data divided into buying and selling at each level. Using ATAS, you will be able to build your profit strategy where others exit at stop losses.
Information in this article cannot be perceived as a call for investing or buying/selling of any asset on the exchange. All situations, discussed in the article, are provided with the purpose of getting acquainted with the functionality and advantages of the ATAS platform.


