
In trading, an inside bar is a pattern where a candle is fully contained within the range of the previous candle (bar). The high is lower than the previous bar’s high, and the low is higher than the previous bar’s low.
Low of the previous bar < Low and High of the current bar < High of the previous bar
An inside bar often signals uncertainty or a temporary balance between supply and demand. Traders use it to enter positions when the price breaks out of the inside bar’s extremes, hoping to catch the beginning of a new trend.
What Is an Inside Bar in Trading?
An inside bar often appears after a significant price movement and signals a period of consolidation, indicating that market participants are uncertain about the future direction.
Example of the inside bar pattern. On the left side of the 4-hour BTC/USD chart, you can see five inside bars marked with arrows. These bars are completely contained within the high and low of the previous bar.
Let’s look at the first instance more closely:
- An inside bar resembling a bearish candle appeared after a drop in Bitcoin prices.
- It suggests that bearish pressure might be weakening.
- The next candle provided a chance to go long on a bullish breakout above the inside bar’s high, around the 53,200 level.
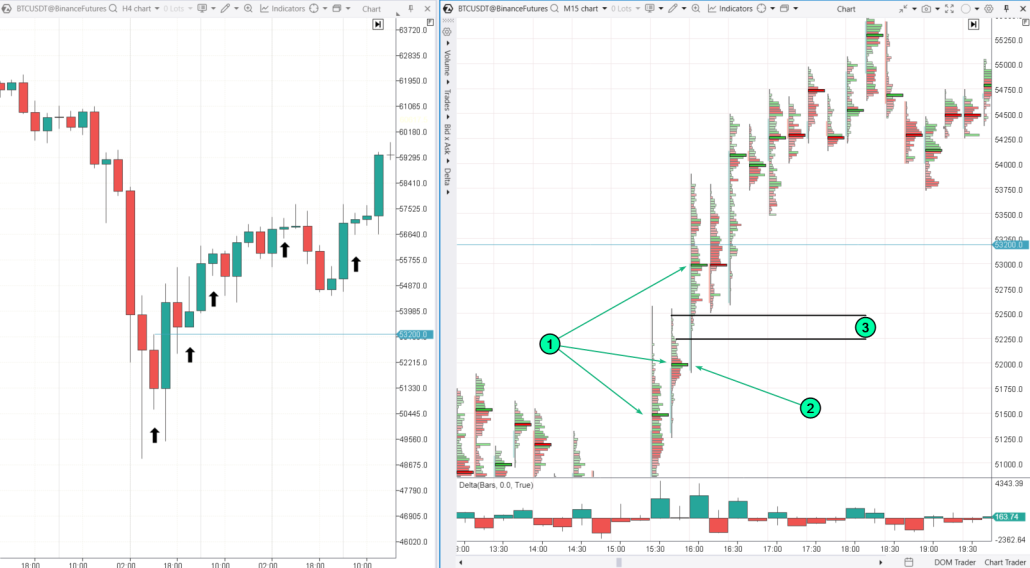
The chart on the right is a 15-minute footprint, showing how the bullish breakout at the 53,200 level unfolded. The added Delta indicator helps illustrate the activity of buyers and sellers.
Bright green clusters (1) show bullish activity as the price moves up towards the 53,200 resistance level.
Key points:
- Number 2 indicates a test of the Point of Control (POC) at the low of the 16:00 candle. This could be a good opportunity to open a low-risk long position before the bullish breakout of the inside bar on the 4-hour chart.
- Number 3 shows a narrow profile area, which is a sign of bullish dominance, indicating that buyers had no trouble pushing the price higher. Such zones not only confirm market strength but can also be used as support for entering a long position. In this case, this support zone prevented the price from falling below during the 16:15 and 16:30 candles.
This example demonstrates that footprint charts are a versatile tool for confirming classic technical analysis signals, such as the breakout of an inside bar.
More on the topic:
- How to Read a Footprint Chart?
- Basics of Reading Footprint Charts
- How to Use Footprint Charts for Profitable Trading
Pros and Cons of Trading Inside Bars
Pros of trading inside bars
✔ Simple to interpret. Classic inside bars often appear after sharp price movements, signaling a consolidation period where market participants are assessing the next direction.
✔ Potential for profitable entries. Traders wait for the price to break out above or below the inside bar, and then enter the trade in that direction, hoping it will lead to a strong trend.
✔ Versatility. Inside bars work well in different market conditions and timeframes, whether you are trading trends or looking for reversals.
✔ Flexibility. You can enhance your inside bar trading strategy with various tools like indicator signals, support and resistance levels, and fundamental analysis. Adding the Inside Bar indicator to your chart makes it even easier to spot the pattern!
Risks of using inside bars
✘ False breakouts. Inside bars can lead to losing trades if there are false breakouts — when the price moves out of the inside bar range but then quickly reverses.
✘ Low volatility. When volatility is low, inside bars might form without leading to significant price movement, making trading harder.
✘ Context matters. The overall market situation and previous price movements are crucial. An inside bar formed during uncertainty or a flat market might not give a clear signal for future price direction.
✘ Risk of significant losses. Stop-loss orders are typically placed just outside the inside bar’s range — below the low for bullish breakouts and above the high for bearish breakouts. If the inside bar is quite wide, this can lead to higher risk.
✘ Uncertainty in setting take-profit. If your stop-loss is placed beyond the opposite edge of the inside bar, you might set your take-profit at a distance that is twice the size of the stop, or near a key support/resistance level, or use a trailing stop.
Indicator for Identifying Inside Bars
The Inside Bar indicator highlights the boundaries of wide candles within which subsequent candles fall, identifying them as inside bars.
- Download ATAS for free, install, and launch the platform.
- Open the chart for your chosen instrument.
Open the indicator manager by pressing Ctrl+I. Select “Inside Bar” from the list, add it to the chart, and click OK. For more details on the indicator and its settings, check the Knowledge Base.
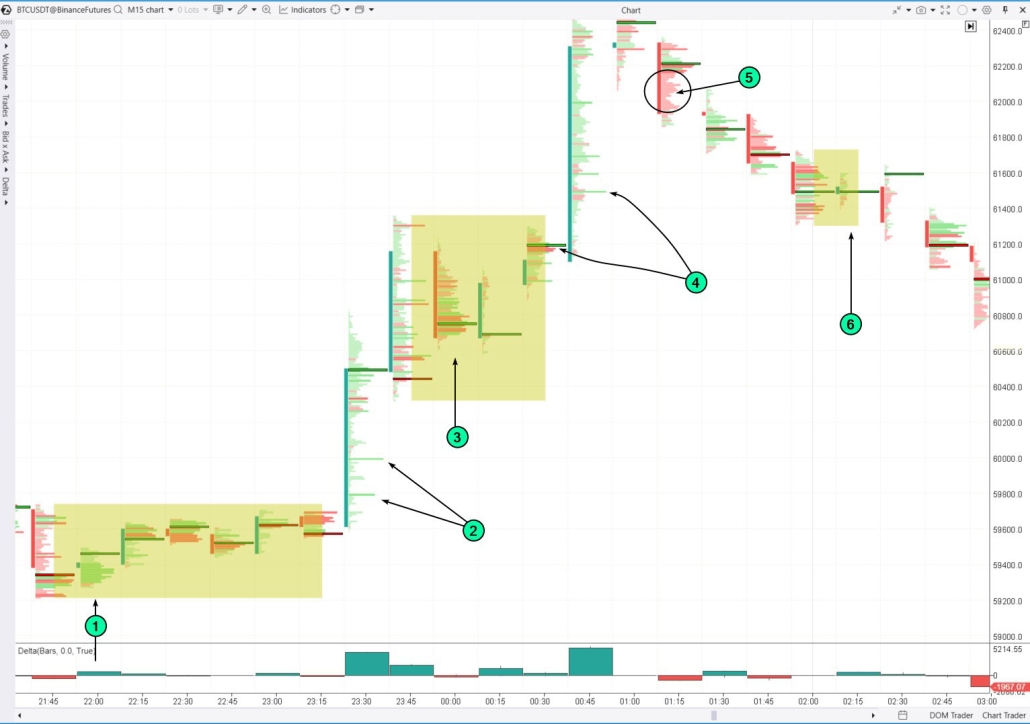
In the screenshot of the 15-minute cluster chart for BTC/USD, the numbers indicate:
1 — the inside bar in the indecision zone that has been highlighted by the indicator.
2 — a bullish breakout of the indecision zone. Bright green clusters indicate strong buying pressure. This activity might be driven by positive news.
3 — another inside bar. Market participants seem to be questioning if the current price fully reflects the recent positive news. The indicator highlights this area, reflecting a balance between supply and demand.
4 — signs of the buyer activity: demand outweighs supply, pushing the price upwards from the equilibrium zone.
5 — sellers’ dominance zone. Sellers may have found the new price too high for Bitcoin. This zone acted as resistance on the next bar.
6 — another inside bar: it shows reduced market activity, probably due to off-hours in major financial centers.
Double Inside Bar
A double inside bar consists of three candles. It forms when two consecutive candles (bars) stay entirely within the range of the previous candle. This suggests even greater market consolidation compared to a single inside bar, indicating strong accumulation or uncertainty among traders.
Example on a Bitcoin price chart:
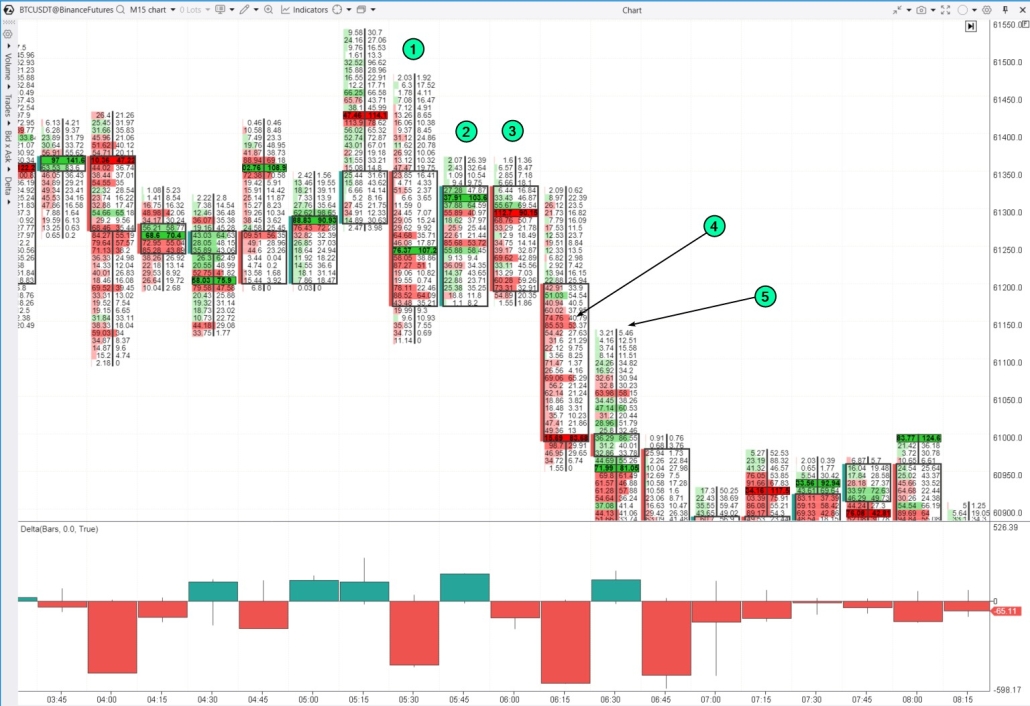
The first candle (1) is the widest.
The second candle (2) remains within the range of the first.
The third candle (3) stays within the range of the second.
The bright red clusters indicate strong selling activity (4). Market sells confirm aggressive selling pressure breaking out of the consolidation zone formed by the double inside bar.
A test of the breakout from the consolidation zone formed by the double inside bar (5).
What Does a Three-Bar Inside Bar Pattern Mean?
A Three-Bar Inside Bar Pattern is a rare trading scenario where three consecutive candles (bars) are fully contained within the range of the previous candle. This pattern highlights an even greater level of consolidation and market indecision compared to a single or double inside bar.
This pattern can occur either due to using a very small timeframe or because the market is in a flat.
Example on a 1-minute S&P 500 futures chart.
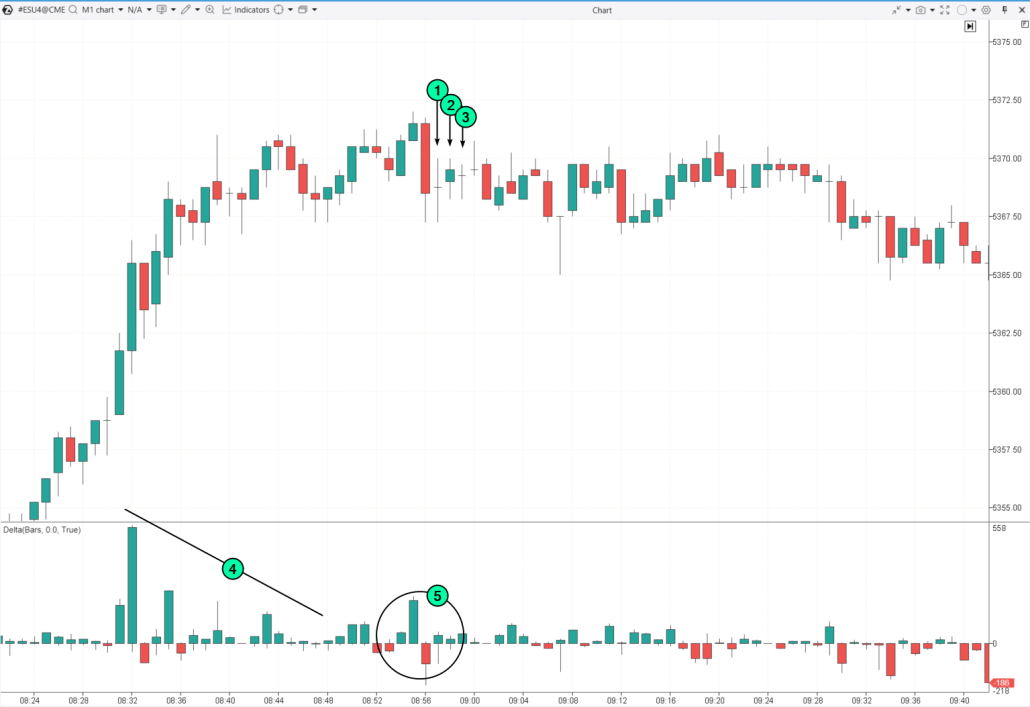
Numbers 1–2–3 indicate a three-bar inside bar. It formed after a spike in buying activity, possibly triggered by news during the early European trading session.
Over time, the buying activity started to fade (4). A sudden shift in the Delta indicator’s color (5) shows that the buyers’ efforts were unsuccessful, we can see signs of seller aggression. This led to market hesitation, causing the price to stop and eventually start to gradually decline.
What Is the Inside Bar Pattern Strategy?
There are two main ways to trade an inside bar pattern:
- Setting pending orders at the inside bar’s boundaries.
- Waiting for the candle to close after it breaks the inside bar.
Placing pending orders at the inside bar’s boundaries means the order will automatically trigger when the price reaches the breakout level. This approach enables traders to capture a potentially profitable position at the beginning of the move without constantly monitoring the market. However, the risk is that a false breakout could occur — where the price triggers the order but then returns to the inside bar’s range, leading to losses.
Waiting for the breakout candle to close gives a trader more certainty that the price movement beyond the inside bar is strong and likely to continue. The risk here is that the trader might enter the position after a significant part of the move has already occurred.
Which method should you choose for trading inside bars? Instead of sticking to a linear two-bar strategy, it might be more effective to focus on the overall market context and use footprint charts. This approach allows for a deeper understanding of buyer and seller dynamics during inside bar breakouts.
Trading Inside Bar Breakouts with Footprint Charts
The classic strategy for trading inside bars involves waiting for the price to break either the upper or lower boundary of the inside bar and then entering the trade in the direction of the breakout. A stop-loss is typically placed just beyond the opposite boundary of the inside bar.
Modern volume analysis tools enhance the effectiveness of this approach, as we have illustrated in previous examples.
Example. A 10-minute footprint chart of Nasdaq 100 futures.
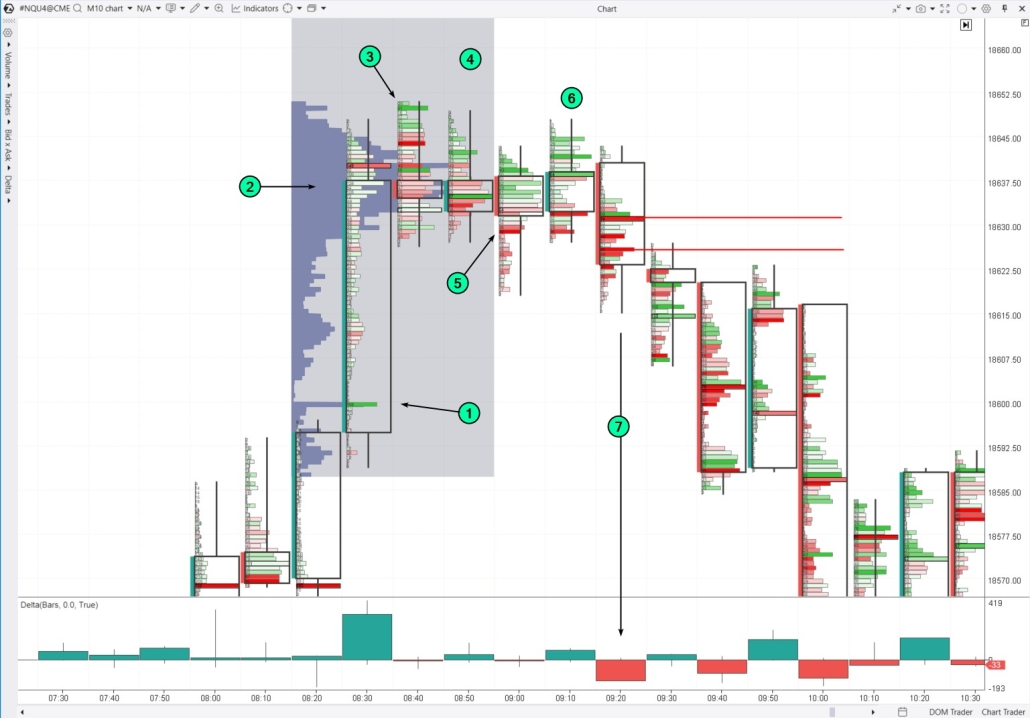
1 — a strong buying effort is noticeable at the breakout of the 18,600 level, shown by a bright green cluster. After breaking through this level, the price increases sharply, which is reflected in the narrow profile. However, the momentum starts to slow down after surpassing 18,630, as indicated by a bulge in the profile around 18,636 (2).
A clear bearish signal emerges on the 08:40 candle. The combination of a bright green cluster at the top (3) and the closing price far from the high suggests a possible bull trap.
4 — an inside bar (4) forms next, offering a chance to enter a short position on the break of its low in the following candle, with a stop-loss placed above the inside bar, following classic trading rules.
5 — a bearish breakout of the previous candle’s low, which is an inside bar, is accompanied by bright red clusters on the footprint chart, indicating seller activity. However, despite appearing to be a legitimate bearish breakout, it turned out to be premature, as there was no spike in negative values on the Delta indicator.
6 — the price approached the upper boundary of the inside bar once more. At this point:
- there are still signs of a bull trap, with bright green clusters near the high and the closing price below them.
- fortunately, the price did not trigger the stop-loss set above the inside bar.
7 — clear signs of increased selling pressure. The Delta indicator shows a spike in negative values, and the candle closes below the bright red clusters. The red lines extending from these clusters indicate a resistance zone that proved effective later.
Entry points for a short position at the candle near the red lines (7) or on the break of the inside bar’s low (4) would be at roughly the same level. However, the second entry appears more well-supported due to the additional information from the footprint chart. This position would probably show positive PnL.
Test of an Inside Bar Breakout
This strategy involves entering a position on a pullback to the breakout level of the inside bar.
Example. Hourly footprint chart for oil futures.
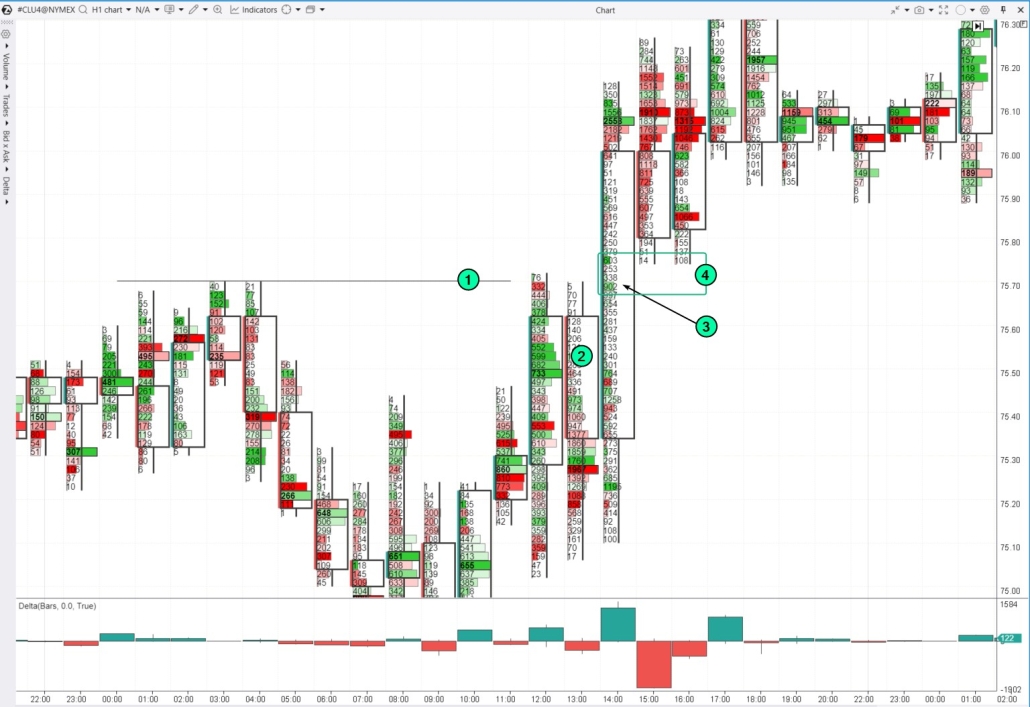
An inside bar (2) formed just below the resistance level (1), indicating some temporary indecision among market participants. Buyers seemed uncertain about the resistance breakout.
However, the bullish breakout of resistance occurred on the 14:00 candle. The price closed above the breakout level, and there are bright green clusters around the breakout level. The breakout coincided with the price moving beyond the inside bar boundaries (3).
It is better to wait for a test of the breakout level before entering a long position at the green clusters, where buyers have shown their dominance. The following two candles provided a chance to implement this strategy (4).
False Breakout
Typically, an inside bar signals market consolidation. However, breaking the boundaries of an inside bar might only signal an expansion of the consolidation zone. When smart money does not see any drivers for a trending move, they often capitalize on price fluctuations within the flat range, using false breakouts to build their positions — and that is just one of their strategies.
Example. A 10-minute footprint chart of Nasdaq 100 futures.
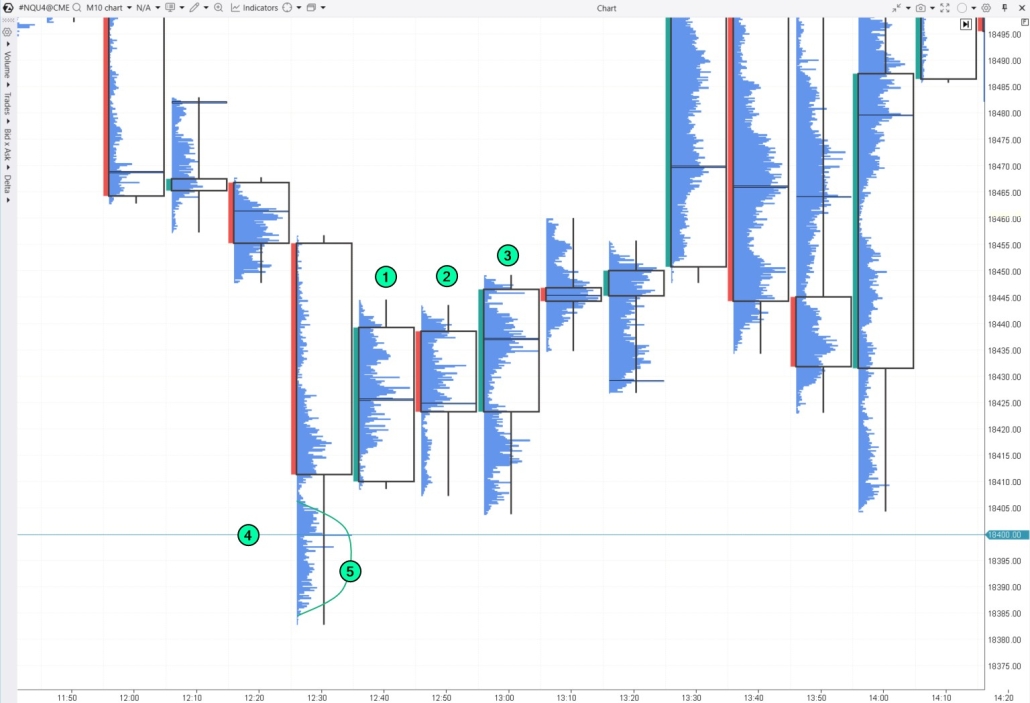
1 — an example of an inside bar
2 — this candle shows a bearish breakout of the inside bar, which suggests opening a short position. However, this position would likely hit its stop-loss on the very next candle (3).
Contextual analysis can provide valuable clues. On the candle before the inside bar, the price briefly dipped below the round psychological level of 18,400 during the day but closed above it (4). This could have been a stop-loss hunting targeted at retail traders, while a larger player was building a long position. The bulge on the footprint profile (5) might indicate trades executed with this in mind.
If that is the case, the larger player might trigger enough stops to prevent further declines. Therefore, the bearish breakout of the inside bar (2) would be a low priority for a trader who reads the footprint. Instead, they might trade false breakouts of the lows, expecting the price to move upward after triggering buyers’ stop-losses.
More on the topic:
FAQ
What is a bar in trading?
In trading, a bar is a visual representation of price data for a specific time period. It shows the opening price, closing price, and the highest and lowest prices during that time. A candlestick displays the same information but in a different format.
What is the significance of the inside bar?
An inside bar is a pattern that often indicates a period of market consolidation or uncertainty. It occurs when the price is contained within the range of the previous bar. This pattern can suggest a pause before the current trend continues or a potential reversal, depending on the subsequent breakout from this range.
Is an inside bar bullish or bearish?
The inside bar pattern can signal either a bullish or bearish move, depending on the market context and preceding trend. It represents a period of consolidation, after which the price could move in either direction.
Is the inside bar pattern accurate?
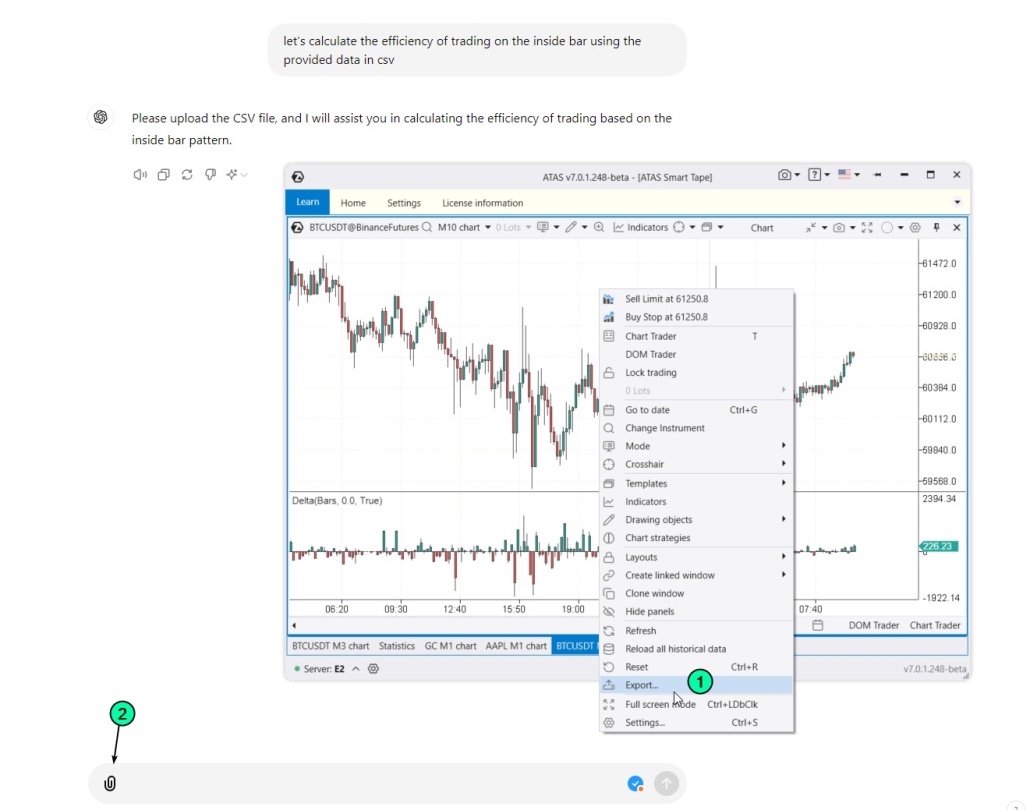
Let’s conduct a quick study. We will export candlestick data from ATAS into a .csv file (1), then upload it (2) to ChatGPT for an unbiased analysis from AI.
We used BTC/USDT data from Binance Futures on a 10-minute timeframe over 100 days. During this period, 1,916 inside bars were identified.
We asked ChatGPT to calculate the profitability of a strategy using the following rules:
- identify an inside bar;
- suppose we place a buy-stop at the upper boundary and a sell-stop at the lower boundary of the inside bar;
- observe the next candle. If it triggers the buy-stop, calculate the profit from holding a long position until the close of the next candle after the inside bar. If it triggers the sell-stop, calculate the profit from holding a short position until the close of the next candle after the inside bar. If the candle triggers both orders, we take a loss.
Summary. The average profit per trade is $27.67 when trading 1 Bitcoin, excluding other factors.
Theoretical calculations show only a modest positive return from trading inside bars. In reality, this could easily turn into losses due to commissions, slippage, and other costs.
In other words, relying solely on a mechanical inside-bar strategy is unlikely to be profitable. It is important to incorporate more effective tools into your trading approach.
How to Learn to Trade Inside Bars Profitably
Use footprint charts and other tools to professionally analyze buying and selling dynamics. This will help you build a trading strategy based on inside bars and other classic patterns. The next step is to practice this strategy on live charts.
The ATAS Market Replay simulator is perfect for this. It enables you to test trading inside bars and other patterns with footprint charts and/or other indicators, all without risking real money.
To do this, download the ATAS platform for free, install, and launch it, and then:
- Open the price chart.
- Click on the Market Replay button in the main ATAS menu.
- Activate the Replay mode (the icon should turn green).
- Adjust settings if necessary (date, data type).
- Start the playback and become a profitable trader.
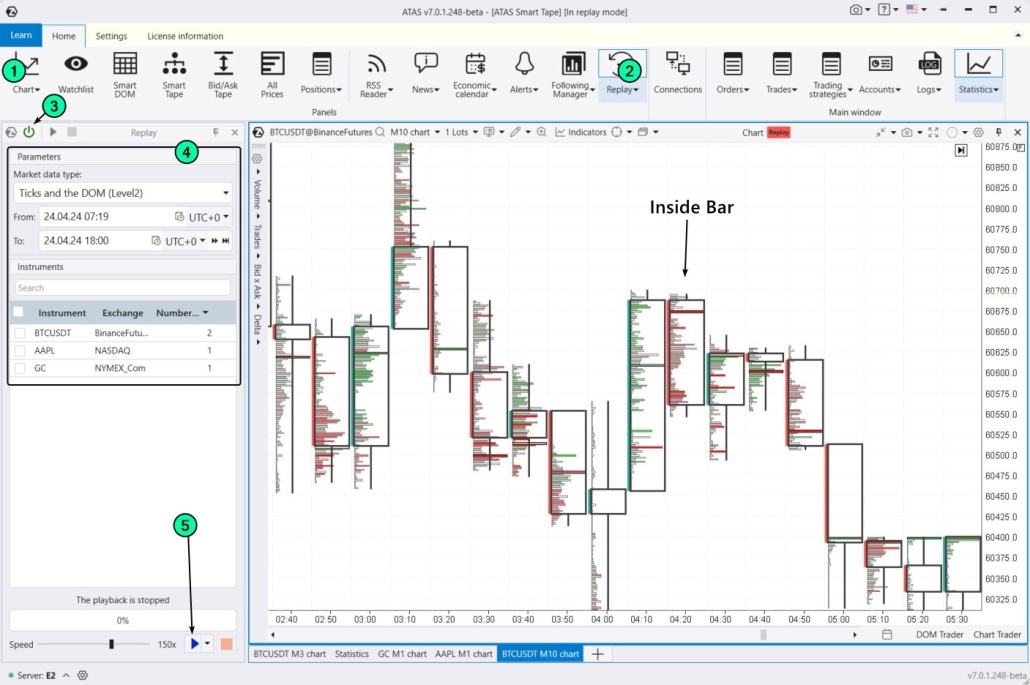
The chart above shows an example of an inside bar. You can see that buyers were trapped at the top of the previous candle. The red clusters on the inside bar suggest increased selling activity around the 60675 level, which generally indicates a preference for short positions.
During your training in the Market Replay simulator, you can:
- adjust the playback speed, and pause;
- test your strategies, monitor signals from over 400 indicators;
- use Chart Trader and other features to trade on the built-in demo Replay account and then analyze your performance;
- use drawing objects, for example, mark support and resistance levels;
- use various chart types (e.g., non-standard Range XV);
- use exit strategies;
- analyze volumes in the Level II order book, for instance, using the DOM Levels indicator;
- and much more.
ATAS enables you to load tick history from different markets, not just cryptocurrencies, providing you with a comprehensive foundation for identifying patterns in price and volume interactions.
Conclusions
The Inside Bar pattern consists of two candles, where the second candle is completely contained within the high and low of the first. It is believed that:
- a drop in volatility indicated by this pattern suggests that market participants are uncertain about the future direction of the price;
- a breakout from the Inside Bar’s range might signal the start of a new trend. The classic trading strategy involves opening a position on this breakout.
In practice, the chance of making a profit with this simple approach is about 50% (not including costs). To gain a real advantage, traders should use advanced tools that show the dynamics of buying and selling activity, such as footprint charts.
Download ATAS. It is free. Once you install the platform, you will automatically get the free START plan, which includes cryptocurrency trading and basic features. You can use this plan for as long as you like before deciding to upgrade to a more advanced plan for additional ATAS tools. You can also activate the Free Trial at any time, giving you 14 days of full access to all the platform’s features. This trial allows you to explore the benefits of higher-tier plans and make a well-informed decision about purchasing.
Do not miss the next article on our blog. Subscribe to our YouTube channel, follow us on Facebook, Instagram, Telegram or X, where we publish the latest ATAS news. Share life hacks and seek advice from other traders in the Telegram group @ATAS_Discussions.
Information in this article cannot be perceived as a call for investing or buying/selling of any asset on the exchange. All situations, discussed in the article, are provided with the purpose of getting acquainted with the functionality and advantages of the ATAS platform.


